Moving Averages (Power BI Report)
APPLIES TO: Generally available in Business Central 2024 release wave 2 (version 25.1).
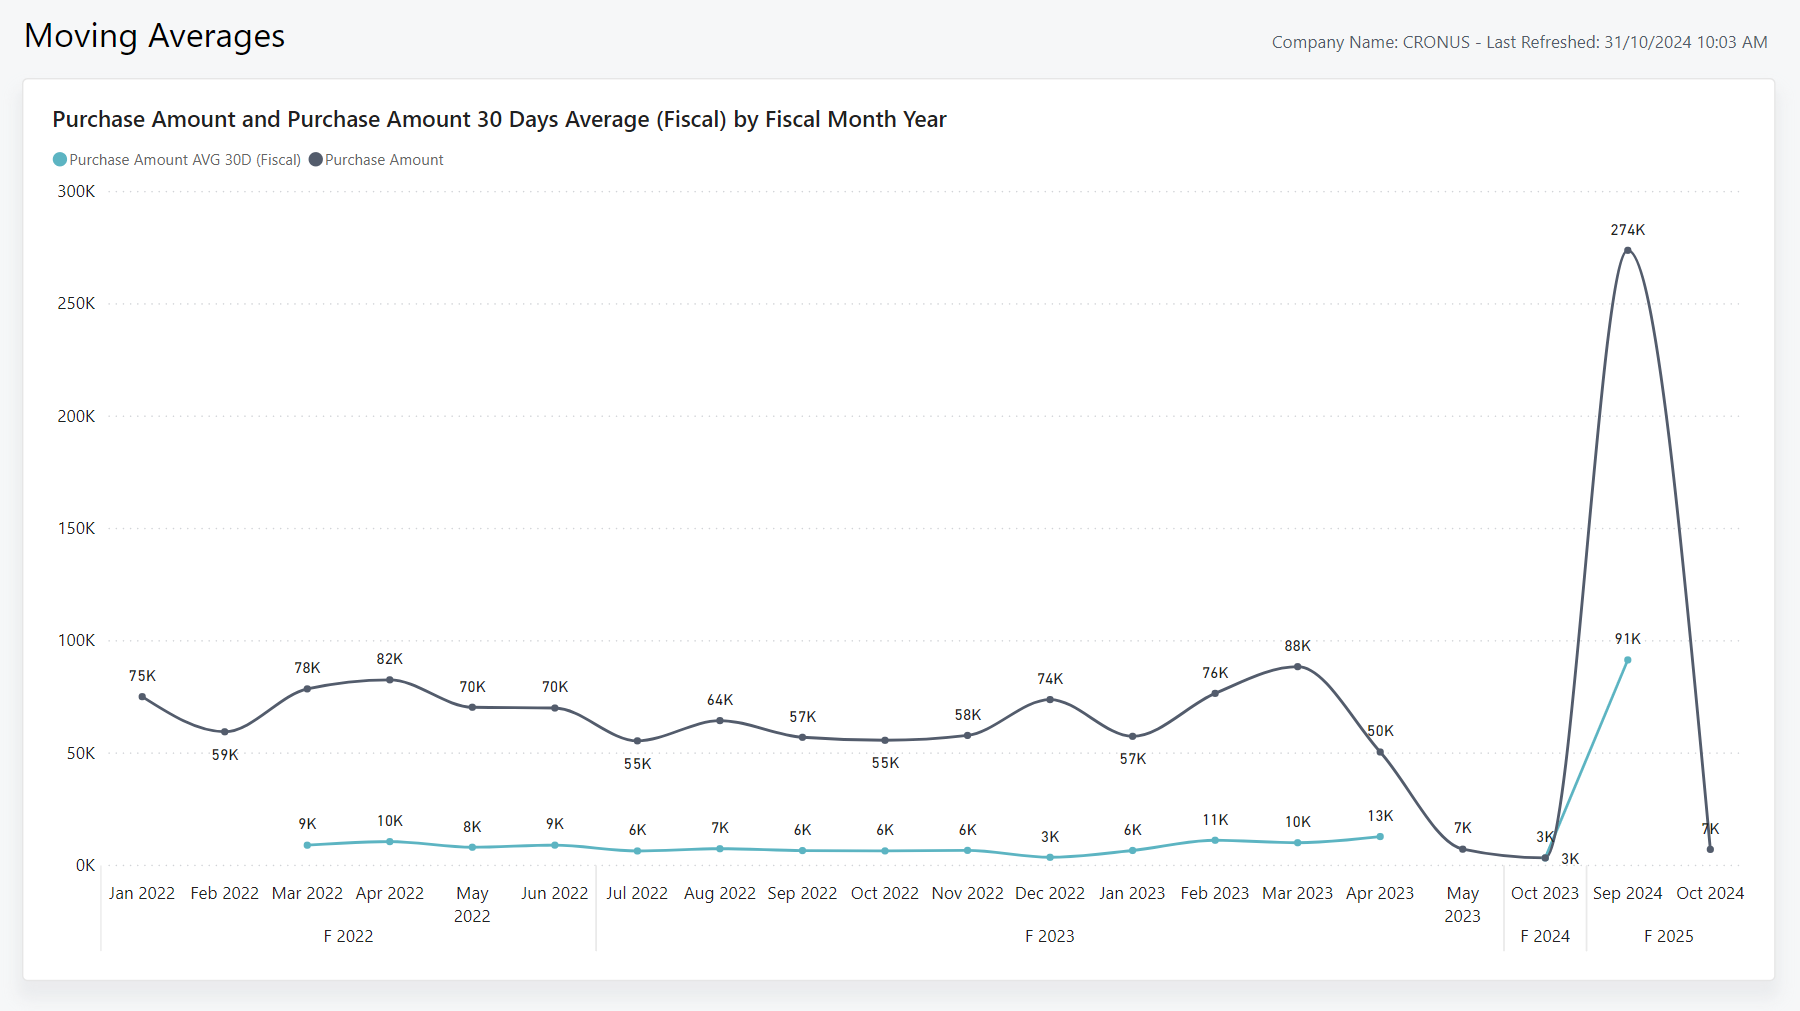
The Moving Averages report provides a comprehensive overview of your average purchases over a 30-day period. This report focuses on the purchase amount and compares the current purchase amount to a 30-day average. The comparison lets you quickly identify deviations from the norm. Use this information to address issues and ensure that purchasing activities align with business operations and profitability.
Use the report
The report helps management teams find key trends and make changes based on average purchase metrics.
CEOs need to track the moving average of purchase amounts over a specific period. Use this report to see performance trends and get help to make short term strategic decisions based on the trends.
Purchasing managers want to know which periods have a higher demand than others to plan purchasing schedules and budget accordingly. Use the report to analyze historical data and forecast upcoming trends so you can optimize inventory levels and reduce stock-outs.
For example, you might notice that purchasing demands are often higher towards the end of the year. You can work with your team to plan ahead and allocate staff to handle workload spikes.
Key Performance Indicators (KPIs)
The Moving Averages report includes the following KPIs and measures:
Click on the link for a KPI to learn more about what it means, how it is calculated, and what data was used in the calculations.
Tip
You can easily track the KPIs that the Power BI reports display against your business objectives. To learn more, go to Track your business KPIs with Power BI metrics.
Data used in the report
The report uses data from the following tables in Business Central:
- Value Entry
- Purchase Line
Try the report
Try the report here: Moving Averages
Tip
If you hold down the CTRL key while you select the report link, the report opens on a new browser tab. In this way, you can stay on the current page while you explore the report on the other browser tab.
See also
Track KPIs with Power BI metrics
Power BI Purchasing app
Ad hoc analysis of purchasing data
Built-in purchasing reports
Purchasing analytics overview
Purchasing overview
