Distributed tracing in System.Net libraries
Distributed tracing is a diagnostic technique that helps engineers localize failures and performance issues within applications, especially those that are distributed across multiple machines or processes. This technique tracks requests through an application by correlating together work done by different components and separating it from other work the application might be doing for concurrent requests. For example, a request to a typical web service might be first received by a load balancer and then forwarded to a web server process, which then makes several queries to a database. Distributed tracing allows engineers to distinguish if any of those steps failed and how long each step took. It can also log messages produced by each step as it ran.
The tracing system in .NET is designed to work with OpenTelemetry (OTel), and uses OTel to export the data to monitoring systems. Tracing in .NET is implemented using the System.Diagnostics APIs, where a unit of work is represented by the System.Diagnostics.Activity class, which corresponds to an OTel span. OpenTelemetry defines an industry-wide standard naming scheme for spans (activities) together with their attributes (tags), known as semantic conventions. The .NET telemetry uses existing semantic conventions wherever possible.
Note
The terms span and activity are synonymous in this article. In context of .NET code, they refer to a System.Diagnostics.Activity instance. Don't confuse the OTel span with System.Span<T>.
Tip
For a comprehensive list of all built-in activities together with their tags/attributes, see Built-in activities in .NET.
Instrumentation
To emit traces, the System.Net libraries are instrumented with built-in ActivitySource sources, which create Activity objects to track the work performed. Activities are only created if there are listeners subscribed to the ActivitySource.
The built-in instrumentation evolved with .NET versions.
- On .NET 8 and earlier, the instrumentation is limited to the creation of an empty HTTP client request activity. This means that users have to rely on the
OpenTelemetry.Instrumentation.Httplibrary to populate the activity with the information (for example, tags) needed to emit useful traces. - .NET 9 extended the instrumentation by emitting the name, status, exception info, and the most important tags according to the OTel HTTP client semantic conventions on the HTTP client request activity. This means that on .NET 9+, the
OpenTelemetry.Instrumentation.Httpdependency can be omitted, unless more advanced features like enrichment are required. - .NET 9 also introduced experimental connection tracing, adding new activities across the
System.Netlibraries to support diagnosing connection issues.
Collect System.Net traces
At the lowest level, trace collection is supported via the AddActivityListener method, which registers ActivityListener objects containing user-defined logic.
However, as an application developer, you would likely prefer to rely on the rich ecosystem built upon the features provided by the OpenTelemetry .NET SDK to collect, export, and monitor traces.
- To get a fundamental understanding on trace collection with OTel, see our guide on collecting traces using OpenTelemetry.
- For production-time trace collection and monitoring, you can use OpenTelemetry with Prometheus, Grafana, and Jaeger or with Azure Monitor and Application Insights. However, these tools are quite complex and might be inconvenient to use at development time.
- For development-time trace collection and monitoring, we recommend using .NET Aspire which provides a simple but extensible way to kickstart distributed tracing in your application and to diagnose issues locally.
- It's also possible to reuse the Aspire Service Defaults project without the Aspire orchestration. This is a handy way to introduce and configure OpenTelemetry tracing and metrics in your ASP.NET projects.
Collect traces with .NET Aspire
A simple way to collect traces and metrics in ASP.NET applications is to use .NET Aspire. .NET Aspire is a set of extensions to .NET to make it easy to create and work with distributed applications. One of the benefits of using .NET Aspire is that telemetry is built in, using the OpenTelemetry libraries for .NET.
The default project templates for .NET Aspire contain a ServiceDefaults project. Each service in the .NET Aspire solution has a reference to the Service Defaults project. The services use it to set up and configure OTel.
The Service Defaults project template includes the OTel SDK, ASP.NET, HttpClient, and Runtime Instrumentation packages. These instrumentation components are configured in the Extensions.cs file. To support telemetry visualization in Aspire Dashboard, the Service Defaults project also includes the OTLP exporter by default.
Aspire Dashboard is designed to bring telemetry observation to the local debug cycle, which enables developers to ensure that the applications are producing telemetry. The telemetry visualization also helps to diagnose those applications locally. Being able to observe the calls between services is as useful at debug time as in production. The .NET Aspire dashboard is launched automatically when you F5 the AppHost Project from Visual Studio or dotnet run the AppHost project from command line.

For more information on .NET Aspire, see:
Reuse Service Defaults project without .NET Aspire Orchestration
The Aspire Service Defaults project provides an easy way to configure OTel for ASP.NET projects, even if not using the rest of .NET Aspire such as the AppHost for orchestration. The Service Defaults project is available as a project template via Visual Studio or dotnet new. It configures OTel and sets up the OTLP exporter. You can then use the OTel environment variables to configure the OTLP endpoint to send telemetry to, and provide the resource properties for the application.
The steps to use ServiceDefaults outside .NET Aspire are:
Add the ServiceDefaults project to the solution using Add New Project in Visual Studio, or use
dotnet new:dotnet new aspire-servicedefaults --output ServiceDefaultsReference the ServiceDefaults project from your ASP.NET application. In Visual Studio, select Add > Project Reference and select the ServiceDefaults project"
Call the OpenTelemetry setup function
ConfigureOpenTelemetry()as part of your application builder initialization.var builder = WebApplication.CreateBuilder(args) builder.ConfigureOpenTelemetry(); // Extension method from ServiceDefaults. var app = builder.Build(); app.MapGet("/", () => "Hello World!"); app.Run();
For a full walkthrough, see Example: Use OpenTelemetry with OTLP and the standalone Aspire Dashboard.
Experimental connection tracing
When troubleshooting HttpClient issues or bottlenecks, it might be crucial to see where time is being spent when sending HTTP requests. Often, the problem occurs during HTTP connection establishment, which typically breaks down to DNS lookup, TCP connection, and TLS handshake.
.NET 9 introduced experimental connection tracing adding an HTTP connection setup span with three child spans representing the DNS, TCP, and TLS phases of the connection establishment. The HTTP part of the connection tracing is implemented within SocketsHttpHandler, meaning that the activity model has to respect the underlying connection pooling behavior.
Note
In SocketsHttpHandler, connections and requests have independent lifecycles. A pooled connection can live for a long time and serve many requests. When making a request, if there's no connection immediately available in the connection pool, the request is added to a request queue to wait for an available connection. There's no direct relationship between waiting requests and connections. The connection process might have started when another connection became available for use, in which case the freed connection is used. As a result, the HTTP connection setup span isn't modeled as a child of the HTTP client request span; instead, span links are used.
.NET 9 introduced the following spans to enable collecting detailed connection information:
| Name | ActivitySource | Description |
|---|---|---|
HTTP wait_for_connection |
Experimental.System.Net.Http.Connections |
A child span of the HTTP client request span that represents the time interval the request is waiting for an available connection in the request queue. |
HTTP connection_setup |
Experimental.System.Net.Http.Connections |
Represents the establishment of the HTTP connection. A separate trace root span with its own TraceId. HTTP client request spans might contain links to HTTP connection_setup. |
DNS lookup |
Experimental.System.Net.NameResolution |
DNS lookup performed by the Dns class. |
socket connect |
Experimental.System.Net.Sockets |
Establishment of a Socket connection. |
TLS handshake |
Experimental.System.Net.Security |
TLS client or server handshake performed by SslStream. |
Note
The corresponding ActivitySource names start with the prefix Experimental, as these spans might be changed in future versions as we learn more about how well they work in production.
These spans are too verbose for use 24x7 in production scenarios with high workloads - they're noisy and this level of instrumentation isn't normally needed. However, if you're trying to diagnose connection issues or get a deeper understanding of how network and connection latency is affecting your services, then they provide insight that's hard to collect by other means.
When the Experimental.System.Net.Http.Connections ActivitySource is enabled, the HTTP client request span contains a link to the HTTP connection_setup span corresponding to the connection serving the request. As an HTTP connection can be long lived, this could result in many links to the connection span from each of the request activities. Some APM monitoring tools aggressively walk links between spans to build up their views, and so including this span can cause issues when the tools weren't designed to account for large numbers of links.
The following diagram illustrates the behavior of the spans and their relationship:

Walkthrough: Using the experimental connection tracing in .NET 9
This walkthrough uses a .NET 9 Aspire Starter App to demonstrate connection tracing, but it should be easy to set it up with other monitoring tools as well. The key step is to enable the ActivitySources.
Create a .NET Aspire 9 Starter App by using
dotnet new:dotnet new aspire-starter-9 --output ConnectionTracingDemoOr in Visual Studio:
Open
Extensions.csin theServiceDefaultsproject, and edit theConfigureOpenTelemetrymethod adding the ActivitySources for connection in the tracing configuration callback:.WithTracing(tracing => { tracing.AddAspNetCoreInstrumentation() // Instead of using .AddHttpClientInstrumentation() // .NET 9 allows to add the ActivitySources directly. .AddSource("System.Net.Http") // Add the experimental connection tracking ActivitySources using a wildcard. .AddSource("Experimental.System.Net.*"); });Start the solution. This should open the .NET Aspire Dashboard.
Navigate to the Weather page of the
webfrontendapp to generate anHttpClientrequest towardsapiservice.Return to the Dashboard and navigate to the Traces page. Open the
webfrontend: GET /weathertrace.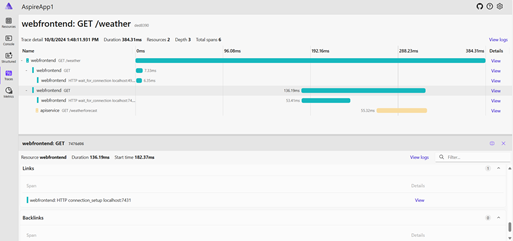

When HTTP requests are made with the connection instrumentation enabled, you should see the following changes to the client request spans:
- If a connection needs to be established, or if the app is waiting for a connection from the connection pool, then an additional
HTTP wait_for_connectionspan is shown, which represents the delay for waiting for a connection to be made. This helps to understand delays between theHttpClientrequest being made in code, and when the processing of the request actually starts. In the previous image:- The selected span is the HttpClient request.
- The span below represents the time the request spends waiting for a connection to be established.
- The last span in yellow is from the destination processing the request.
- The HttpClient span will have a link to the
HTTP connection_setupspan, which represents the activity to create the HTTP connection used by the request.

As mentioned previously, the HTTP connection_setup span is a separate span with its own TraceId, as its lifetime is independent from each individual client request. This span typically has child spans DNS lookup, (TCP) socket connect, and TLS client handshake.
Enrichment
In some cases, it's necessary to augment the existing System.Net tracing functionality. Typically this means injecting additional tags/attributes to the built-in activities. This is called enrichment.
Enrichment API in the OpenTelemetry instrumentation library
To add additional tags/attributes to the HTTP client request activity, the simplest approach is to use the HttpClient enrichment APIs of the OpenTelemetry HttpClient and HttpWebRequest instrumentation library. This requires taking a dependency on the OpenTelemetry.Instrumentation.Http package.
Manual enrichment
It's possible to implement the enrichment of the HTTP client request activity manually. For this you need to access Activity.Current in the code that is running in the scope of the request activity, before the activity is finished. This can be done by implementing an IObserver<DiagnosticListener> and subscribing it to AllListeners to get callbacks for when networking activity is occurring. In fact, this is how the OpenTelemetry HttpClient and HttpWebRequest instrumentation library is implemented. For a code example, see the subscription code in DiagnosticSourceSubscriber.cs and the underlying implementation in HttpHandlerDiagnosticListener.cs where the notifications are delegated to.
Need more tracing?
If you have suggestions for other useful information that could be exposed via tracing, create a dotnet/runtime issue.