Aggregated reporting in Microsoft Defender for Endpoint
Aggregated reporting addresses constraints on event reporting in Microsoft Defender for Endpoint. Aggregated reporting extends signal reporting intervals to significantly reduce the size of reported events while preserving essential event properties.
Defender for Endpoint reduces noise in collected data to improve the signal-to-noise ratio while balancing product performance and efficiency. It limits data collection to maintain this balance.
With aggregated reporting, Defender for Endpoint ensures that all essential event properties valuable to investigation and threat hunting activities are continuously collected. It does this by extended reporting intervals of one hour, which reduces the size of reported events and enables efficient yet valuable data collection.
When aggregated reporting is turned on, you can query for a summary of all supported event types, including low-efficacy telemetry, that you can use for investigation and hunting activities.
Prerequisites
The following requirements must be met before turning on aggregated reporting:
- Defender for Endpoint Plan 2 license
- Permissions to enable advanced features
Aggregated reporting supports the following:
- Client version: Windows version 2411 and above
- Operating systems: Windows 11 22H2, Windows Server 2022, Windows 11 Enterprise, Windows 10 20H2, 21H1, 21H2, Windows Server version 20H2, and Windows Server 2019
Turn on aggregated reporting
To turn aggregated reporting on, go to Settings > Endpoints > Advanced features. Toggle on the Aggregated reporting feature.

Once aggregated reporting is turned on, it can take up to seven days for aggregated reports to become available. You can then begin to query new data after the feature is turned on.
When you turn off aggregated reporting, the changes take a few hours to be applied. All previously collected data remains.
Query aggregated reports
Aggregated reporting supports the following event types:
| Action type | Advanced hunting table | Device timeline presentation | Properties |
|---|---|---|---|
| FileCreatedAggregatedReport | DeviceFileEvents | {ProcessName} created {Occurrences} {FilePath} files | 1. File path 2. File extension 3. Process name |
| FileRenamedAggregatedReport | DeviceFileEvents | {ProcessName} renamed {Occurrences} {FilePath} files | 1. File path 2. File extension 3. Process name |
| FileModifiedAggregatedReport | DeviceFileEvents | {ProcessName} modified {Occurrences} {FilePath} files | 1. File path 2. File extension 3. Process name |
| ProcessCreatedAggregatedReport | DeviceProcessEvents | {InitiatingProcessName} created {Occurrences} {ProcessName} processes | 1. Initiating process command line 2. Initiating process SHA1 3. Initiating process file path 4. Process command line 5. Process SHA1 6. Folder path |
| ConnectionSuccessAggregatedReport | DeviceNetworkEvents | {InitiatingProcessName} established {Occurrences} connections with {RemoteIP}:{RemotePort} | 1. Initiating process name 2. Source IP 3. Remote IP 4. Remote port |
| ConnectionFailedAggregatedReport | DeviceNetworkEvents | {InitiatingProcessName} failed to establish {Occurrences} connections with {RemoteIP:RemotePort} | 1. Initiating process name 2. Source IP 3. Remote IP 4. Remote port |
| LogonSuccessAggregatedReport | DeviceLogonEvents | {Occurrences} {LogonType} logons by {UserName}\{DomainName} | 1. Target username 2. Target user SID 3. Target domain name 4. Logon type |
| LogonFailedAggregatedReport | DeviceLogonEvents | {Occurrences}{LogonType} logons failed by {UserName}\{DomainName} | 1. Target username 2. Target user SID 3. Target domain name 4. Logon type |
Note
Turning on aggregated reporting improves signal visibility, which might incur higher storage costs if you are streaming Defender for Endpoint advanced hunting tables to your SIEM or storage solutions.
To query new data with aggregated reports:
- Go to Investigation & response > Hunting > Custom detection rules.
- Review and modify existing rules and queries that might be affected by aggregated reporting.
- When necessary, create new custom rules to incorporate new action types.
- Go to the Advanced Hunting page and query the new data.
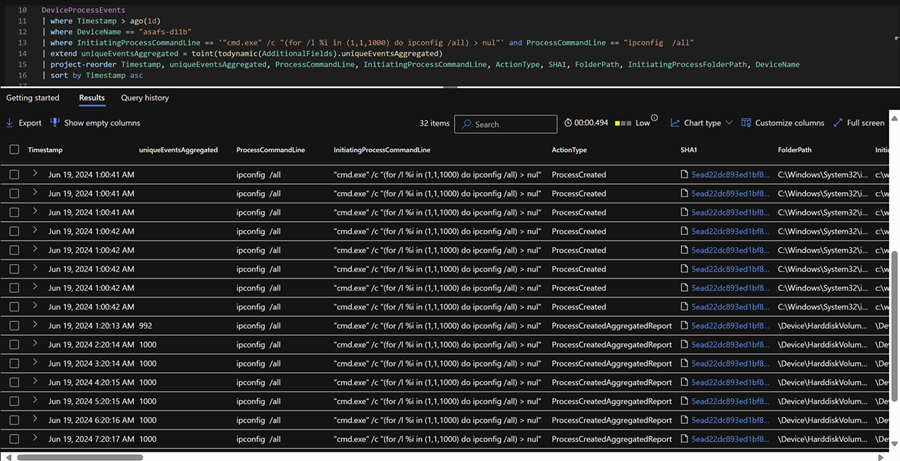
Here is an example of advanced hunting query results with aggregated reports.
Sample advanced hunting queries
You can use the following KQL queries to gather specific information using aggregated reporting.
Query for noisy process activity
The following query highlights noisy process activity, which can be correlated with malicious signals.
DeviceProcessEvents
| where Timestamp > ago(1h)
| where ActionType == "ProcessCreatedAggregatedReport"
| extend uniqueEventsAggregated = toint(todynamic(AdditionalFields).uniqueEventsAggregated)
| project-reorder Timestamp, uniqueEventsAggregated, ProcessCommandLine, InitiatingProcessCommandLine, ActionType, SHA1, FolderPath, InitiatingProcessFolderPath, DeviceName
| sort by uniqueEventsAggregated desc
Query for repeated sign in attempt failures
The following query identifies repeated sign-in attempt failures.
DeviceLogonEvents
| where Timestamp > ago(30d)
| where ActionType == "LogonFailedAggregatedReport"
| extend uniqueEventsAggregated = toint(todynamic(AdditionalFields).uniqueEventsAggregated)
| where uniqueEventsAggregated > 10
| project-reorder Timestamp, DeviceId, uniqueEventsAggregated, LogonType, AccountName, AccountDomain, AccountSid
| sort by uniqueEventsAggregated desc
Query for suspicious RDP connections
The following query identifies suspicious RDP connections, which might indicate malicious activity.
DeviceNetworkEvents
| where Timestamp > ago(1d)
| where ActionType endswith "AggregatedReport"
| where RemotePort == "3389"
| extend uniqueEventsAggregated = toint(todynamic(AdditionalFields).uniqueEventsAggregated)
| where uniqueEventsAggregated > 10
| project-reorder ActionType, Timestamp, uniqueEventsAggregated
| sort by uniqueEventsAggregated desc
