Use dev tunnels in Visual Studio to debug your web APIs
To quickly debug and test your web APIs within Microsoft Power Automate or Power Apps, use dev tunnels in Visual Studio. Dev tunnels enables ad-hoc connections between machines that can't directly connect to each other. Once you enable this feature, you'll see that debugging (F5) automatically creates a dev tunnel URL that you can use to connect to Power Apps or Power Automate.
Prerequisites
Download Visual Studio 2022 Preview version 17.6 or later with the ASP.NET and web development workload installed. You need to sign in to Visual Studio to create and use dev tunnels. The feature isn't available in Visual Studio for Mac.
One of the following Power Platform environments:
Note
If you need help getting started with Microsoft Power Platform, go to Create a developer environment.
Step 1: Configure your ASP.NET Core project in Visual Studio
In the debug dropdown menu, select Dev Tunnels > Create A Tunnel.
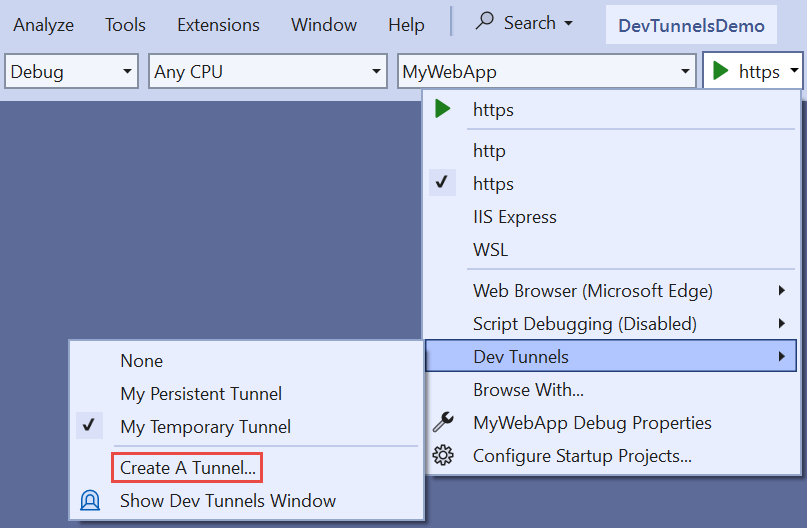
The tunnel creation dialog opens and you can configure dev tunnels. Make sure to set authentication type to Public.
To learn more, go to How to use dev tunnels in Visual Studio 2022 with ASP.NET Core apps.
Select OK. Visual Studio displays confirmation of tunnel creation. The tunnel is now enabled and appears in the debug dropdown Dev Tunnels flyout.
Select F5 (Debug > Start Debugging), or the Start Debugging button to see the dev tunnel URL.
URL with and without dev tunnels
To learn more, go to Use a tunnel.
Before debugging:
https://localhost:7223/swagger/index.htmlAfter debugging:
https://50tt58xr-7223.usw2.devtunnels.ms/swagger/indexf.html
Step 2: Create a custom connector for your web API using the dev tunnel URL
A custom connector is a wrapper around a REST API and allows Power Automate or Power Apps solutions to communicate with your web API. There are many ways to create a custom connector. The following sections explain how to use the dev tunnel URL and create a custom connector from scratch, or with API Management.
Create a custom connector from scratch
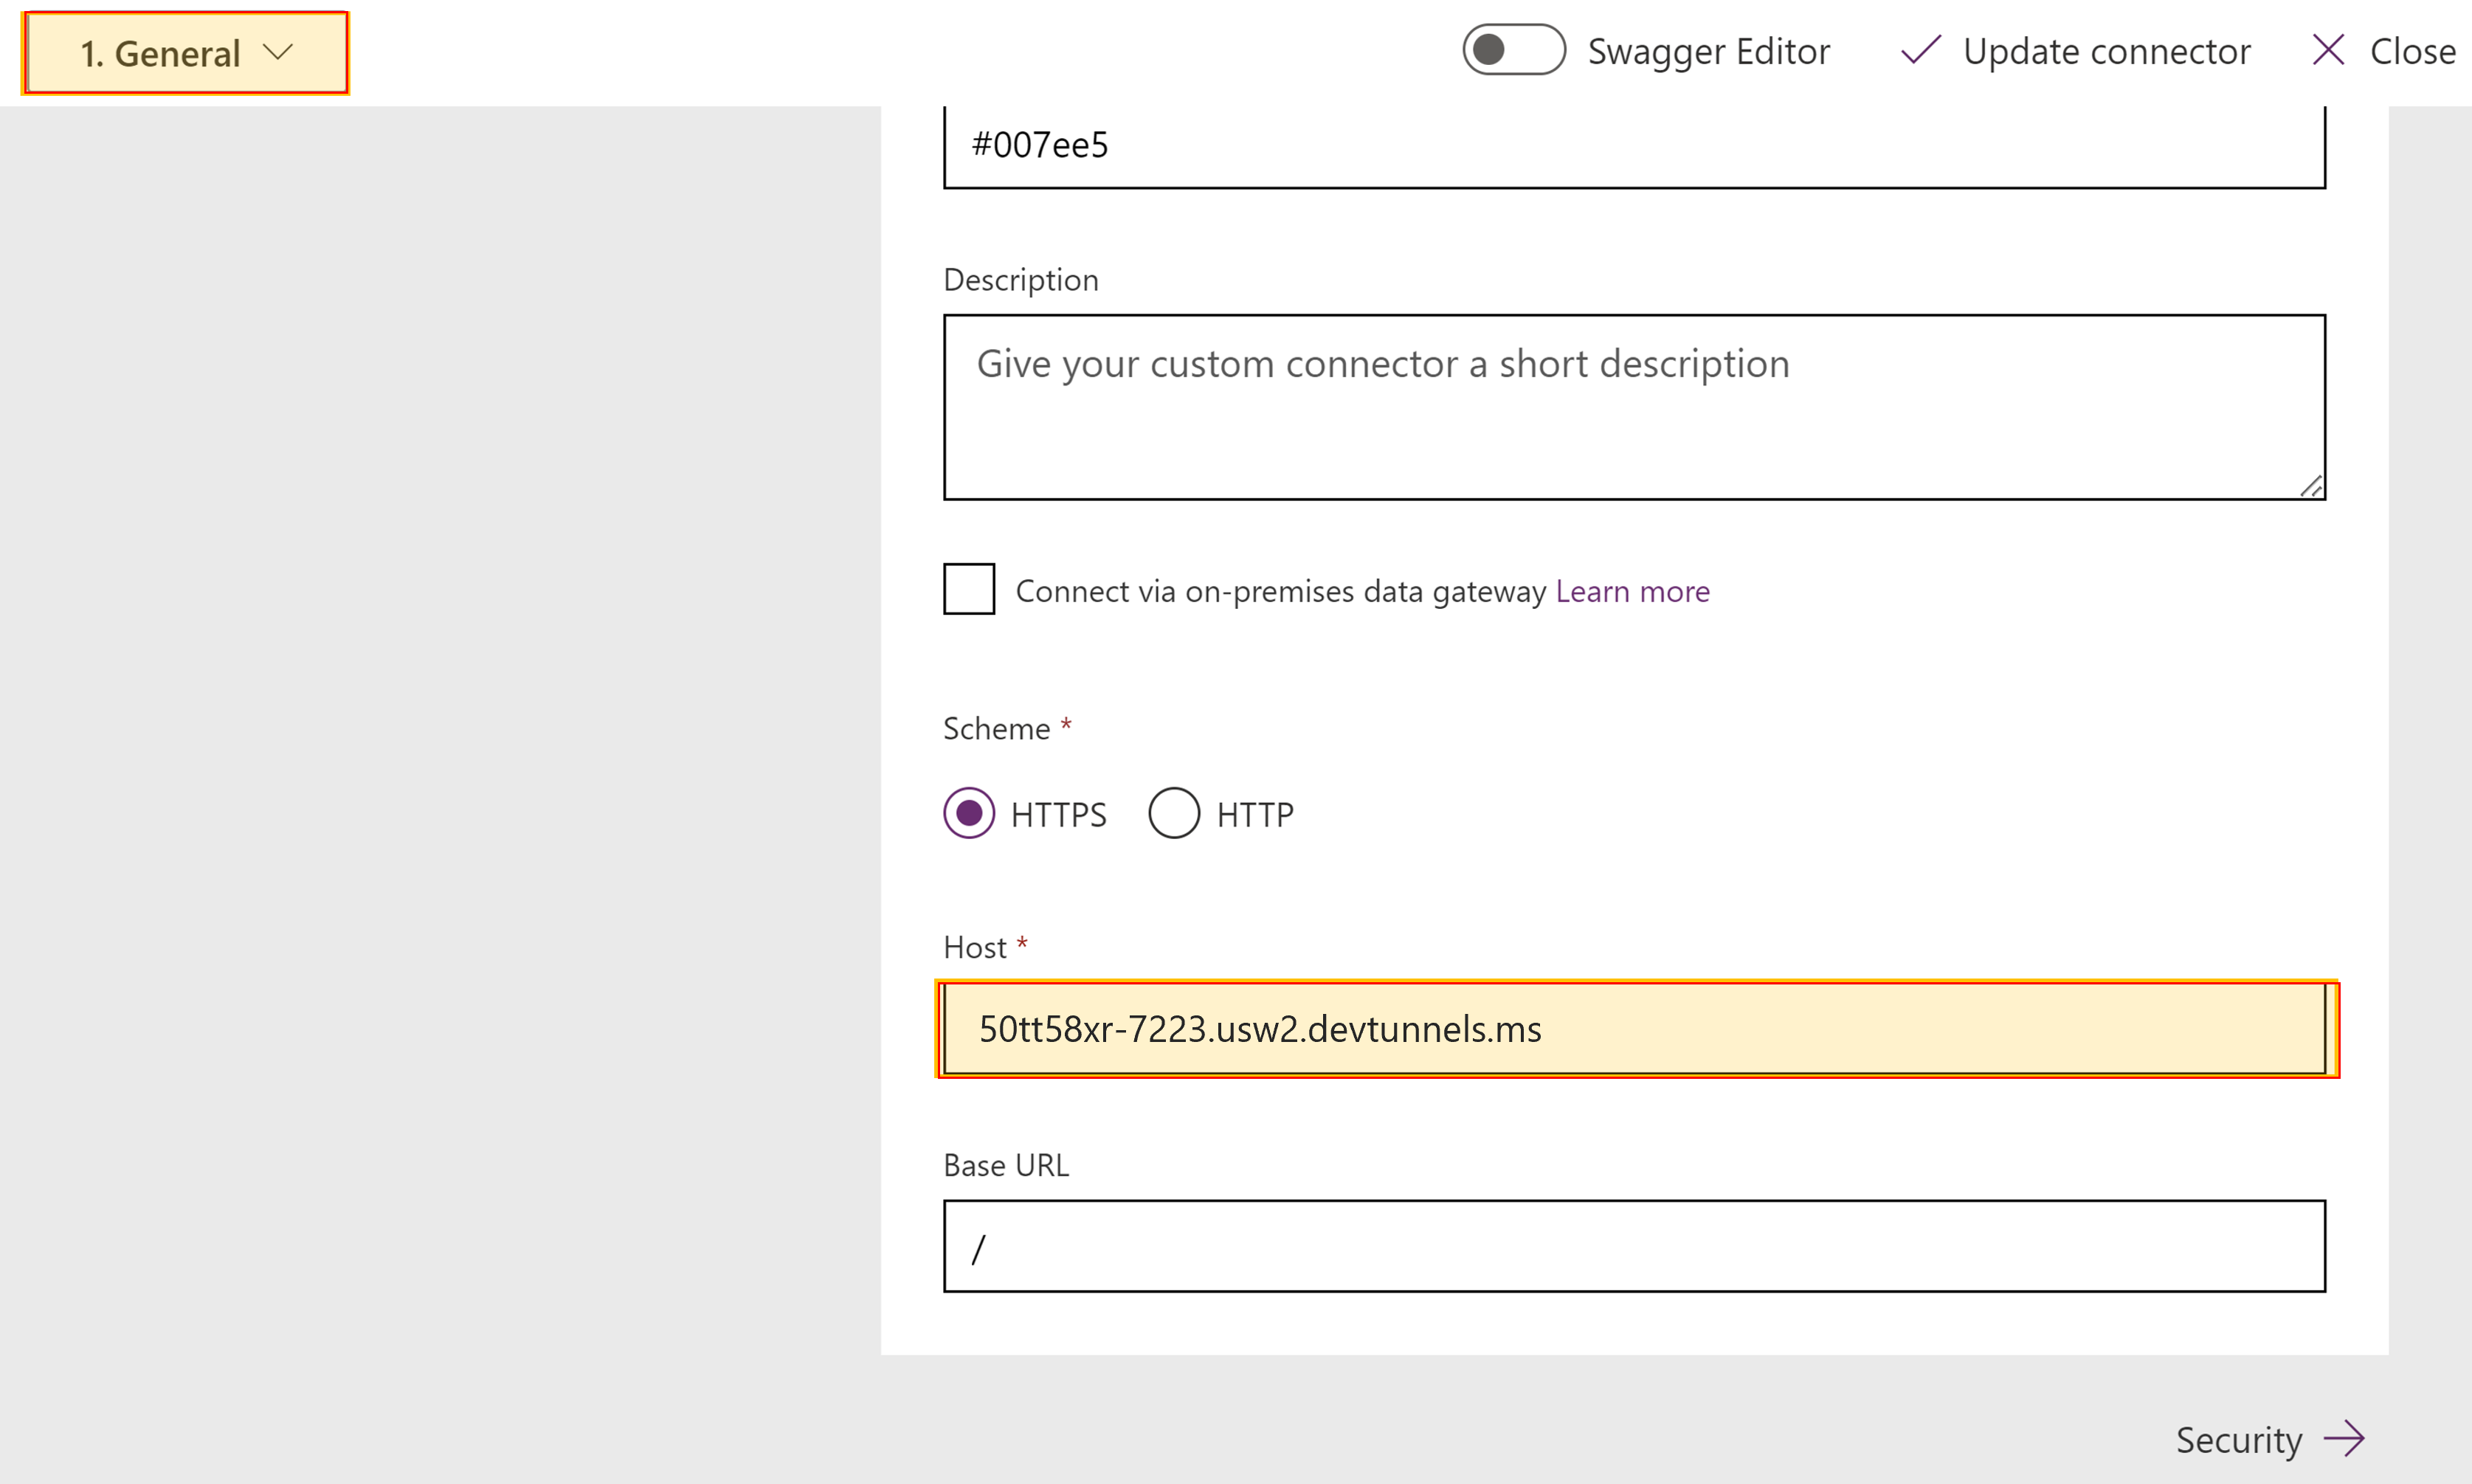
On the General tab, post the dev tunnel URL into the Host field.
On the Security tab, select No authentication from the dropdown menu.

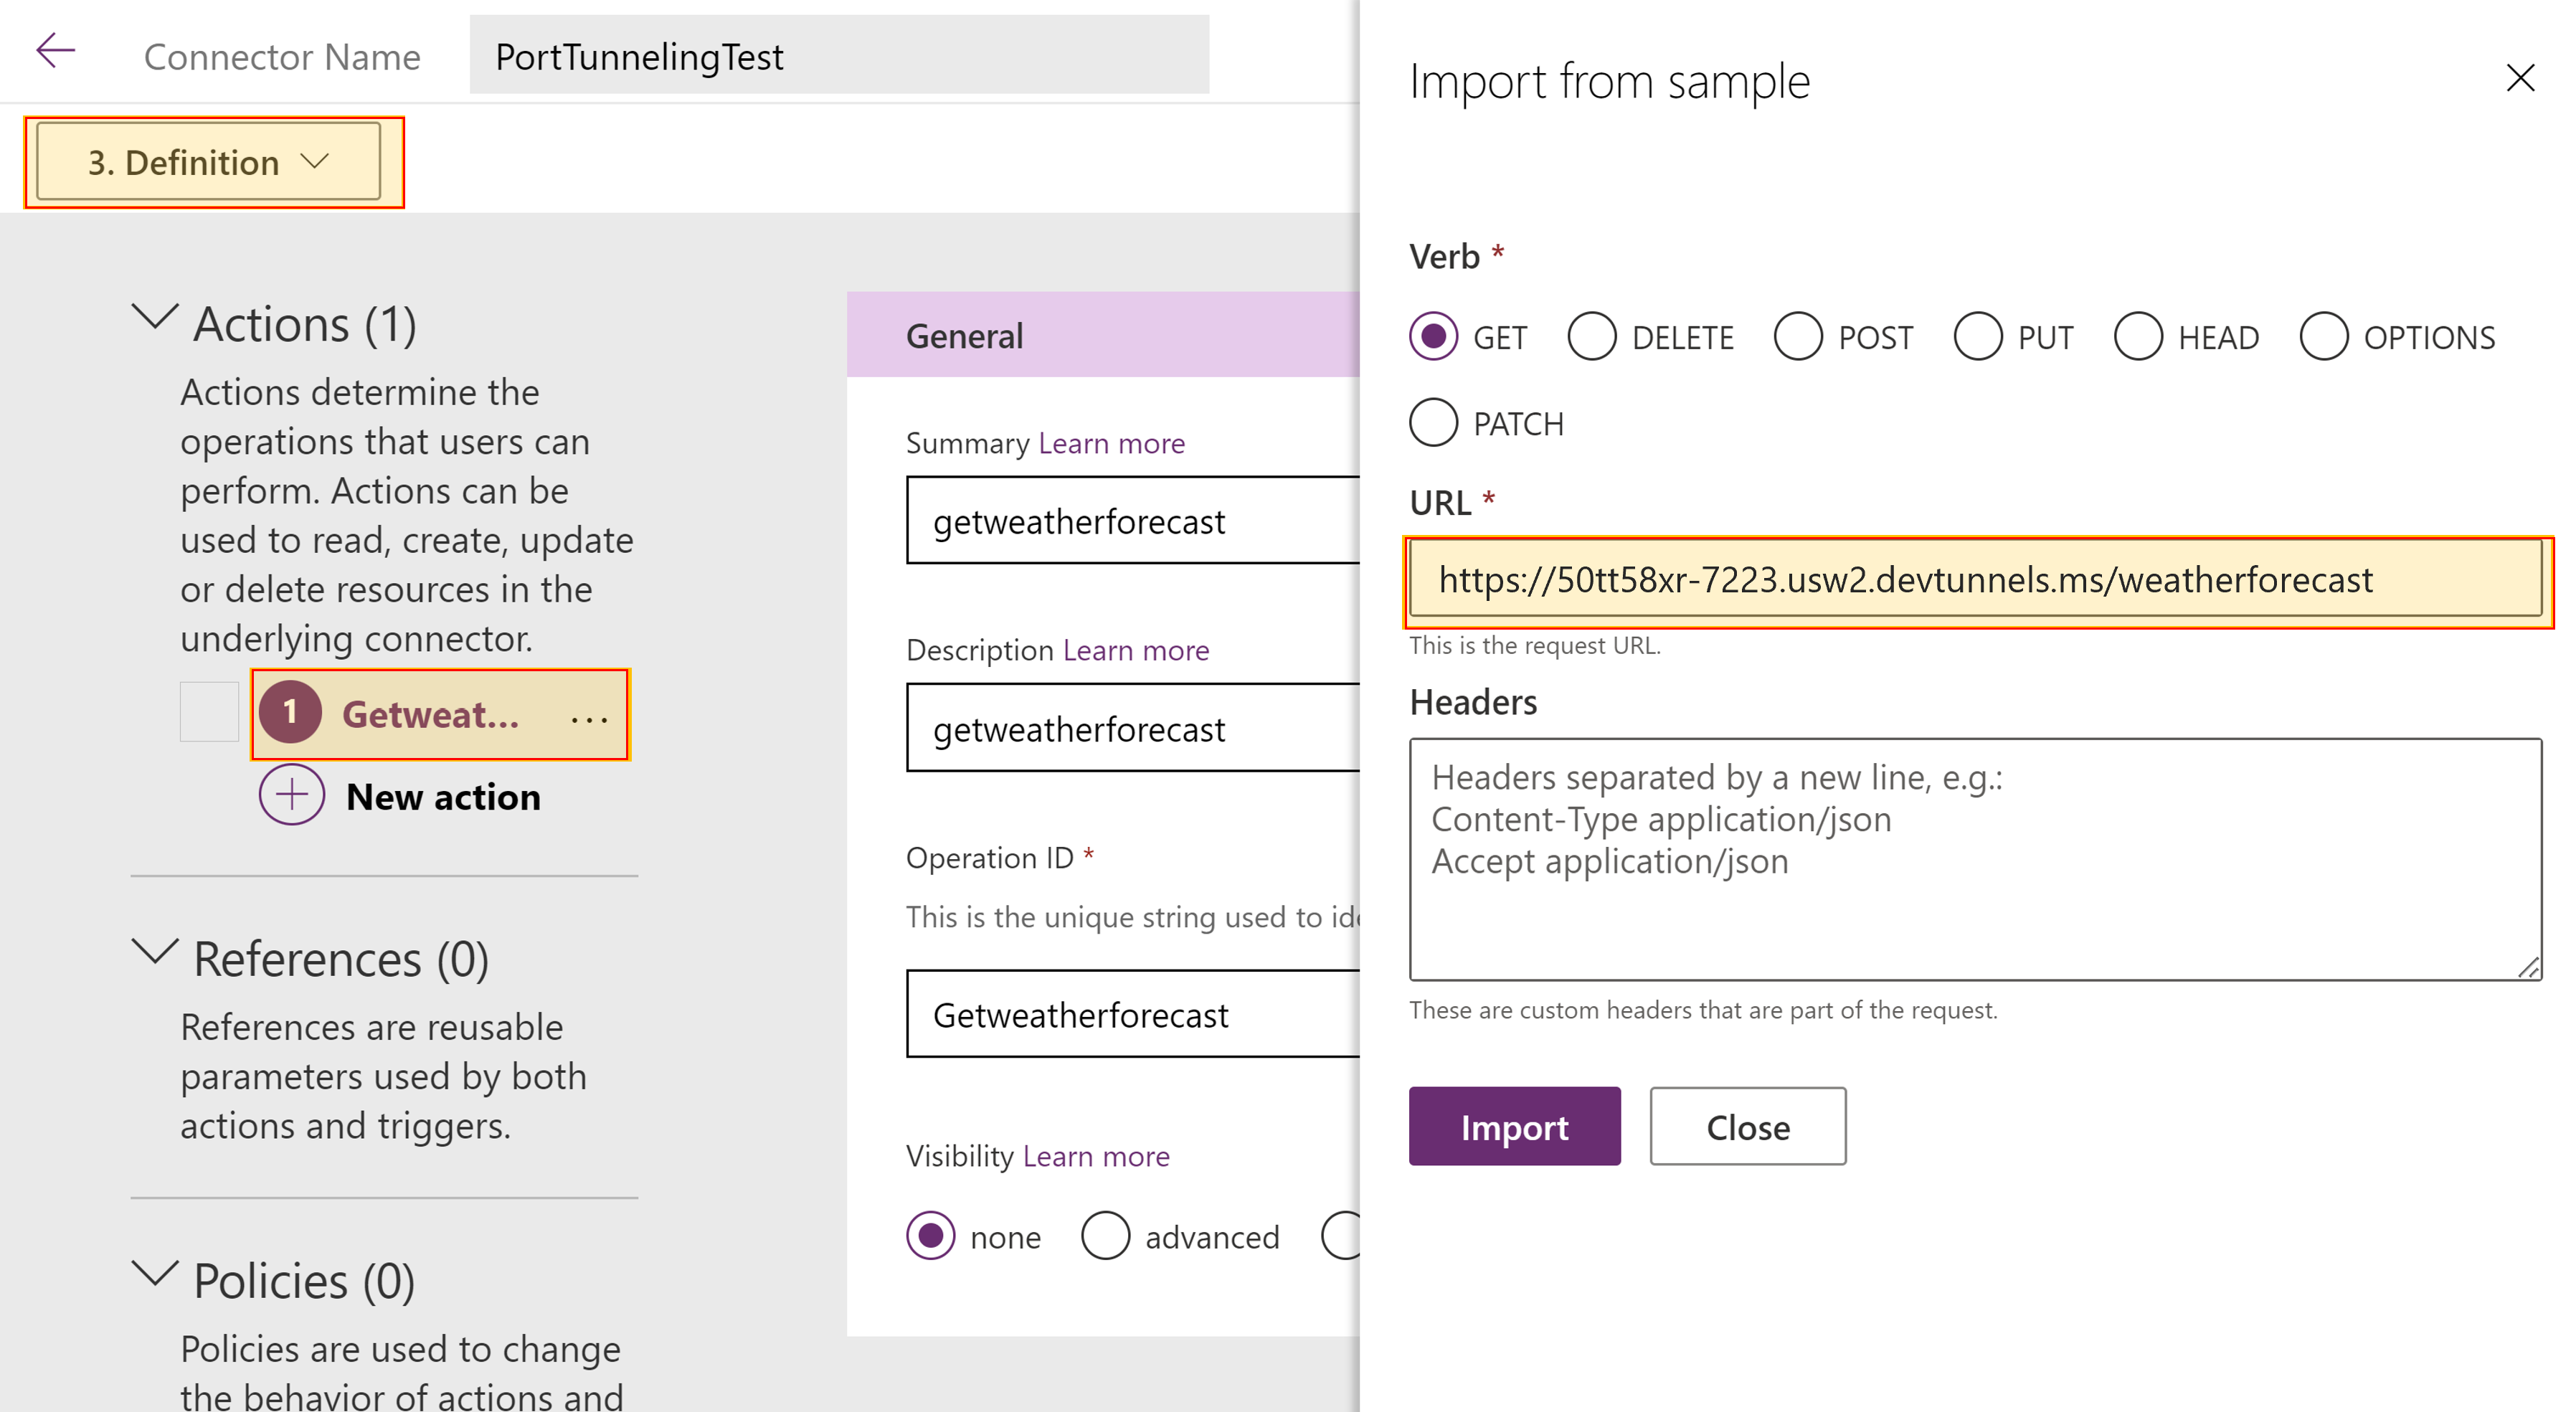
On the Definition tab, define your HTTP methods by adding actions. For the URL action, use the dev tunnel base URL + /actionName. For an example, go to How to use dev tunnels.
You can now test your custom connector. To do this, select the Test tab. After adding your connection, you can test your web API.
For instructions, go to Create a custom connector from scratch.
Create a custom connector with API Management
Go to your Azure API Management instance in the Azure portal.
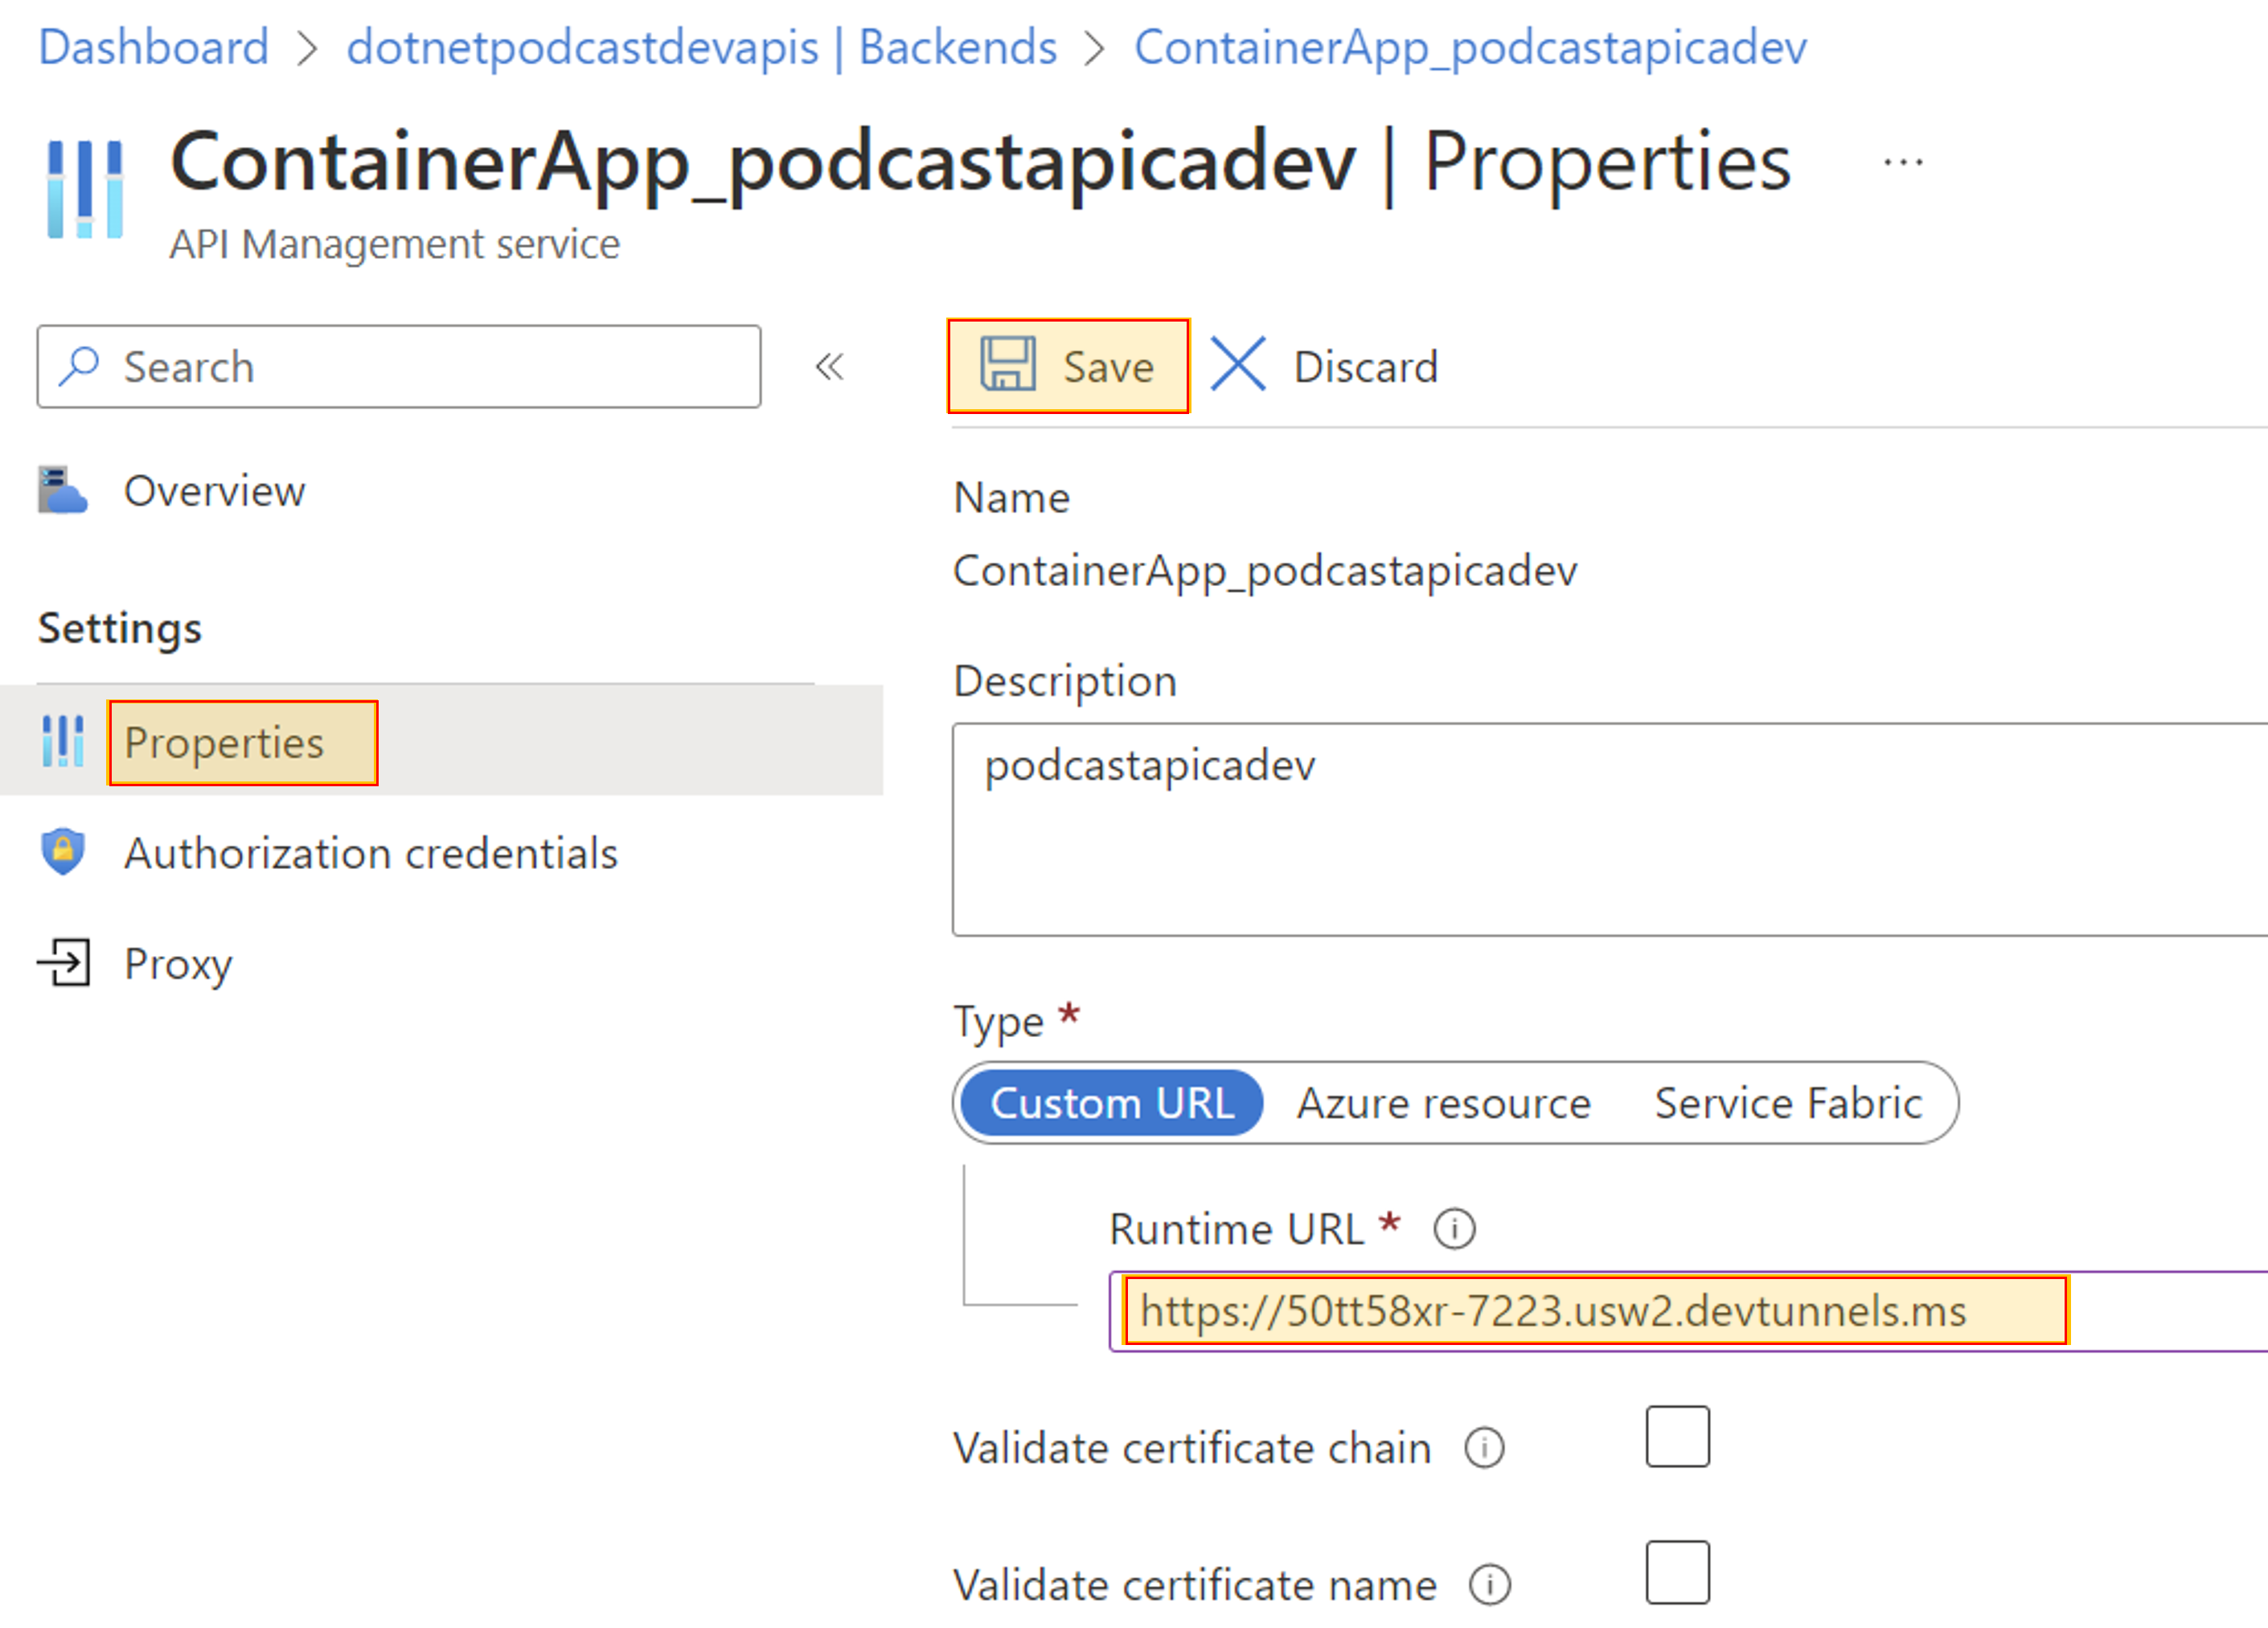
Modify the runtime URL of your API in the menu under Backends and select your API instance.
On the Properties tab, replace the Runtime URL with the dev tunnel URL and select Save.
On the Power Platform tab, you can now create a custom connector. For instructions, go to Export APIs from Azure API Management to the Power Platform.
Step 3: Add the custom connector to Power Apps or Power Automate
To debug your web API, use a custom connector from a Power Apps app or a Power Automate flow.
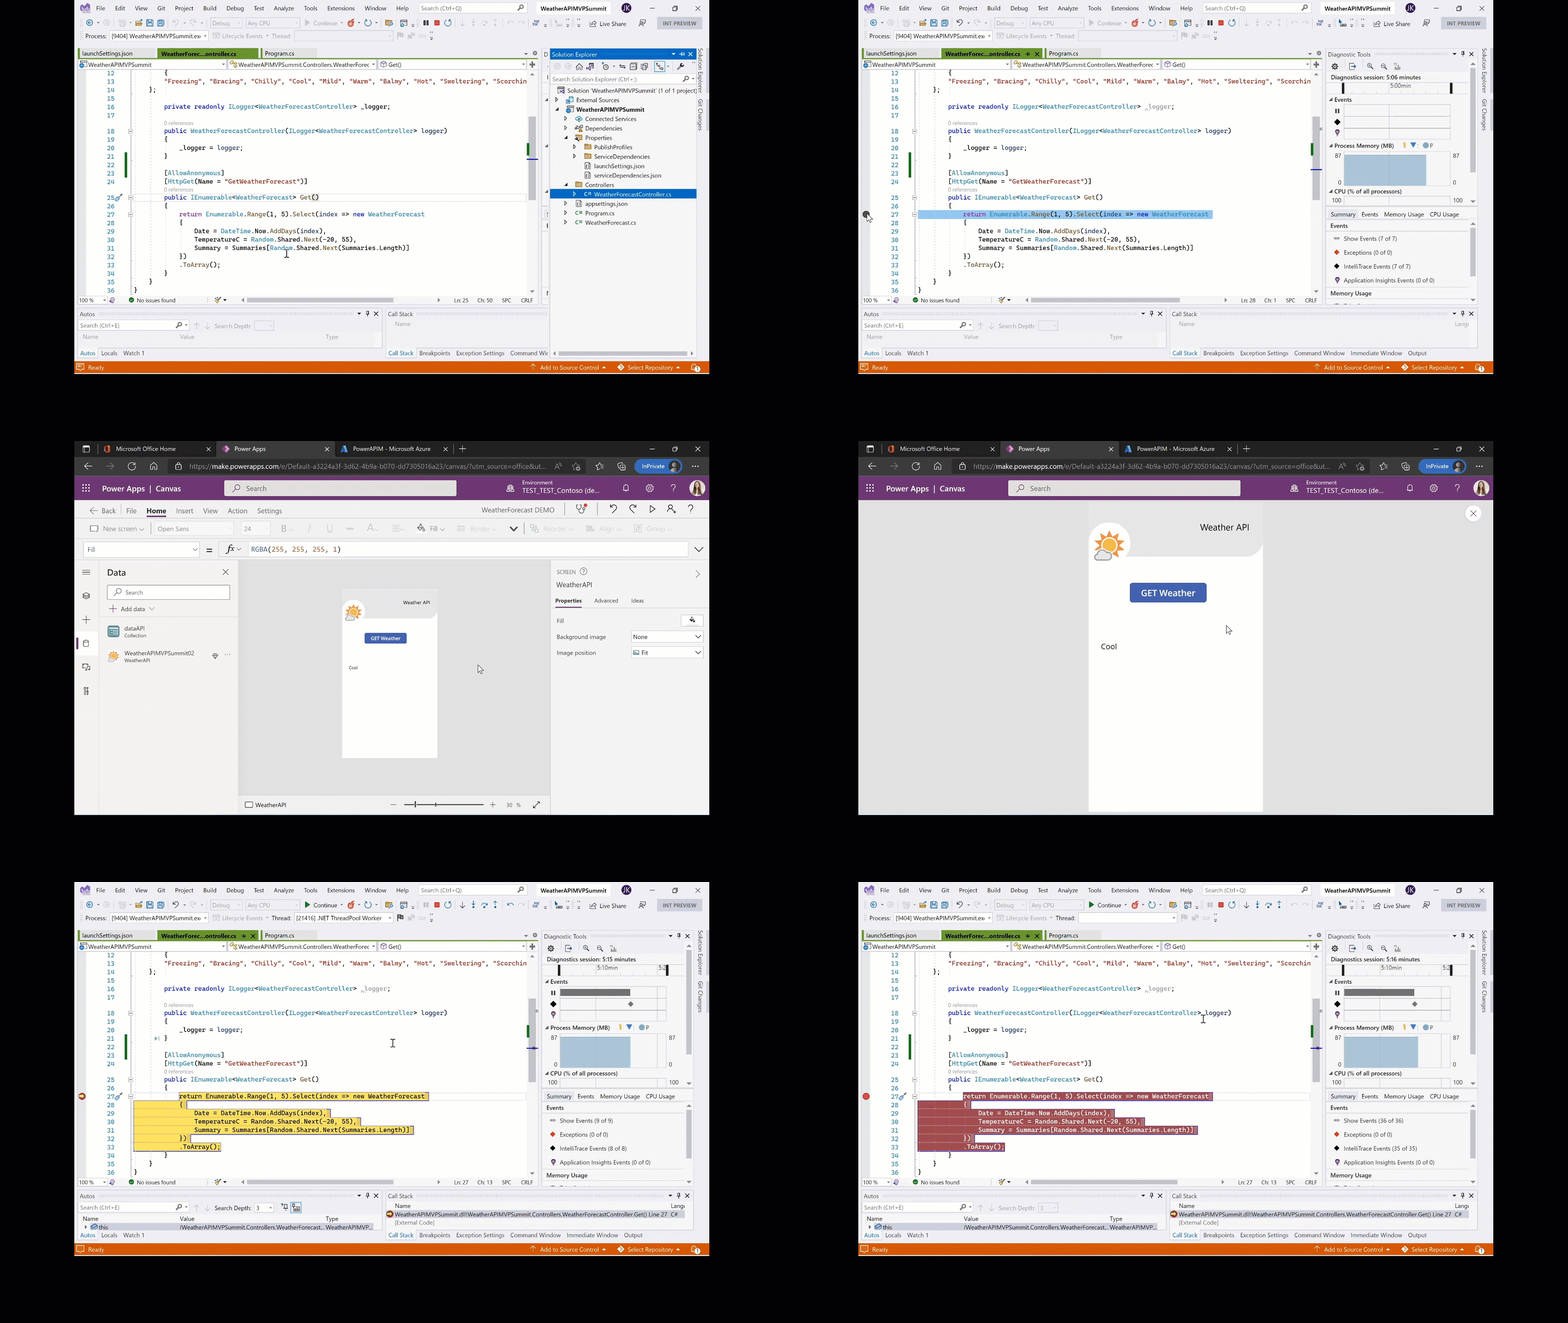
When your custom connector is integrated in your Power Platform solution, you can set a breakpoint, and debug your Power Apps app or Power Automate flow.
Note
Breakpoints are the most basic and essential feature of reliable debugging. A breakpoint indicates where Visual Studio should suspend your running code so you review the values of variables, behavior of memory, or if a branch of code is getting run.
Provide feedback
We greatly appreciate feedback on issues with our connector platform, or new feature ideas. To provide feedback, go to Submit issues or get help with connectors and select your feedback type.