Enable monitoring for Azure Container Storage with managed Prometheus (preview)
You can now monitor your stateful workloads running on Azure Container Storage service using managed Prometheus. Prometheus is a popular open-source monitoring and alerting solution that's widely used in Kubernetes environments to monitor and alert on infrastructure and workload performance.
Azure Monitor managed service for Prometheus is a component of Azure Monitor Metrics that provides a fully managed and scalable environment for running Prometheus. It enables collecting Prometheus metrics from your Azure Kubernetes Service (AKS) clusters to monitor your workloads.
Prometheus metrics are stored in an Azure Monitor workspace, where you can analyze and visualize the data using Azure Monitor Metrics Explorer with PromQL (preview) and Azure Managed Grafana.
Prerequisites and limitations
This preview feature only supports Azure Monitor managed service for Prometheus. If you have your own Prometheus instance deployed, then you must disable Azure Container Storage's Prometheus instance by running the following Azure CLI command. Replace <cluster_name> and <resource_group_name> with your own values.
az k8s-extension update --cluster-type managedClusters --cluster-name <cluster_name> --resource-group <resource_group_name> --name azurecontainerstorage --config base.metrics.enablePrometheusStack=false
Azure Managed Grafana default dashboard support isn't currently enabled for Azure Container Storage.
Collect Azure Container Storage Prometheus metrics
You can use Azure Monitor managed service for Prometheus to collect Azure Container Storage metrics along with other Prometheus metrics from your AKS cluster. To start collecting Azure Container Storage metrics, enable Managed Prometheus on the AKS cluster. If your AKS cluster already has Prometheus enabled, then installing Azure Container Storage on that cluster will automatically start collecting Azure Container Storage metrics.
Scrape frequency
The default scrape frequency for all default targets and scrapes is 30 seconds.
Metrics collected for default targets
The following Azure Container Storage targets are enabled by default, which means you don't have to provide any scrape job configuration for these targets:
acstor-capacity-provisioner(storage pool metrics)acstor-metrics-exporter(disk metrics)
You can customize data collection for the default targets using the Managed Prometheus ConfigMap. See Customize scraping of Prometheus metrics in Azure Monitor.
Storage pool metrics
Azure Container Storage provides the following storage pool metrics collected from the acstor-capacity-provisioner target (job=acstor-capacity-provisioner):
| Metric | Description |
|---|---|
storage_pool_ready_state |
This is a gauge metric to detect storage pool state (0 = not ready, 1 = ready). |
storage_pool_capacity_provisioned_bytes |
Storage pool capacity provisioned in bytes. |
storage_pool_capacity_used_bytes |
Storage pool capacity used in bytes from the provisioned storage pool capacity. |
storage_pool_snapshot_capacity_reserved_bytes |
Storage pool capacity reserved in bytes for storing local snapshots. |
Disk metrics
Azure Container Storage provides the following disk metrics collected from the acstor-metrics-exporter target (job=acstor-metrics-exporter):
| Metric | Description |
|---|---|
disk_pool_ready_state |
This is a gauge metric to detect disk pool state (0 = not ready, 1 = ready). |
disk_read_operations_completed_total |
The number of total disk read operations performed successfully over the disk. |
disk_write_operations_completed_total |
The number of total disk write operations performed successfully over the disk. |
disk_read_operations_time_seconds_total |
The total time spent performing read operations in seconds. |
disk_write_operations_time_seconds_total |
The total time spent performing write operations in seconds. |
disk_errors_total |
Count of disk errors. |
disk_read_bytes_total |
The total number of bytes read successfully. |
disk_written_bytes_total |
The total number of bytes written successfully. |
disk_readonly_errors_gauge |
This is a gauge metric to measure read-only volume mounts. |
Query Azure Container Storage metrics
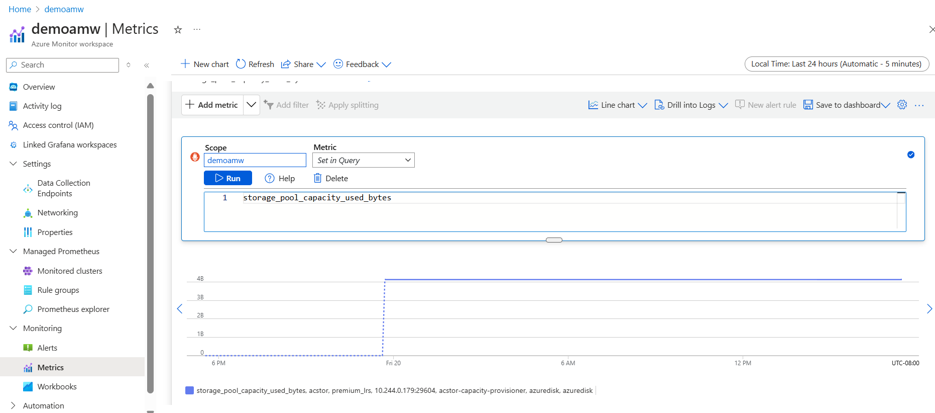
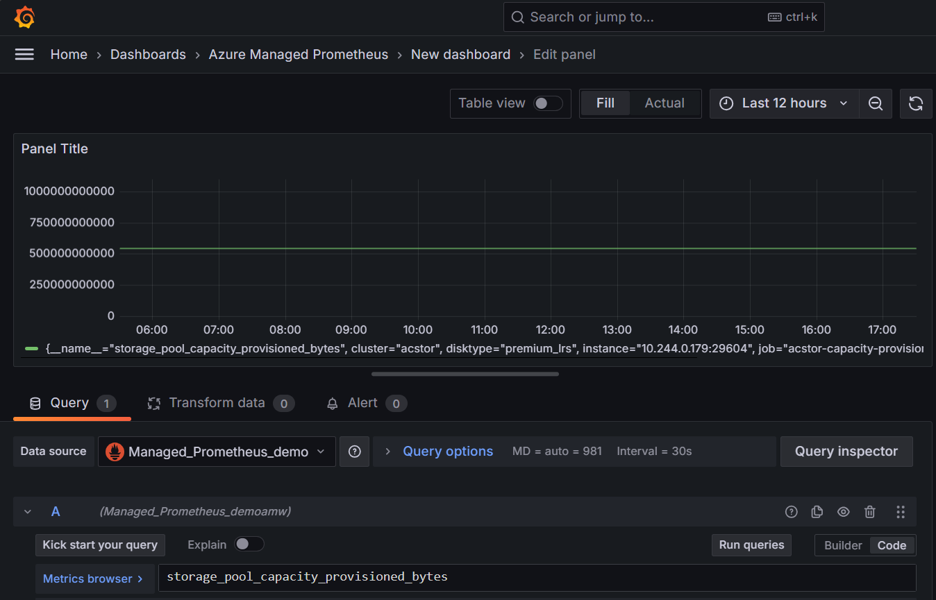
Azure Container Storage metrics are stored in the Azure Monitor workspace that's associated with managed Prometheus. You can query metrics directly from the workspace or through the Azure Managed Grafana instance that's connected to the workspace.
To view Azure Container Storage metrics, follow these steps:
Sign in to the Azure portal and navigate to your AKS cluster.
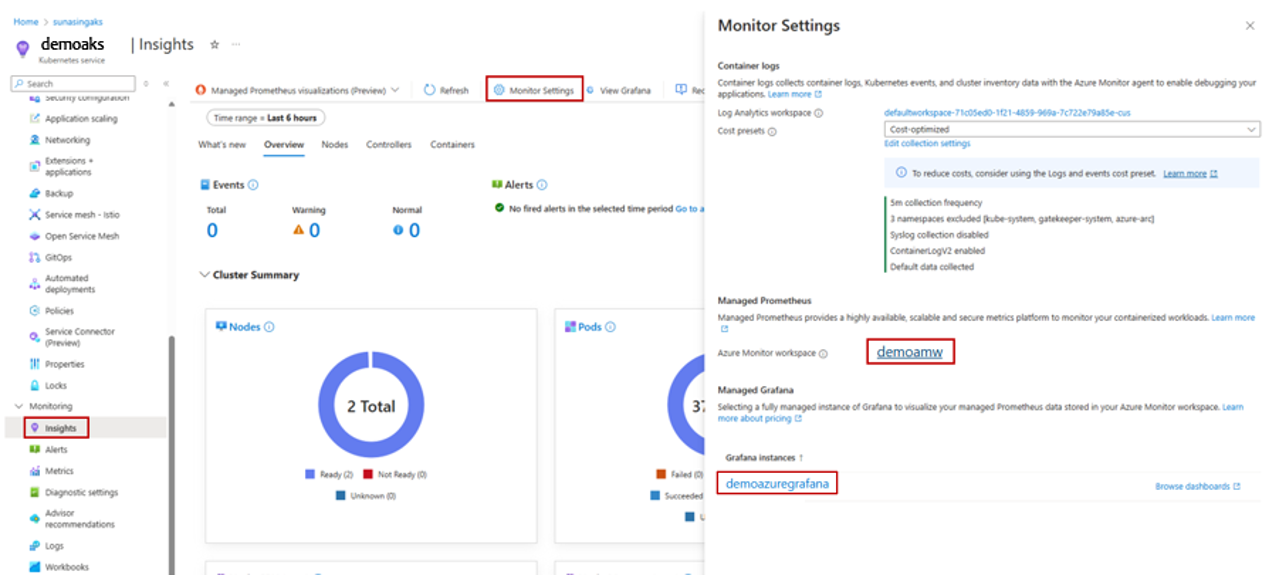
From the service menu, under Monitoring, select Insights, and then select Monitor Settings.
Under Managed Prometheus, select the appropriate Azure Monitor workspace instance. On the instance overview page, select the Metrics section, and query the desired metrics.
Alternatively, you can select the Managed Grafana instance, and on the instance overview page, click on the endpoint URL. This will navigate to the Grafana portal where you can query the metrics. The data source will be automatically configured for you to query metrics from the associated Azure Monitor workspace.
To learn more about querying Prometheus metrics from Azure Monitor workspace, see Use Azure Monitor managed service for Prometheus as data source for Grafana.


