Self-diagnose and solve problems in Azure Spring Apps
Note
The Basic, Standard, and Enterprise plans will be deprecated starting from mid-March, 2025, with a 3 year retirement period. We recommend transitioning to Azure Container Apps. For more information, see the Azure Spring Apps retirement announcement.
The Standard consumption and dedicated plan will be deprecated starting September 30, 2024, with a complete shutdown after six months. We recommend transitioning to Azure Container Apps. For more information, see Migrate Azure Spring Apps Standard consumption and dedicated plan to Azure Container Apps.
This article applies to: ✅ Java ✅ C#
This article applies to: ✅ Basic/Standard ✅ Enterprise
This article shows you how to use Azure Spring Apps diagnostics.
Azure Spring Apps diagnostics is an interactive experience to troubleshoot your app without configuration. Azure Spring Apps diagnostics identifies problems and guides you to information that helps troubleshoot and resolve issues.
Prerequisites
To complete this exercise, you need:
- An Azure subscription. If you don't have an Azure subscription, create a free account before you begin.
- A deployed Azure Spring Apps service instance. For more information, see Quickstart: Deploy your first application to Azure Spring Apps.
- At least one application already created in your service instance.
Navigate to the diagnostics page
Sign in to the Azure portal.
Go to your Azure Spring Apps Overview page.
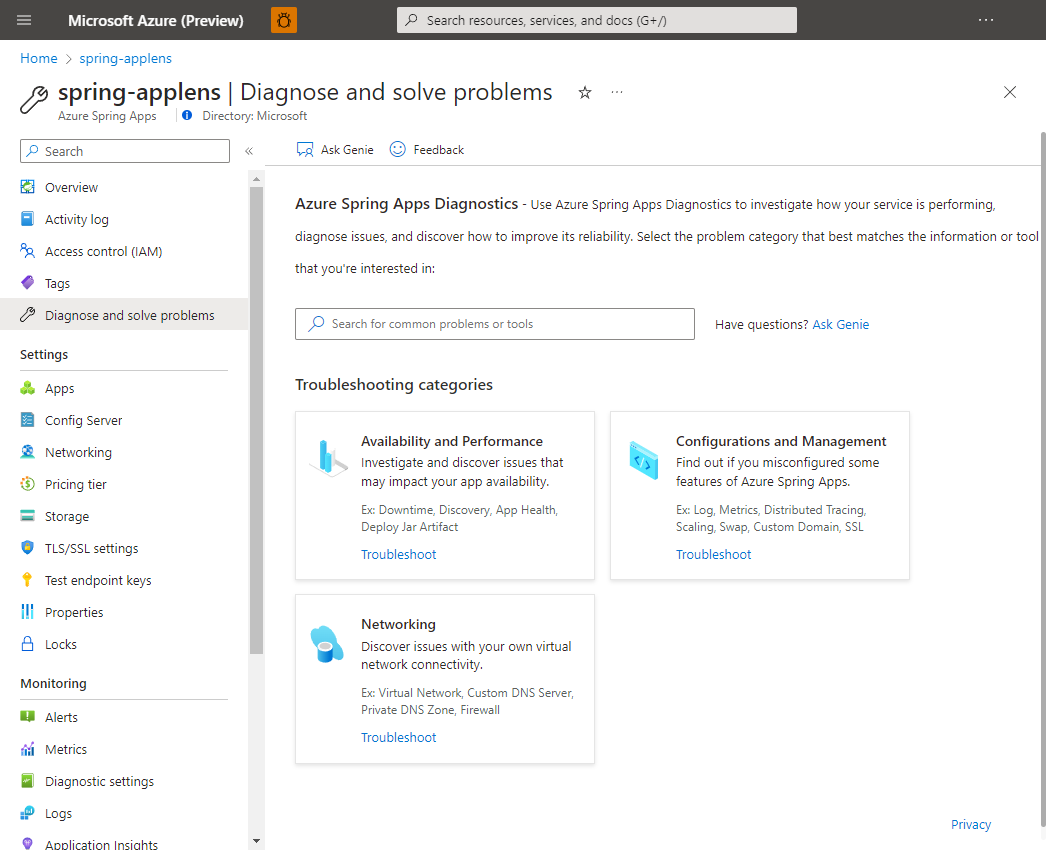
Select Diagnose and solve problems in the navigation pane.
Search logged issues
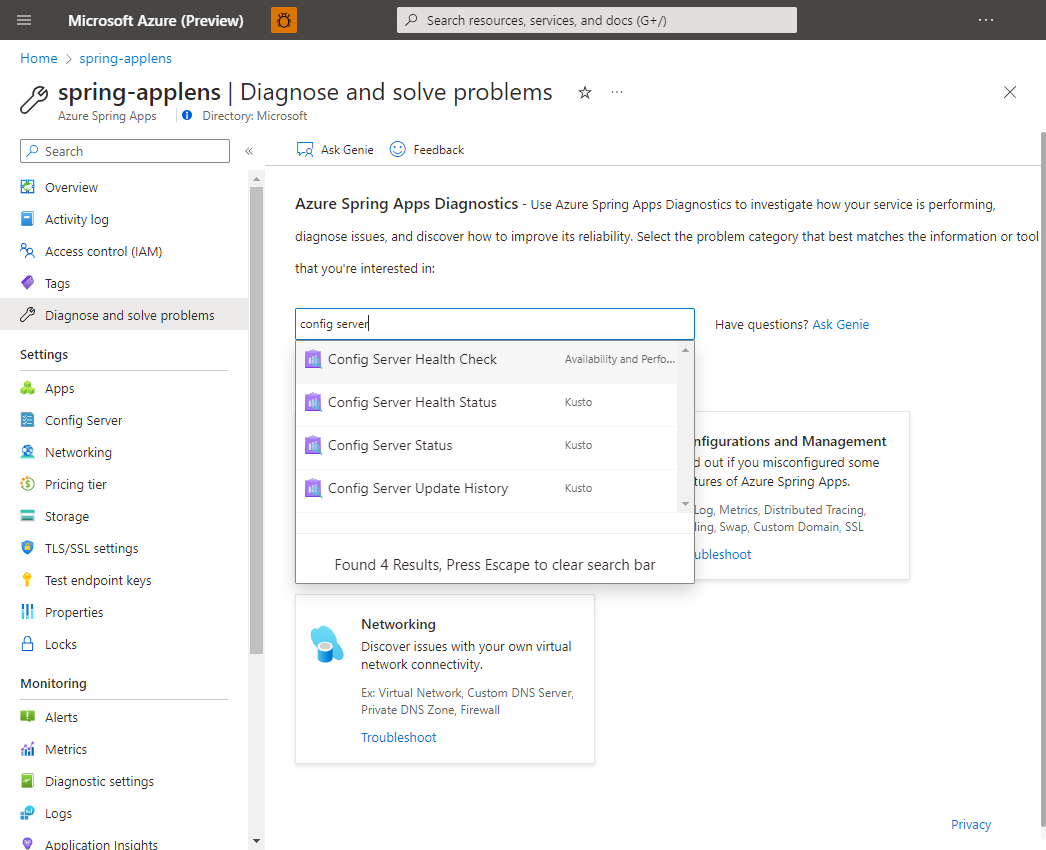
To find an issue, you can either search by typing a keyword or select the solution group to explore all in that category.
Selection of Config Server Health Check, Config Server Health Status, or Config Server Update History displays various results.
Note
Spring Cloud Config Server is not applicable to the Azure Spring Apps Enterprise plan.
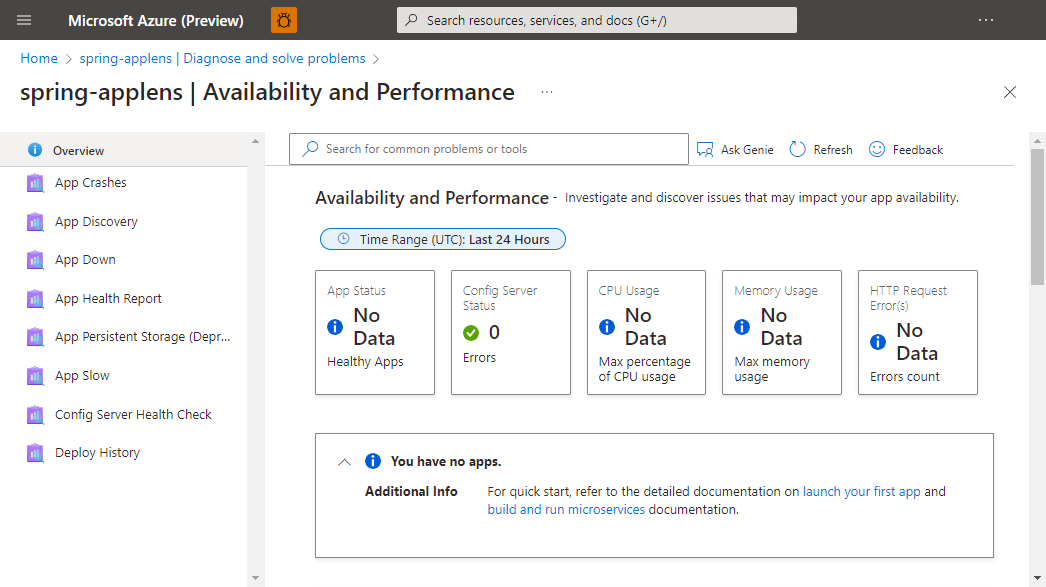
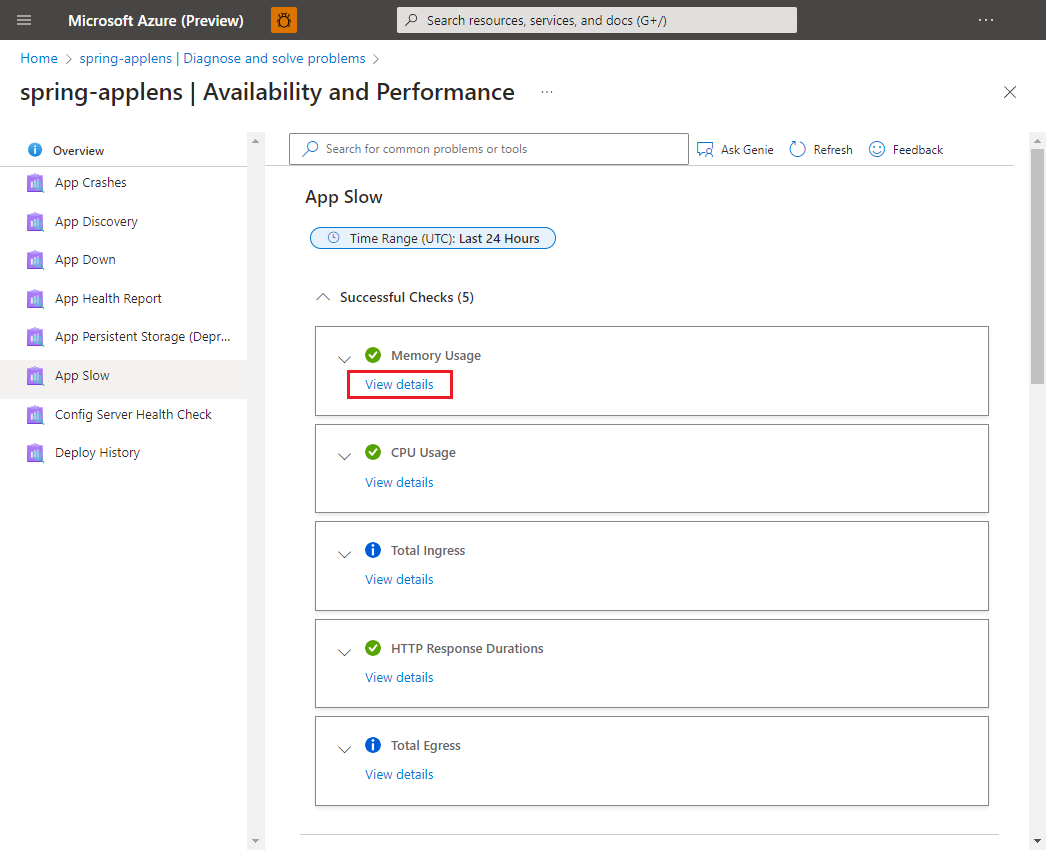
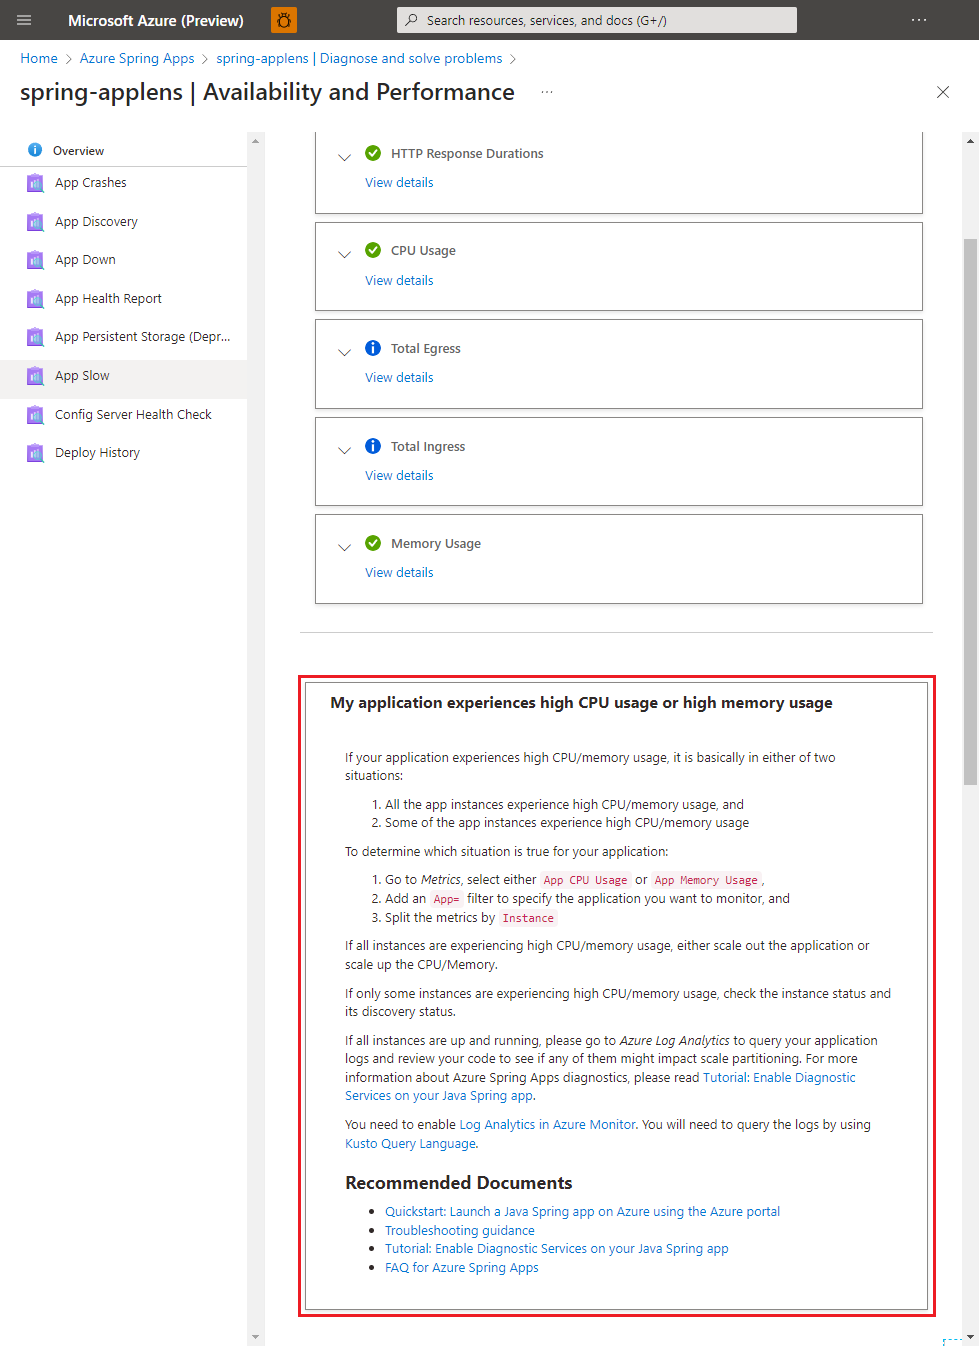
Find your target detector and select it to execute. A summary of diagnostics is shown after you execute the detector. Select View details to check diagnostic details.
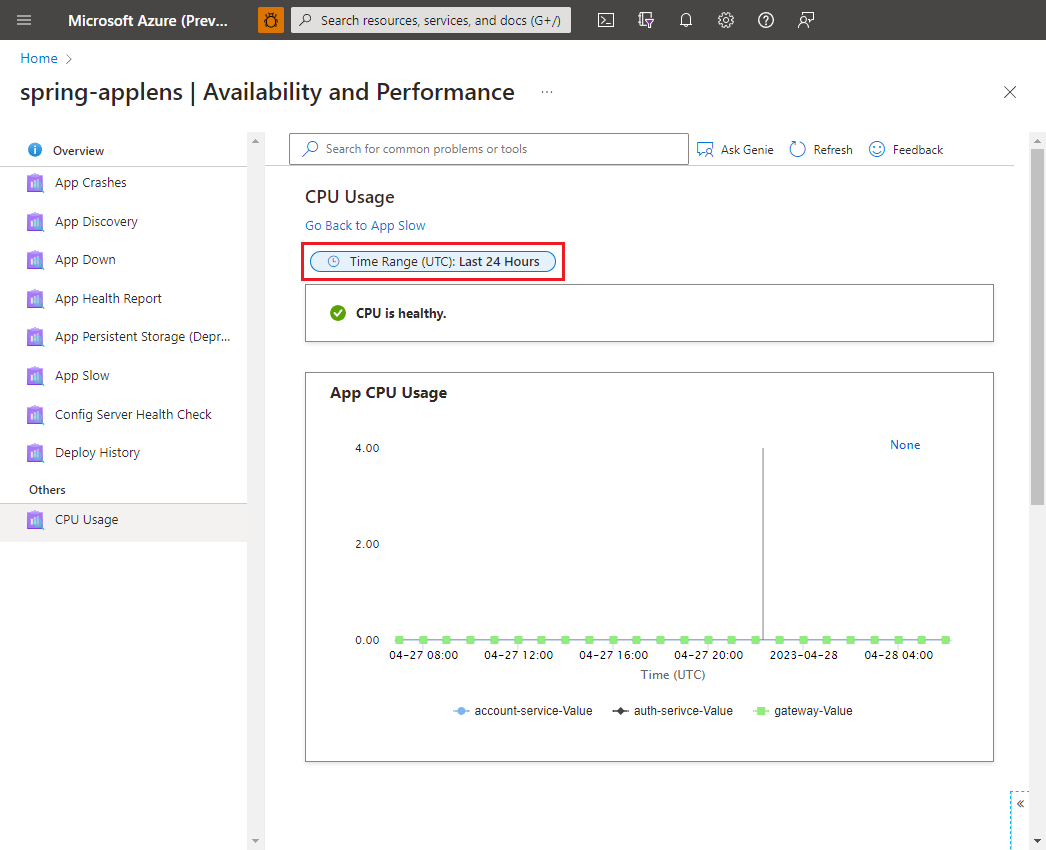
You can change the diagnostic time range with the controller for CPU Usage. There can be a 15-minute delay for metrics and logs.
Some results contain related documentation.
