Custom Logs via AMA data connector - Configure data ingestion to Microsoft Sentinel from specific applications
Microsoft Sentinel's Custom Logs via AMA data connector supports the collection of logs from text files from several different network and security applications and devices.
This article supplies the configuration information, unique to each specific security application, that you need to supply when configuring this data connector. This information is provided by the application providers. Contact the provider for updates, for more information, or when information is unavailable for your security application. For the full instructions to install and configure the connector, see Collect logs from text files with the Azure Monitor Agent and ingest to Microsoft Sentinel, but refer back to this article for the unique information to supply for each application.
This article also shows you how to ingest data from these applications to your Microsoft Sentinel workspace without using the connector. These steps include installation of the Azure Monitor Agent. After the connector is installed, use the instructions appropriate to your application, shown later in this article, to complete the setup.
The devices from which you collect custom text logs fall into two categories:
Applications installed on Windows or Linux machines
The application stores its log files on the machine where it's installed. To collect these logs, the Azure Monitor Agent is installed on this same machine.
Appliances that are self-contained on closed (usually Linux-based) devices
These appliances store their logs on an external syslog server. To collect these logs, the Azure Monitor Agentis installed on this external syslog server, often called a log forwarder.
For more information about the related Microsoft Sentinel solution for each of these applications, search the Azure Marketplace for the Product Type > Solution Templates or review the solution from the Content hub in Microsoft Sentinel.
Important
The Custom Logs via AMA data connector is currently in PREVIEW. See the Supplemental Terms of Use for Microsoft Azure Previews for additional legal terms that apply to Azure features that are in beta, preview, or otherwise not yet released into general availability.
-
Microsoft Sentinel is generally available within Microsoft's unified security operations platform in the Microsoft Defender portal. For preview, Microsoft Sentinel is available in the Defender portal without Microsoft Defender XDR or an E5 license. For more information, see Microsoft Sentinel in the Microsoft Defender portal.
General instructions
The steps for collecting logs from machines hosting applications and appliances follow a general pattern:
Create the destination table in Log Analytics (or Advanced Hunting if you're in the Defender portal).
Create the data collection rule (DCR) for your application or appliance.
Deploy the Azure Monitor Agent to the machine hosting the application, or to the external server (log forwarder) that collects logs from appliances if it's not already deployed.
Configure logging on your application. If an appliance, configure it to send its logs to the external server (log forwarder) where the Azure Monitor Agent is installed.
These general steps (except for the last one) are automated when you use the Custom Logs via AMA data connector, and are described in detail in Collect logs from text files with the Azure Monitor Agent and ingest to Microsoft Sentinel.
Specific instructions per application type
The per-application information you need to complete these steps is presented in the rest of this article. Some of these applications are on self-contained appliances and require a different type of configuration, starting with the use of a log forwarder.
Each application section contains the following information:
- Unique parameters to supply to the configuration of the Custom Logs via AMA data connector, if you're using it.
- The outline of the procedure required to ingest data manually, without using the connector. For the details of this procedure, see Collect logs from text files with the Azure Monitor Agent and ingest to Microsoft Sentinel.
- Specific instructions for configuring the originating applications or devices themselves, and/or links to the instructions on the providers' web sites. These steps must be taken whether using the connector or not.
Apache HTTP Server
Follow these steps to ingest log messages from Apache HTTP Server:
Table name:
ApacheHTTPServer_CLLog storage location: Logs are stored as text files on the application's host machine. Install the AMA on the same machine to collect the files.
Default file locations ("filePatterns"):
- Windows:
"C:\Server\bin\log\Apache24\logs\*.log" - Linux:
"/var/log/httpd/*.log"
- Windows:
Create the DCR according to the directions in Collect logs from text files with the Azure Monitor Agent and ingest to Microsoft Sentinel.
Replace the {TABLE_NAME} and {LOCAL_PATH_FILE} placeholders in the DCR template with the values in steps 1 and 2. Replace the other placeholders as directed.
Apache Tomcat
Follow these steps to ingest log messages from Apache Tomcat:
Table name:
Tomcat_CLLog storage location: Logs are stored as text files on the application's host machine. Install the AMA on the same machine to collect the files.
Default file locations ("filePatterns"):
- Linux:
"/var/log/tomcat/*.log"
- Linux:
Create the DCR according to the directions in Collect logs from text files with the Azure Monitor Agent and ingest to Microsoft Sentinel.
Replace the {TABLE_NAME} and {LOCAL_PATH_FILE} placeholders in the DCR template with the values in steps 1 and 2. Replace the other placeholders as directed.
Cisco Meraki
Follow these steps to ingest log messages from Cisco Meraki:
Table name:
meraki_CLLog storage location: Create a log file on your external syslog server. Grant the syslog daemon write permissions to the file. Install the AMA on the external syslog server if it's not already installed. Enter this filename and path in the File pattern field in the connector, or in place of the
{LOCAL_PATH_FILE}placeholder in the DCR.Configure the syslog daemon to export its Meraki log messages to a temporary text file so the AMA can collect them.
Create a custom configuration file for the rsyslog daemon and save it to
/etc/rsyslog.d/10-meraki.conf. Add the following filtering conditions to this configuration file:if $rawmsg contains "flows" then { action(type="omfile" file="<LOG_FILE_Name>") stop } if $rawmsg contains "urls" then { action(type="omfile" file="<LOG_FILE_Name>") stop } if $rawmsg contains "ids-alerts" then { action(type="omfile" file="<LOG_FILE_Name>") stop } if $rawmsg contains "events" then { action(type="omfile" file="<LOG_FILE_Name>") stop } if $rawmsg contains "ip_flow_start" then { action(type="omfile" file="<LOG_FILE_Name>") stop } if $rawmsg contains "ip_flow_end" then { action(type="omfile" file="<LOG_FILE_Name>") stop }(Replace
<LOG_FILE_Name>with the name of the log file you created.)To learn more about filtering conditions for rsyslog, see rsyslog: Filter conditions. We recommend testing and modifying the configuration based on your specific installation.
Restart rsyslog. The typical command syntax is
systemctl restart rsyslog.
Create the DCR according to the directions in Collect logs from text files with the Azure Monitor Agent and ingest to Microsoft Sentinel.
Replace the column name
"RawData"with the column name"Message".Replace the transformKql value
"source"with the value"source | project-rename Message=RawData".Replace the
{TABLE_NAME}and{LOCAL_PATH_FILE}placeholders in the DCR template with the values in steps 1 and 2. Replace the other placeholders as directed.
Configure the machine where the Azure Monitor Agent is installed to open the syslog ports, and configure the syslog daemon there to accept messages from external sources. For detailed instructions and a script to automate this configuration, see Configure the log forwarder to accept logs.
Configure and connect the Cisco Meraki device(s): follow the instructions provided by Cisco for sending syslog messages. Use the IP address or hostname of the virtual machine where the Azure Monitor Agent is installed.
JBoss Enterprise Application Platform
Follow these steps to ingest log messages from JBoss Enterprise Application Platform:
Table name:
JBossLogs_CLLog storage location: Logs are stored as text files on the application's host machine. Install the AMA on the same machine to collect the files.
Default file locations ("filePatterns") - Linux only:
- Standalone server:
"{EAP_HOME}/standalone/log/server.log" - Managed domain:
"{EAP_HOME}/domain/servers/{SERVER_NAME}/log/server.log"
- Standalone server:
Create the DCR according to the directions in Collect logs from text files with the Azure Monitor Agent and ingest to Microsoft Sentinel.
Replace the {TABLE_NAME} and {LOCAL_PATH_FILE} placeholders in the DCR template with the values in steps 1 and 2. Replace the other placeholders as directed.
JuniperIDP
Follow these steps to ingest log messages from JuniperIDP:
Table name:
JuniperIDP_CLLog storage location: Create a log file on your external syslog server. Grant the syslog daemon write permissions to the file. Install the AMA on the external syslog server if it's not already installed. Enter this filename and path in the File pattern field in the connector, or in place of the
{LOCAL_PATH_FILE}placeholder in the DCR.Configure the syslog daemon to export its JuniperIDP log messages to a temporary text file so the AMA can collect them.
Create custom configuration file for the rsyslog daemon, in the
/etc/rsyslog.d/folder, with the following filtering conditions:# Define a new ruleset ruleset(name="<RULESET_NAME>") { action(type="omfile" file="<LOG_FILE_NAME>") } # Set the input on port and bind it to the new ruleset input(type="imudp" port="<PORT>" ruleset="<RULESET_NAME>")(Replace
<parameters>with the actual names of the objects represented. <LOG_FILE_NAME> is the file you created in step 2.)Restart rsyslog. The typical command syntax is
systemctl restart rsyslog.
Create the DCR according to the directions in Collect logs from text files with the Azure Monitor Agent and ingest to Microsoft Sentinel.
Replace the column name
"RawData"with the column name"Message".Replace the
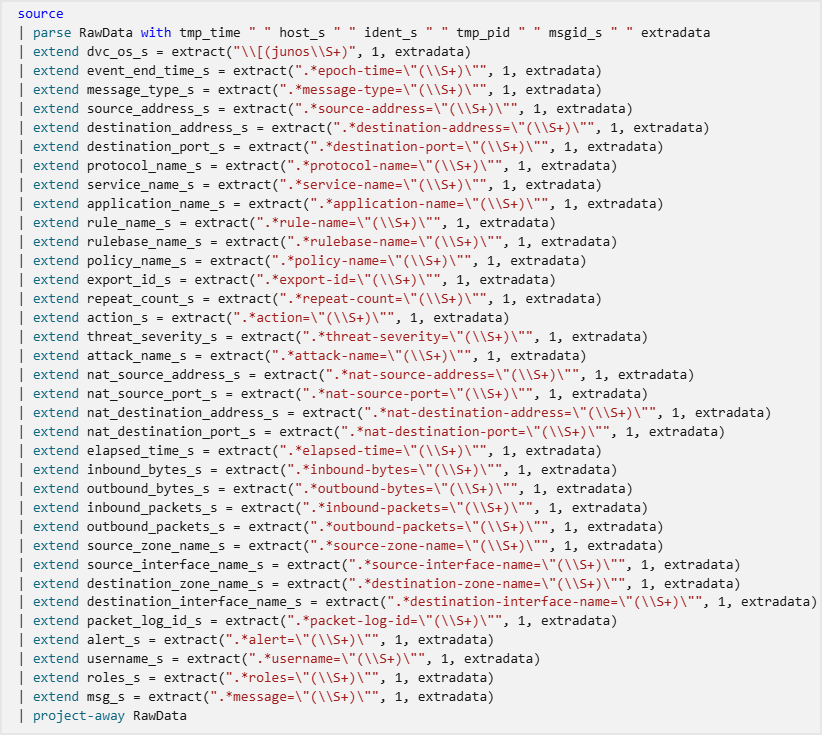
{TABLE_NAME}and{LOCAL_PATH_FILE}placeholders in the DCR template with the values in steps 1 and 2. Replace the other placeholders as directed.Replace the transformKql value
"source"with the following Kusto query (enclosed in double quotes):source | parse RawData with tmp_time " " host_s " " ident_s " " tmp_pid " " msgid_s " " extradata | extend dvc_os_s = extract("\\[(junos\\S+)", 1, extradata) | extend event_end_time_s = extract(".*epoch-time=\"(\\S+)\"", 1, extradata) | extend message_type_s = extract(".*message-type=\"(\\S+)\"", 1, extradata) | extend source_address_s = extract(".*source-address=\"(\\S+)\"", 1, extradata) | extend destination_address_s = extract(".*destination-address=\"(\\S+)\"", 1, extradata) | extend destination_port_s = extract(".*destination-port=\"(\\S+)\"", 1, extradata) | extend protocol_name_s = extract(".*protocol-name=\"(\\S+)\"", 1, extradata) | extend service_name_s = extract(".*service-name=\"(\\S+)\"", 1, extradata) | extend application_name_s = extract(".*application-name=\"(\\S+)\"", 1, extradata) | extend rule_name_s = extract(".*rule-name=\"(\\S+)\"", 1, extradata) | extend rulebase_name_s = extract(".*rulebase-name=\"(\\S+)\"", 1, extradata) | extend policy_name_s = extract(".*policy-name=\"(\\S+)\"", 1, extradata) | extend export_id_s = extract(".*export-id=\"(\\S+)\"", 1, extradata) | extend repeat_count_s = extract(".*repeat-count=\"(\\S+)\"", 1, extradata) | extend action_s = extract(".*action=\"(\\S+)\"", 1, extradata) | extend threat_severity_s = extract(".*threat-severity=\"(\\S+)\"", 1, extradata) | extend attack_name_s = extract(".*attack-name=\"(\\S+)\"", 1, extradata) | extend nat_source_address_s = extract(".*nat-source-address=\"(\\S+)\"", 1, extradata) | extend nat_source_port_s = extract(".*nat-source-port=\"(\\S+)\"", 1, extradata) | extend nat_destination_address_s = extract(".*nat-destination-address=\"(\\S+)\"", 1, extradata) | extend nat_destination_port_s = extract(".*nat-destination-port=\"(\\S+)\"", 1, extradata) | extend elapsed_time_s = extract(".*elapsed-time=\"(\\S+)\"", 1, extradata) | extend inbound_bytes_s = extract(".*inbound-bytes=\"(\\S+)\"", 1, extradata) | extend outbound_bytes_s = extract(".*outbound-bytes=\"(\\S+)\"", 1, extradata) | extend inbound_packets_s = extract(".*inbound-packets=\"(\\S+)\"", 1, extradata) | extend outbound_packets_s = extract(".*outbound-packets=\"(\\S+)\"", 1, extradata) | extend source_zone_name_s = extract(".*source-zone-name=\"(\\S+)\"", 1, extradata) | extend source_interface_name_s = extract(".*source-interface-name=\"(\\S+)\"", 1, extradata) | extend destination_zone_name_s = extract(".*destination-zone-name=\"(\\S+)\"", 1, extradata) | extend destination_interface_name_s = extract(".*destination-interface-name=\"(\\S+)\"", 1, extradata) | extend packet_log_id_s = extract(".*packet-log-id=\"(\\S+)\"", 1, extradata) | extend alert_s = extract(".*alert=\"(\\S+)\"", 1, extradata) | extend username_s = extract(".*username=\"(\\S+)\"", 1, extradata) | extend roles_s = extract(".*roles=\"(\\S+)\"", 1, extradata) | extend msg_s = extract(".*message=\"(\\S+)\"", 1, extradata) | project-away RawDataThe following screenshot shows the complete query in the preceding example in a more readable format:
See more information on the following items used in the preceding examples, in the Kusto documentation:
For more information on KQL, see Kusto Query Language (KQL) overview.
Other resources:
Configure the machine where the Azure Monitor Agent is installed to open the syslog ports, and configure the syslog daemon there to accept messages from external sources. For detailed instructions and a script to automate this configuration, see Configure the log forwarder to accept logs.
For the instructions to configure the Juniper IDP appliance to send syslog messages to an external server, see SRX Getting Started - Configure System Logging..

MarkLogic Audit
Follow these steps to ingest log messages from MarkLogic Audit:
Table name:
MarkLogicAudit_CLLog storage location: Logs are stored as text files on the application's host machine. Install the AMA on the same machine to collect the files.
Default file locations ("filePatterns"):
- Windows:
"C:\Program Files\MarkLogic\Data\Logs\AuditLog.txt" - Linux:
"/var/opt/MarkLogic/Logs/AuditLog.txt"
- Windows:
Create the DCR according to the directions in Collect logs from text files with the Azure Monitor Agent and ingest to Microsoft Sentinel.
Replace the {TABLE_NAME} and {LOCAL_PATH_FILE} placeholders in the DCR template with the values in steps 1 and 2. Replace the other placeholders as directed.
Configure MarkLogic Audit to enable it to write logs: (from MarkLogic documentation)
- Using your browser, navigate to MarkLogic Admin interface.
- Open the Audit Configuration screen under Groups > group_name > Auditing.
- Mark the Audit Enabled radio button. Make sure it is enabled.
- Configure audit event and/or restrictions desired.
- Validate by selecting OK.
- Refer to MarkLogic documentation for more details and configuration options.
MongoDB Audit
Follow these steps to ingest log messages from MongoDB Audit:
Table name:
MongoDBAudit_CLLog storage location: Logs are stored as text files on the application's host machine. Install the AMA on the same machine to collect the files.
Default file locations ("filePatterns"):
- Windows:
"C:\data\db\auditlog.json" - Linux:
"/data/db/auditlog.json"
- Windows:
Create the DCR according to the directions in Collect logs from text files with the Azure Monitor Agent and ingest to Microsoft Sentinel.
Replace the {TABLE_NAME} and {LOCAL_PATH_FILE} placeholders in the DCR template with the values in steps 1 and 2. Replace the other placeholders as directed.
Configure MongoDB to write logs:
- For Windows, edit the configuration file
mongod.cfg. For Linux,mongod.conf. - Set the
dbpathparameter todata/db. - Set the
pathparameter to/data/db/auditlog.json. - Refer to MongoDB documentation for more parameters and details.
- For Windows, edit the configuration file
NGINX HTTP Server
Follow these steps to ingest log messages from NGINX HTTP Server:
Table name:
NGINX_CLLog storage location: Logs are stored as text files on the application's host machine. Install the AMA on the same machine to collect the files.
Default file locations ("filePatterns"):
- Linux:
"/var/log/nginx.log"
- Linux:
Create the DCR according to the directions in Collect logs from text files with the Azure Monitor Agent and ingest to Microsoft Sentinel.
Replace the {TABLE_NAME} and {LOCAL_PATH_FILE} placeholders in the DCR template with the values in steps 1 and 2. Replace the other placeholders as directed.
Oracle WebLogic Server
Follow these steps to ingest log messages from Oracle WebLogic Server:
Table name:
OracleWebLogicServer_CLLog storage location: Logs are stored as text files on the application's host machine. Install the AMA on the same machine to collect the files.
Default file locations ("filePatterns"):
- Windows:
"{DOMAIN_NAME}\Servers\{SERVER_NAME}\logs*.log" - Linux:
"{DOMAIN_HOME}/servers/{SERVER_NAME}/logs/*.log"
- Windows:
Create the DCR according to the directions in Collect logs from text files with the Azure Monitor Agent and ingest to Microsoft Sentinel.
Replace the {TABLE_NAME} and {LOCAL_PATH_FILE} placeholders in the DCR template with the values in steps 1 and 2. Replace the other placeholders as directed.
PostgreSQL Events
Follow these steps to ingest log messages from PostgreSQL Events:
Table name:
PostgreSQL_CLLog storage location: Logs are stored as text files on the application's host machine. Install the AMA on the same machine to collect the files.
Default file locations ("filePatterns"):
- Windows:
"C:\*.log" - Linux:
"/var/log/*.log"
- Windows:
Create the DCR according to the directions in Collect logs from text files with the Azure Monitor Agent and ingest to Microsoft Sentinel.
Replace the {TABLE_NAME} and {LOCAL_PATH_FILE} placeholders in the DCR template with the values in steps 1 and 2. Replace the other placeholders as directed.
Edit the PostgreSQL Events configuration file
postgresql.confto output logs to files.- Set
log_destination='stderr' - Set
logging_collector=on - Refer to PostgreSQL documentation for more parameters and details.
- Set
SecurityBridge Threat Detection for SAP
Follow these steps to ingest log messages from SecurityBridge Threat Detection for SAP:
Table name:
SecurityBridgeLogs_CLLog storage location: Logs are stored as text files on the application's host machine. Install the AMA on the same machine to collect the files.
Default file locations ("filePatterns"):
- Linux:
"/usr/sap/tmp/sb_events/*.cef"
- Linux:
Create the DCR according to the directions in Collect logs from text files with the Azure Monitor Agent and ingest to Microsoft Sentinel.
Replace the {TABLE_NAME} and {LOCAL_PATH_FILE} placeholders in the DCR template with the values in steps 1 and 2. Replace the other placeholders as directed.
SquidProxy
Follow these steps to ingest log messages from SquidProxy:
Table name:
SquidProxy_CLLog storage location: Logs are stored as text files on the application's host machine. Install the AMA on the same machine to collect the files.
Default file locations ("filePatterns"):
- Windows:
"C:\Squid\var\log\squid\*.log" - Linux:
"/var/log/squid/*.log"
- Windows:
Create the DCR according to the directions in Collect logs from text files with the Azure Monitor Agent and ingest to Microsoft Sentinel.
Replace the {TABLE_NAME} and {LOCAL_PATH_FILE} placeholders in the DCR template with the values in steps 1 and 2. Replace the other placeholders as directed.
Ubiquiti UniFi
Follow these steps to ingest log messages from Ubiquiti UniFi:
Table name:
Ubiquiti_CLLog storage location: Create a log file on your external syslog server. Grant the syslog daemon write permissions to the file. Install the AMA on the external syslog server if it's not already installed. Enter this filename and path in the File pattern field in the connector, or in place of the
{LOCAL_PATH_FILE}placeholder in the DCR.Configure the syslog daemon to export its Ubiquiti log messages to a temporary text file so the AMA can collect them.
Create custom configuration file for the rsyslog daemon, in the
/etc/rsyslog.d/folder, with the following filtering conditions:# Define a new ruleset ruleset(name="<RULESET_NAME>") { action(type="omfile" file="<LOG_FILE_NAME>") } # Set the input on port and bind it to the new ruleset input(type="imudp" port="<PORT>" ruleset="<RULESET_NAME>")(Replace
<parameters>with the actual names of the objects represented. <LOG_FILE_NAME> is the file you created in step 2.)Restart rsyslog. The typical command syntax is
systemctl restart rsyslog.
Create the DCR according to the directions in Collect logs from text files with the Azure Monitor Agent and ingest to Microsoft Sentinel.
Replace the column name
"RawData"with the column name"Message".Replace the transformKql value
"source"with the value"source | project-rename Message=RawData".Replace the
{TABLE_NAME}and{LOCAL_PATH_FILE}placeholders in the DCR template with the values in steps 1 and 2. Replace the other placeholders as directed.
Configure the machine where the Azure Monitor Agent is installed to open the syslog ports, and configure the syslog daemon there to accept messages from external sources. For detailed instructions and a script to automate this configuration, see Configure the log forwarder to accept logs.
Configure and connect the Ubiquiti controller.
- Follow the instructions provided by Ubiquiti to enable syslog and optionally debugging logs.
- Select Settings > System Settings > Controller Configuration > Remote Logging and enable syslog.
VMware vCenter
Follow these steps to ingest log messages from VMware vCenter:
Table name:
vcenter_CLLog storage location: Create a log file on your external syslog server. Grant the syslog daemon write permissions to the file. Install the AMA on the external syslog server if it's not already installed. Enter this filename and path in the File pattern field in the connector, or in place of the
{LOCAL_PATH_FILE}placeholder in the DCR.Configure the syslog daemon to export its vCenter log messages to a temporary text file so the AMA can collect them.
Edit the configuration file
/etc/rsyslog.confto add the following template line before the directive section:$template vcenter,"%timestamp% %hostname% %msg%\ n"Create custom configuration file for the rsyslog daemon, saved as
/etc/rsyslog.d/10-vcenter.confwith the following filtering conditions:if $rawmsg contains "vpxd" then { action(type="omfile" file="/<LOG_FILE_NAME>") stop } if $rawmsg contains "vcenter-server" then { action(type="omfile" file="/<LOG_FILE_NAME>") stop }(Replace
<LOG_FILE_NAME>with the name of the log file you created.)Restart rsyslog. The typical command syntax is
sudo systemctl restart rsyslog.
Create the DCR according to the directions in Collect logs from text files with the Azure Monitor Agent and ingest to Microsoft Sentinel.
Replace the column name
"RawData"with the column name"Message".Replace the transformKql value
"source"with the value"source | project-rename Message=RawData".Replace the
{TABLE_NAME}and{LOCAL_PATH_FILE}placeholders in the DCR template with the values in steps 1 and 2. Replace the other placeholders as directed.dataCollectionEndpointId should be populated with your DCE. If you don't have one, define a new one. See Create a data collection endpoint for the instructions.
Configure the machine where the Azure Monitor Agent is installed to open the syslog ports, and configure the syslog daemon there to accept messages from external sources. For detailed instructions and a script to automate this configuration, see Configure the log forwarder to accept logs.
Configure and connect the vCenter devices.
- Follow the instructions provided by VMware for sending syslog messages.
- Use the IP address or hostname of the machine where the Azure Monitor Agent is installed.
Zscaler Private Access (ZPA)
Follow these steps to ingest log messages from Zscaler Private Access (ZPA):
Table name:
ZPA_CLLog storage location: Create a log file on your external syslog server. Grant the syslog daemon write permissions to the file. Install the AMA on the external syslog server if it's not already installed. Enter this filename and path in the File pattern field in the connector, or in place of the
{LOCAL_PATH_FILE}placeholder in the DCR.Configure the syslog daemon to export its ZPA log messages to a temporary text file so the AMA can collect them.
Create custom configuration file for the rsyslog daemon, in the
/etc/rsyslog.d/folder, with the following filtering conditions:# Define a new ruleset ruleset(name="<RULESET_NAME>") { action(type="omfile" file="<LOG_FILE_NAME>") } # Set the input on port and bind it to the new ruleset input(type="imudp" port="<PORT>" ruleset="<RULESET_NAME>")(Replace
<parameters>with the actual names of the objects represented.)Restart rsyslog. The typical command syntax is
systemctl restart rsyslog.
Create the DCR according to the directions in Collect logs from text files with the Azure Monitor Agent and ingest to Microsoft Sentinel.
Replace the column name
"RawData"with the column name"Message".Replace the transformKql value
"source"with the value"source | project-rename Message=RawData".Replace the
{TABLE_NAME}and{LOCAL_PATH_FILE}placeholders in the DCR template with the values in steps 1 and 2. Replace the other placeholders as directed.
Configure the machine where the Azure Monitor Agent is installed to open the syslog ports, and configure the syslog daemon there to accept messages from external sources. For detailed instructions and a script to automate this configuration, see Configure the log forwarder to accept logs.
Configure and connect the ZPA receiver.
- Follow the instructions provided by ZPA. Select JSON as the log template.
- Select Settings > System Settings > Controller Configuration > Remote Logging and enable syslog.