Monitor online endpoints
Azure Machine Learning uses integration with Azure Monitor to track and monitor metrics and logs for online endpoints. You can view metrics in charts, compare metrics among endpoints and deployments, pin metrics to Azure portal dashboards, configure alerts, query log tables, and push logs to supported targets. You can also use Application Insights to analyze events from user containers.
Metrics: For endpoint-level metrics such as request latency, requests per minute, new connections per second, and network bytes, you can drill down to see detailed information at the deployment level or status level. You can also drill down deployment-level metrics such as CPU/GPU usage and memory or disk usage to the instance level. In Monitor, you can track these metrics in charts, and you can set up dashboards and alerts for further analysis.
Logs: You can send metrics to a Log Analytics workspace, where you can use Kusto query syntax to query the logs. You can also send metrics to Azure Storage accounts or Azure Event Hubs for further processing. For traffic, console (container) logs, and events related to online endpoints, you can use dedicated log tables. Kusto queries support complex analysis capabilities and the joining of multiple tables.
Application Insights: Curated environments include integration with Application Insights. You can turn this integration on or off when you create an online deployment. When you turn it on, built-in metrics and logs are sent to Application Insights. You can then use the built-in features of Application Insights for further analysis. Examples of those features include live metrics, the transaction search, the failures view, and the performance view.
In this article you see how to:
- Choose the right method to view and track metrics and logs.
- View metrics for your online endpoint.
- Create a dashboard for your metrics.
- Create a metric alert.
- View logs for your online endpoint.
- Use Application Insights to track metrics and logs.
Prerequisites
- An Azure Machine Learning online endpoint
- At least Reader access on the endpoint
Use metrics
In the Azure portal, you can view metrics pages for online endpoints and deployments.
Access metrics from Azure Machine Learning studio
An easy way to access metrics pages is through links that are available in the Azure Machine Learning studio user interface. You can find these links in the Details tab of an endpoint's page. These links lead to the metrics page in the Azure portal for the endpoint or deployment.
To access the metrics pages through links that are available in the studio, take the following steps:
In Azure Machine Learning studio, go to your workspace.
Under Assets, select Endpoints.
Select the name of an endpoint.
Under Endpoint attributes, select View metrics.
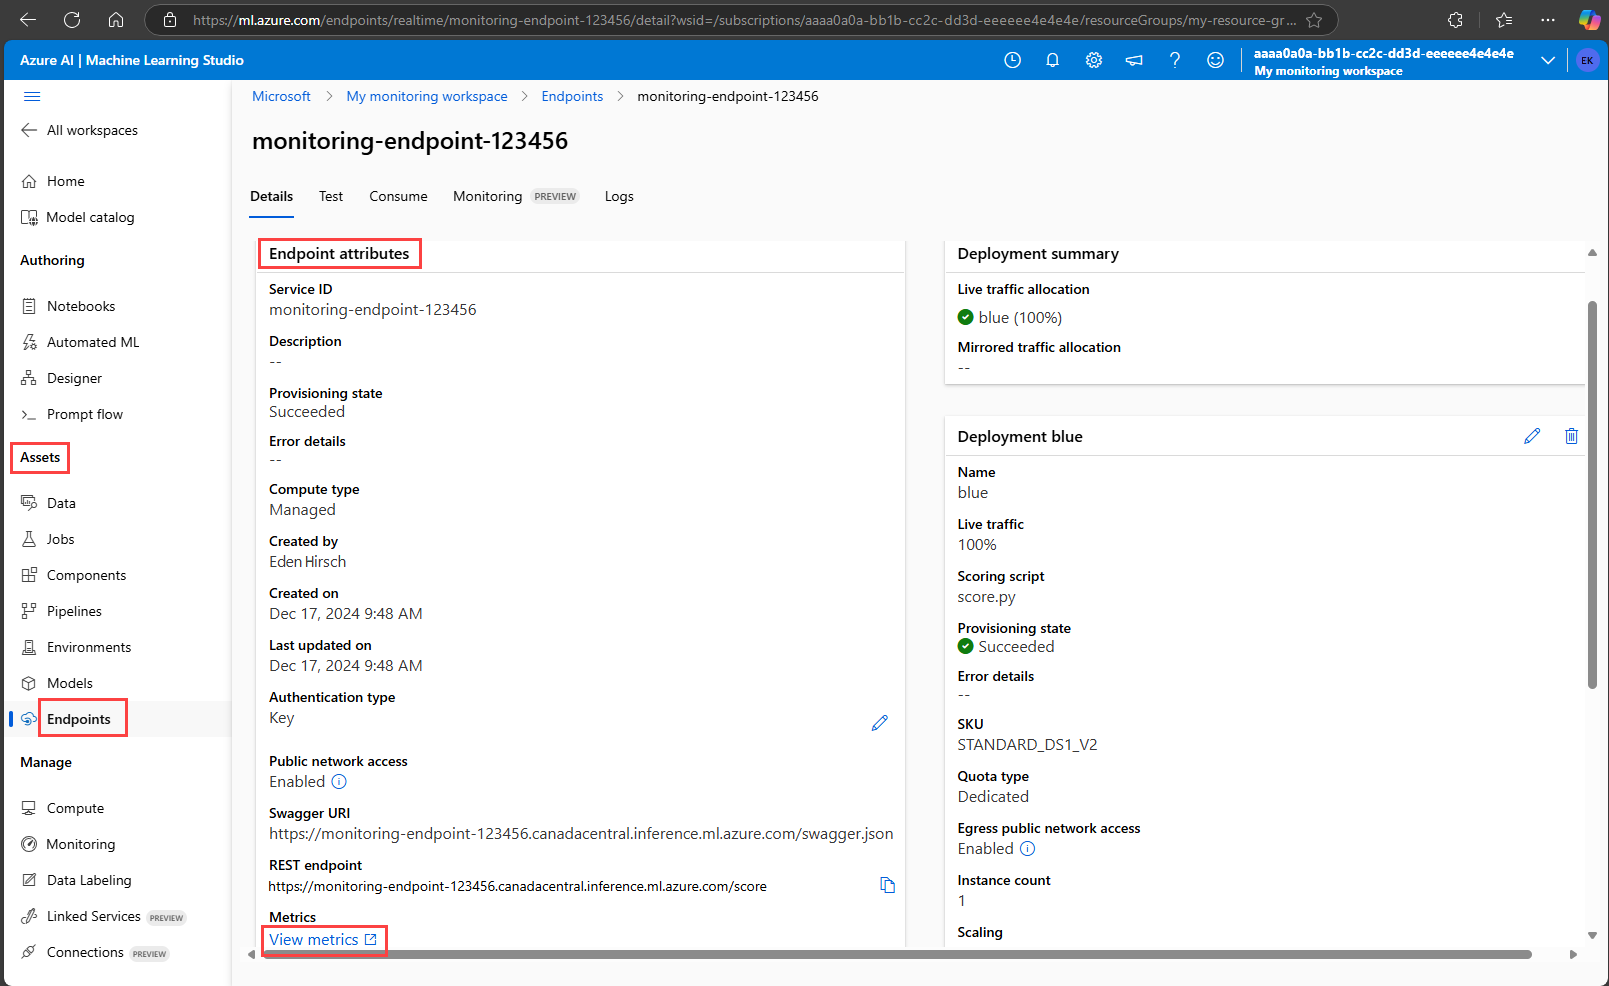
The endpoint's metrics page opens in the Azure portal.
In Azure Machine Learning studio, on an endpoint page, go to the section for a deployment, and then select View metrics.
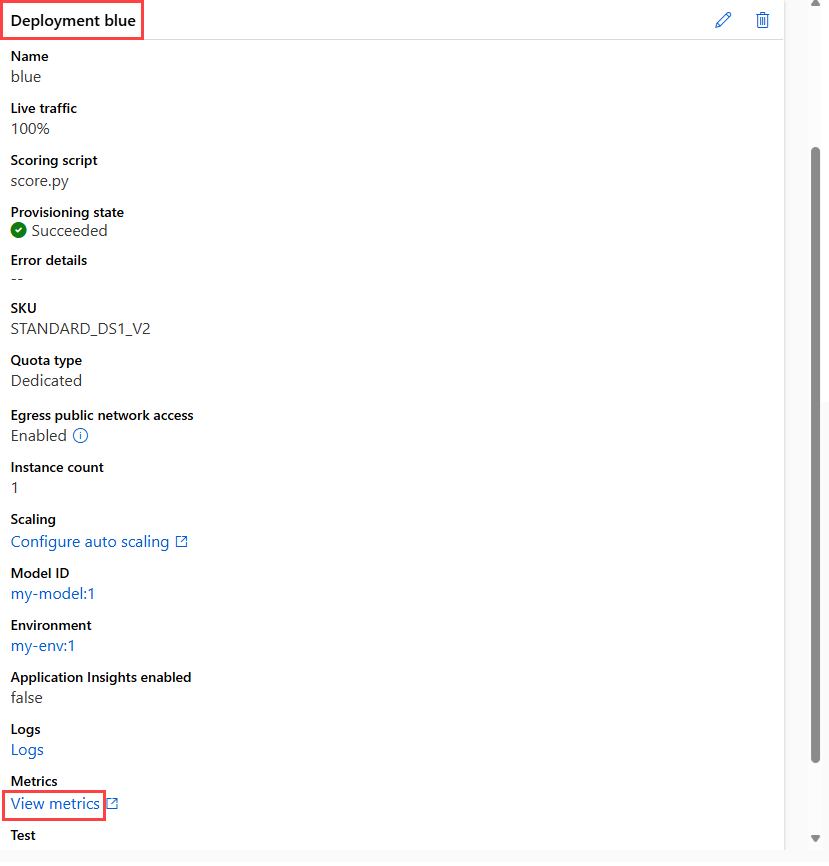
The deployment's metrics page opens in the Azure portal.


Access metrics from the Azure portal
Another way to view the metrics page for an endpoint or deployment is to go directly to the Azure portal:
Go to the Azure portal.
Go to the online endpoint or deployment resource.
Online endpoints and deployments are Azure Resource Manager resources. You can find them by going to their resource group and then looking for the resource types Machine Learning online endpoint and Machine Learning online deployment.
On the resource page, under Monitoring, select Metrics.


Available metrics
The metrics that you see depend on the resource that you select. Metrics for online endpoints and online deployments are scoped differently.
Metrics at the endpoint scope
For information about metrics that are available at the online endpoint scope, see Supported metrics for Microsoft.MachineLearningServices/workspaces/onlineEndpoints.
Bandwidth throttling
Bandwidth is throttled if quota limits are exceeded for managed online endpoints. For more information about limits for online endpoints, see Azure Machine Learning online endpoints and batch endpoints in the article about quotas and limits in Azure Machine Learning. To determine whether requests are throttled:
- Monitor the Network bytes metric.
- Check for the following fields in the response trailers:
ms-azureml-bandwidth-request-delay-msandms-azureml-bandwidth-response-delay-ms. The values of the fields are the delays, in milliseconds, of the bandwidth throttling.
For more information, see Bandwidth limit issues.
Metrics at the deployment scope
For information about metrics that are available at the deployment scope, see Supported metrics for Microsoft.MachineLearningServices/workspaces/onlineEndpoints/deployments.
Create dashboards and alerts
In Monitor, you can create dashboards and alerts that are based on metrics.
Create dashboards and visualize queries
You can create custom dashboards so that you can visualize metrics from multiple sources in the Azure portal, including the metrics for your online endpoint. For more information about creating dashboards and visualizing queries, see Create and share dashboards of Log Analytics data and Create custom KPI dashboards using Application Insights.
Create alerts
You can also create custom alerts so that you receive notifications about important status updates to your online endpoint:
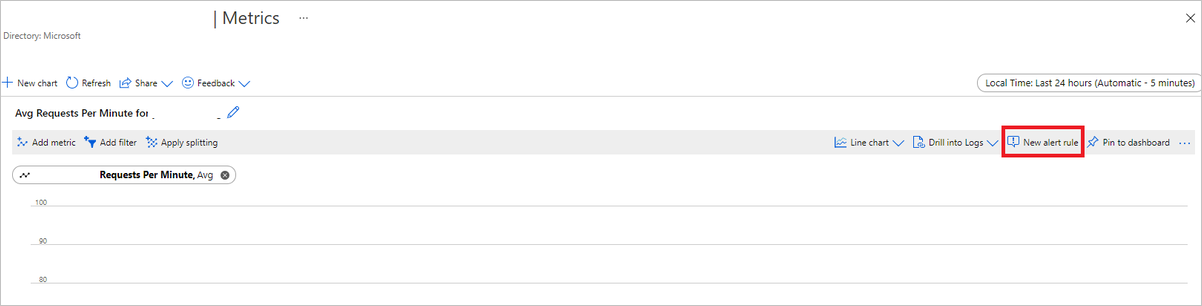
In the Azure portal, go to a metrics page, and then select New alert rule.
In the Select a signal window, select the signal that you want to create an alert for, and then select Apply.
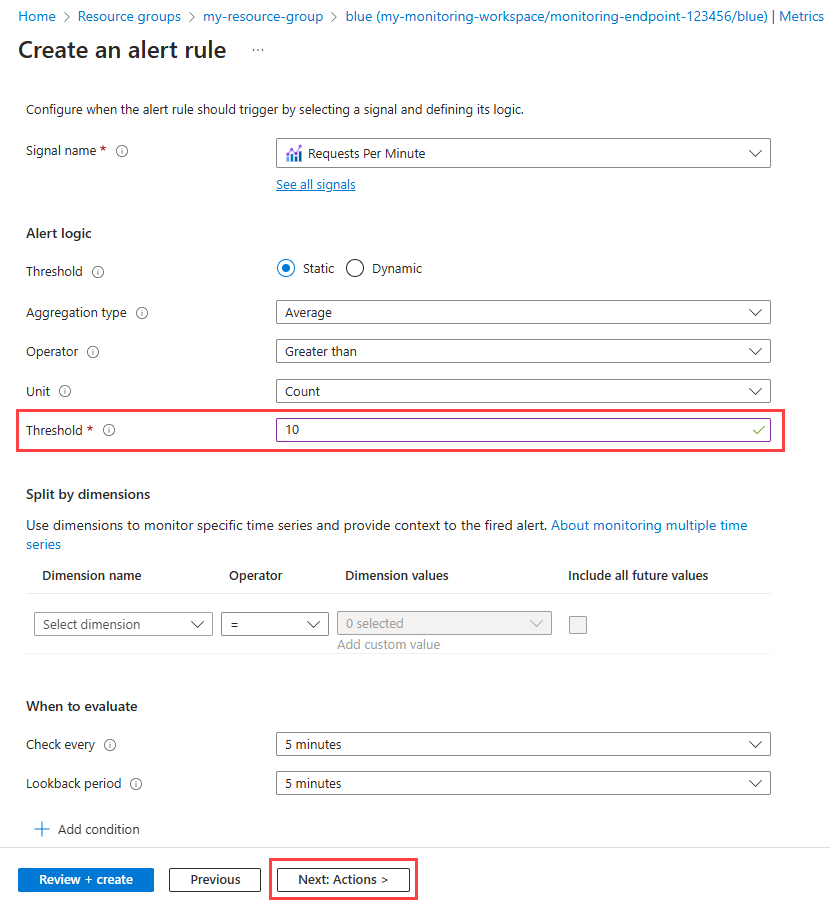
In the Create an alert rule page, enter a threshold, and edit any other settings that you want to adjust. For more information about alert rule settings, see Configure the alert rule conditions. Then select Next: Actions.
In the Select action groups window, create or select an action group to specify what happens when your alert is triggered. For more information, see Configure the alert rule details.
Select Review + Create to finish creating your alert.


Scale automatically based on metrics
You can configure deployments to scale automatically based on metrics. To turn on the autoscale feature, you can use the UI or code.
The options for code are the Azure Machine Learning CLI and the Azure Machine Learning SDK for Python. When you use code, you configure the conditions for triggering automatic scaling by providing the REST API name of metrics.
- For the names of endpoint metrics to use in code, see the values in the Name in REST API column in the table in Supported metrics for Microsoft.MachineLearningServices/workspaces/onlineEndpoints.
- For the names of deployment metrics to use in code, see the values in the Name in REST API column in the tables in Supported metrics for Microsoft.MachineLearningServices/workspaces/onlineEndpoints/deployments.
For more information, see Autoscale online endpoints in Azure Machine Learning.
Use logs
There are three logs that you can turn on for online endpoints:
AmlOnlineEndpointTrafficLog: This traffic log provides a way for you to check the information of requests to the endpoint. This log is useful in the following cases:
- A request response isn't 200, and you want more information. The
ResponseCodeReasoncolumn in the log lists the reason. For descriptions of status codes and reasons, see HTTPS status codes in the article about troubleshooting online endpoints. - You want to look up the response code and response reason of your model for a request. The
ModelStatusCodeandModelStatusReasoncolumns provide this information. - You want to know the duration of a request. The logs provide a breakdown of the latency. That breakdown shows the total duration, the request duration, the response duration, and the delay that's caused by network throttling.
- You want to check the number of recent requests that succeed and fail. The logs provide this information.
- A request response isn't 200, and you want more information. The
AmlOnlineEndpointConsoleLog: This log contains statements that the containers write as output to the console. This log is useful in the following cases:
- A container fails to start. The console log can be useful for debugging.
- You want to monitor container behavior and make sure that all requests are correctly handled.
- You want to trace a request from the network entry point of an online endpoint to the container. You can use a Log Analytics query that joins the request ID with information from the AmlOnlineEndpointConsoleLog and AmlOnlineEndpointTrafficLog logs.
- You want to run a performance analysis, for instance, to determine the time the model takes to process each request.
AmlOnlineEndpointEventLog: This log contains event information about the container life cycle. Currently, the log provides information about the following types of events:
Name Message BackOff Back-off restarting failed container Pulled Container image "<IMAGE_NAME>" already present on machine Killing Container inference-server failed liveness probe, will be restarted Created Created container image-fetcher Created Created container inference-server Created Created container model-mount LivenessProbeFailed Liveness probe failed: <FAILURE_CONTENT> ReadinessProbeFailed Readiness probe failed: <FAILURE_CONTENT> Started Started container image-fetcher Started Started container inference-server Started Started container model-mount Killing Stopping container inference-server Killing Stopping container model-mount
Turn on logs
Important
Logging uses the Log Analytics feature of Monitor. If you don't currently have a Log Analytics workspace, you can create one by following the steps in Create a workspace.
In the Azure portal, go to the resource group that contains your endpoint, and then select the endpoint.
Under Monitoring, select Diagnostic settings, and then select Add diagnostic setting.
In the Diagnostic setting window, enter the following information:
- Next to Diagnostic setting name, enter a name for your setting.
- Under Logs, select the log categories that you want to turn on.
- Under Destination details, select Send to Log Analytics workspace, and then select the subscription and the Log Analytics workspace to use.
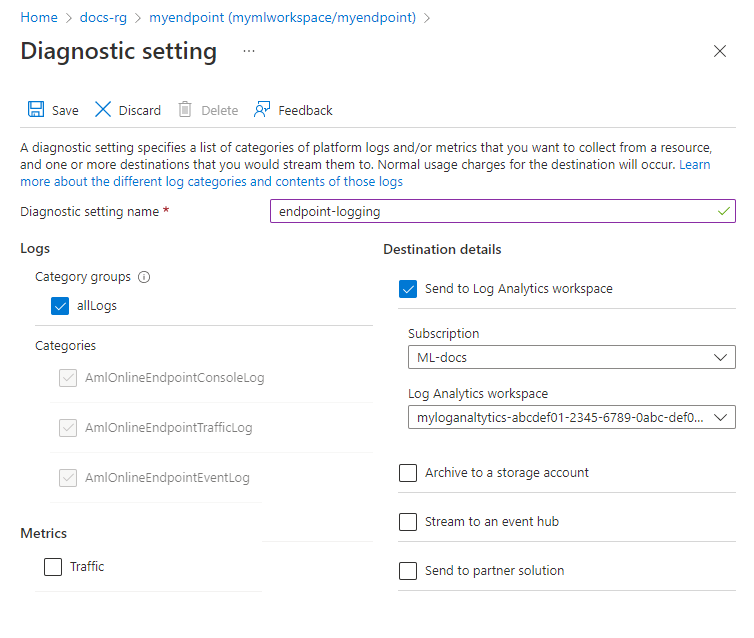
Select Save.
Important
It can take up to an hour for the connection to the Log Analytics workspace to be available. Wait an hour before continuing with the steps in the next section.

Query logs
Submit scoring requests to the endpoint to create entries in the logs.
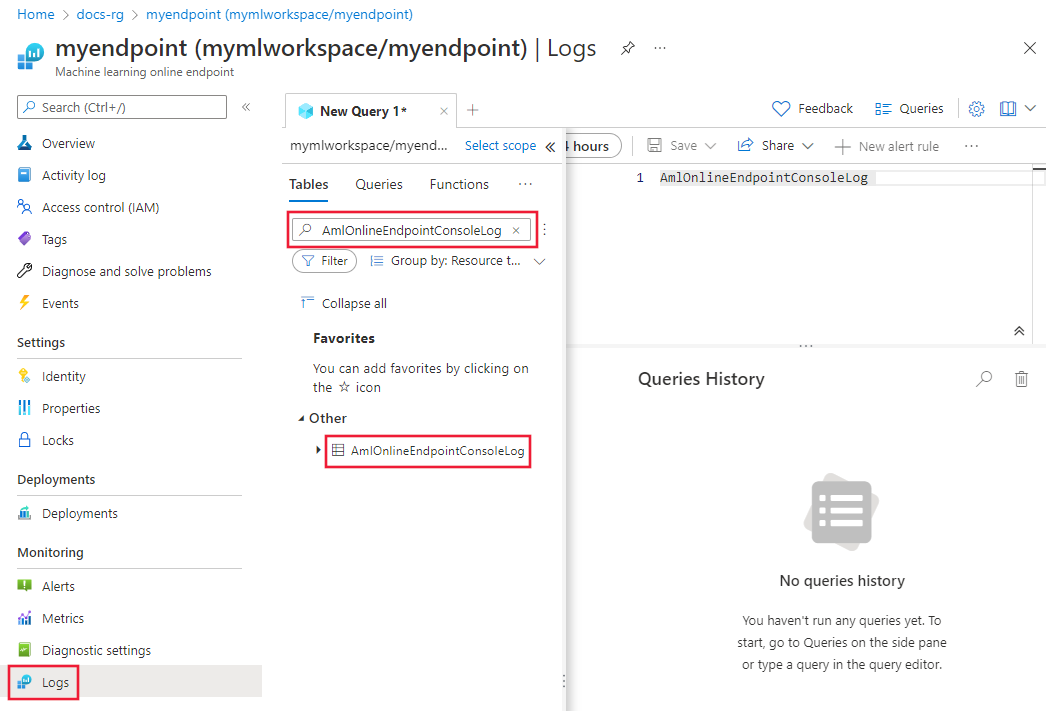
Go to the Azure portal. To open the logs, use one of the following options:
- Go to the properties page for your online endpoint. Under Monitoring, select Logs.
- Go to your Log Analytics workspace. On the left, select Logs.
Close the Queries hub window that opens by default.
Under Other, double-click AmlOnlineEndpointConsoleLog. If you don't see AmlOnlineEndpointConsoleLog, enter that value into the search field.
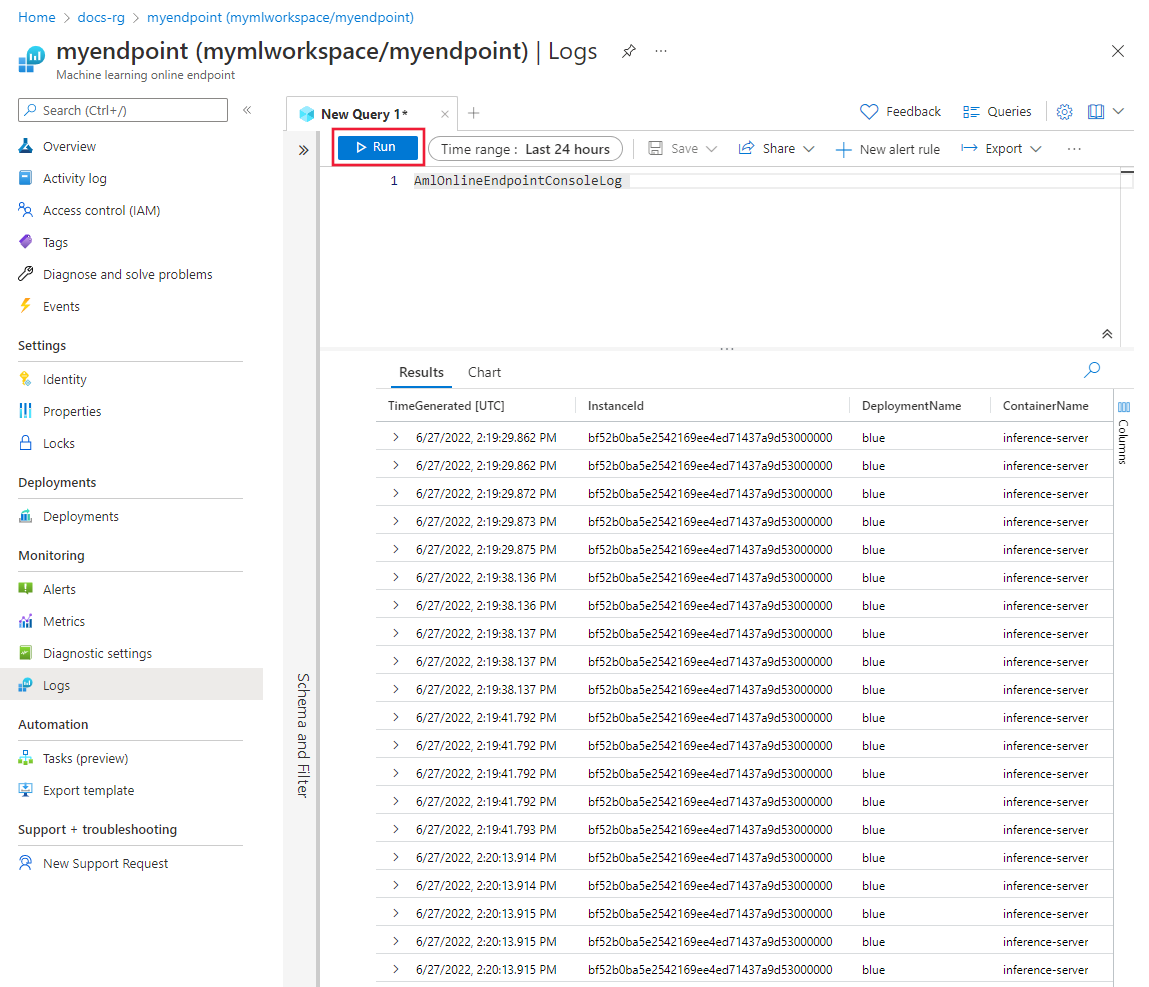
Select Run.


Example queries
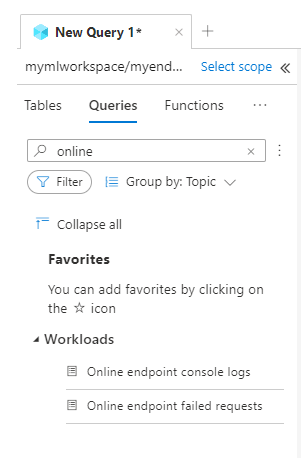
Example queries are available for you to use. To view the queries, take the following steps:
On the Logs page, select Queries.
In the search box, enter Online endpoint.

Log column details
The following tables provide detailed information about the data that's stored in each log:
AmlOnlineEndpointTrafficLog
| Property | Description |
|---|---|
| Method | The method that the client requests. |
| Path | The path that the client requests. |
| SubscriptionId | The machine learning subscription ID of the online endpoint. |
| AzureMLWorkspaceId | The machine learning workspace ID of the online endpoint. |
| AzureMLWorkspaceName | The machine learning workspace name of the online endpoint. |
| EndpointName | The name of the online endpoint. |
| DeploymentName | The name of the online deployment. |
| Protocol | The protocol of the request. |
| ResponseCode | The final response code that's returned to the client. |
| ResponseCodeReason | The final response code reason that's returned to the client. |
| ModelStatusCode | The response status code from the model. |
| ModelStatusReason | The response status reason from the model. |
| RequestPayloadSize | The total bytes received from the client. |
| ResponsePayloadSize | The total bytes sent back to the client. |
| UserAgent | The user-agent header of the request, including comments but truncated to a maximum of 70 characters. |
| XRequestId | The request ID that Azure Machine Learning generates for internal tracing. |
| XMSClientRequestId | The tracking ID that the client generates. |
| TotalDurationMs | The duration in milliseconds from the request start time to the time the last response byte is sent back to the client. If the client disconnects, the duration is taken from the start time to the client disconnect time. |
| RequestDurationMs | The duration in milliseconds from the request start time to the time the last byte of the request is received from the client. |
| ResponseDurationMs | The duration in milliseconds from the request start time to the time the first response byte is read from the model. |
| RequestThrottlingDelayMs | The delay in milliseconds in the request data transfer due to network throttling. |
| ResponseThrottlingDelayMs | The delay in milliseconds in the response data transfer due to network throttling. |
AmlOnlineEndpointConsoleLog
| Property | Description |
|---|---|
| TimeGenerated | The UTC time stamp of the time the log is generated |
| OperationName | The operation associated with the log record |
| InstanceId | The ID of the instance that generates the log record |
| DeploymentName | The name of the deployment associated with the log record |
| ContainerName | The name of the container where the log is generated |
| Message | The content of the log |
AmlOnlineEndpointEventLog
| Property | Description |
|---|---|
| TimeGenerated | The UTC time stamp of the time the log is generated |
| OperationName | The operation associated with the log record |
| InstanceId | The ID of the instance that generates the log record |
| DeploymentName | The name of the deployment associated with the log record |
| Name | The name of the event |
| Message | The content of the event |
Use Application Insights
Curated environments include integration with Application Insights. Through this integration, built-in metrics and logs are sent to Application Insights. As a result, you can use Application Insights built-in features for further analysis. Examples of those features include live metrics, the transaction search, the failures view, and the performance view.
For more information, see Application Insights overview.
You can turn on integration with Application Insights when you create an online deployment in the studio. On the Deployment page, under Application Insights diagnostics, select Enabled.

When you turn on Application Insights, you can see high-level activity monitor graphs for a managed online endpoint. In the studio, go to the endpoint's page, and then select the Monitoring tab.
