Configure broker settings for high availability, scaling, and memory usage
The Broker resource is the main resource that defines the overall settings for an MQTT broker. It also determines the number and type of pods that run the Broker configuration, such as the frontends and the backends. You can also use the Broker resource to configure its memory profile. Self-healing mechanisms are built in to the broker, and it can often automatically recover from component failures. An example is if a node fails in a Kubernetes cluster configured for high availability.
You can horizontally scale the MQTT broker by adding more frontend replicas and backend partitions. The frontend replicas are responsible for accepting MQTT connections from clients and forwarding them to the backend partitions. The backend partitions are responsible for storing and delivering messages to the clients. The frontend pods distribute message traffic across the backend pods. The backend redundancy factor determines the number of data copies to provide resiliency against node failures in the cluster.
For a list of the available settings, see the Broker API reference.
Configure scaling settings
Important
This setting requires that you modify the Broker resource. It's configured only at initial deployment by using the Azure CLI or the Azure portal. A new deployment is required if Broker configuration changes are needed. To learn more, see Customize default Broker.
To configure the scaling settings of the MQTT broker, specify the cardinality fields in the specification of the Broker resource during Azure IoT Operations deployment.
Automatic deployment cardinality
To automatically determine the initial cardinality during deployment, omit the cardinality field in the Broker resource.
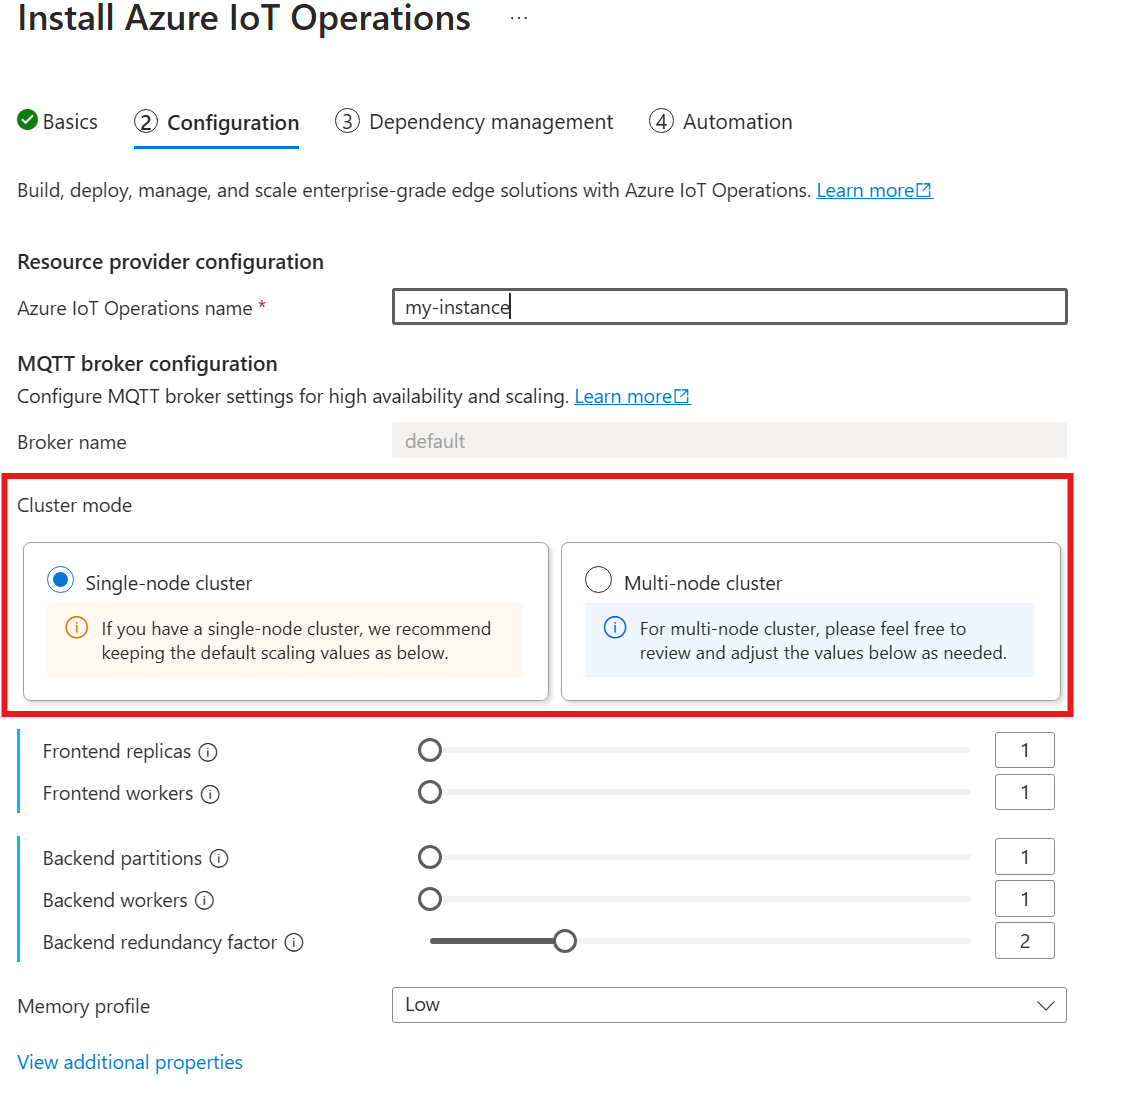
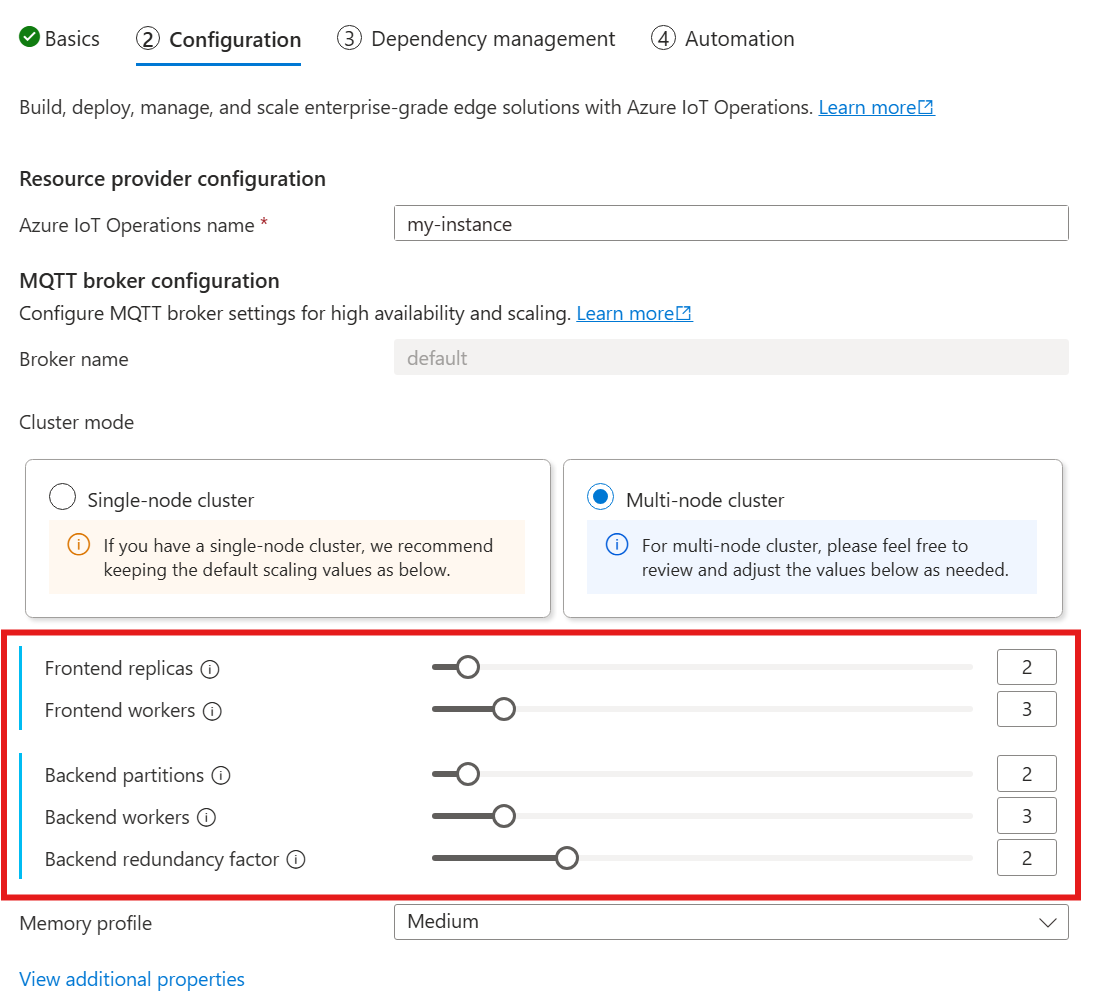
Automatic cardinality isn't yet supported when you deploy IoT Operations through the Azure portal. You can manually specify the cluster deployment mode as either Single node or Multi-node. To learn more, see Deploy Azure IoT Operations.
The MQTT broker operator automatically deploys the appropriate number of pods based on the number of available nodes at the time of the deployment. This capability is useful for nonproduction scenarios where you don't need high availability or scale.
This capability is not autoscaling. The operator doesn't automatically scale the number of pods based on the load. The operator determines the initial number of pods to deploy only based on the cluster hardware. As noted previously, cardinality is set only at initial deployment time. A new deployment is required if the cardinality settings need to be changed.
Configure cardinality directly
To configure the cardinality settings directly, specify each of the cardinality fields.
When you follow the guide to deploy IoT Operations, in the Configuration section, look under MQTT broker configuration. Here, you can specify the number of frontend replicas, backend partitions, and backend workers.
Understand cardinality
Cardinality means the number of instances of a particular entity in a set. In the context of the MQTT broker, cardinality refers to the number of frontend replicas, backend partitions, and backend workers to deploy. The cardinality settings are used to scale the broker horizontally and improve high availability if there are pod or node failures.
The cardinality field is a nested field, with subfields for the frontend and the backend chain. Each of these subfields has its own settings.
Frontend
The frontend subfield defines the settings for the frontend pods. The two main settings are:
- Replicas: The number of frontend replicas (pods) to deploy. Increasing the number of frontend replicas provides high availability in case one of the frontend pods fails.
- Workers: The number of logical frontend workers per replica. Each worker can consume up to one CPU core at most.
Backend chain
The backend chain subfield defines the settings for the backend partitions. The three main settings are:
- Partitions: The number of partitions to deploy. Through a process called sharding, each partition is responsible for a portion of the messages, divided by topic ID and session ID. The frontend pods distribute message traffic across the partitions. Increasing the number of partitions increases the number of messages that the broker can handle.
- Redundancy factor: The number of backend replicas (pods) to deploy per partition. Increasing the redundancy factor increases the number of data copies to provide resiliency against node failures in the cluster.
- Workers: The number of workers to deploy per backend replica. Increasing the number of workers per backend replica might increase the number of messages that the backend pod can handle. Each worker can consume up to two CPU cores at most, so be careful when you increase the number of workers per replica to not exceed the number of CPU cores in the cluster.
Considerations
When you increase the cardinality values, the broker's capacity to handle more connections and messages generally improves, and it enhances high availability if there are pod or node failures. This increased capacity also leads to higher resource consumption. So when you adjust cardinality values, consider the memory profile settings and broker's CPU resource requests. Increasing the number of workers per frontend replica can help increase CPU core utilization if you discover that frontend CPU utilization is a bottleneck. Increasing the number of backend workers can help with the message throughput if backend CPU utilization is a bottleneck.
For example, if your cluster has three nodes, each with eight CPU cores, then set the number of frontend replicas to match the number of nodes (3) and set the number of workers to 1. Set the number of backend partitions to match the number of nodes (3) and set the backend workers to 1. Set the redundancy factor as desired (2 or 3). Increase the number of frontend workers if you discover that frontend CPU utilization is a bottleneck. Remember that backend and frontend workers might compete for CPU resources with each other and other pods.
Configure memory profile
Important
This setting requires you to modify the Broker resource. It's configured only at initial deployment by using the Azure CLI or the Azure portal. A new deployment is required if Broker configuration changes are needed. To learn more, see Customize default Broker.
To configure the memory profile settings of the MQTT broker, specify the memory profile fields in the specification of the Broker resource during IoT Operations deployment.
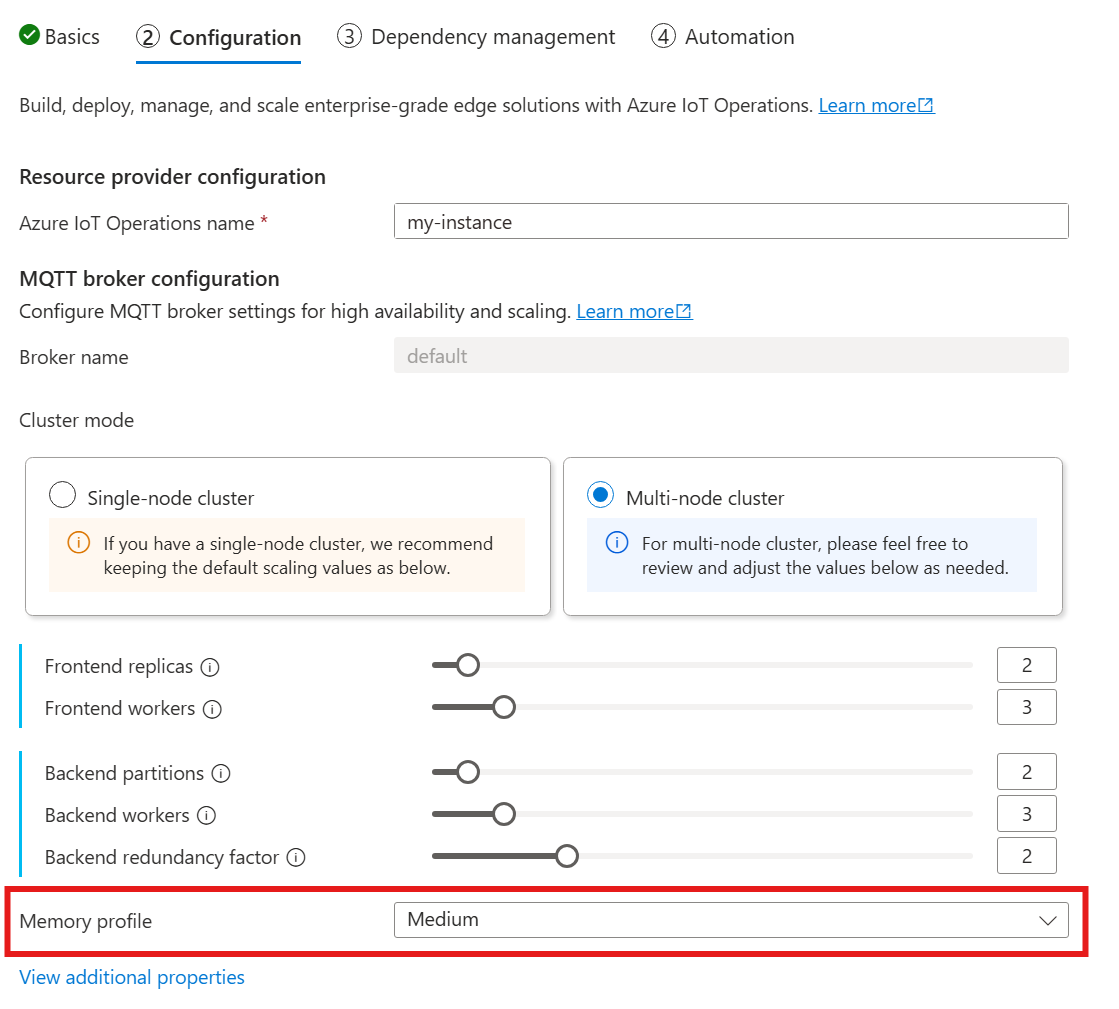
When you use the following guide to deploy IoT Operations, in the Configuration section, look under MQTT broker configuration and find the Memory profile setting. Here, you can select from the available memory profiles in a dropdown list.
There are a few memory profiles to choose from, each with different memory usage characteristics.
Tiny
When you use this profile:
- Maximum memory usage of each frontend replica is approximately 99 MiB, but the actual maximum memory usage might be higher.
- Maximum memory usage of each backend replica is approximately 102 MiB multiplied by the number of backend workers, but the actual maximum memory usage might be higher.
Recommendations when you use this profile:
- Only one frontend should be used.
- Clients shouldn't send large packets. You should only send packets smaller than 4 MiB.
Low
When you use this profile:
- Maximum memory usage of each frontend replica is approximately 387 MiB, but the actual maximum memory usage might be higher.
- Maximum memory usage of each backend replica is approximately 390 MiB multiplied by the number of backend workers, but the actual maximum memory usage might be higher.
Recommendations when you use this profile:
- Only one or two frontends should be used.
- Clients shouldn't send large packets. You should only send packets smaller than 10 MiB.
Medium
Medium is the default profile.
- Maximum memory usage of each frontend replica is approximately 1.9 GiB, but the actual maximum memory usage might be higher.
- Maximum memory usage of each backend replica is approximately 1.5 GiB multiplied by the number of backend workers, but the actual maximum memory usage might be higher.
High
- Maximum memory usage of each frontend replica is approximately 4.9 GiB, but the actual maximum memory usage might be higher.
- Maximum memory usage of each backend replica is approximately 5.8 GiB multiplied by the number of backend workers, but the actual maximum memory usage might be higher.
Cardinality and Kubernetes resource limits
To prevent resource starvation in the cluster, the broker is configured by default to request Kubernetes CPU resource limits. Scaling the number of replicas or workers proportionally increases the CPU resources required. A deployment error is emitted if there are insufficient CPU resources available in the cluster. This notification helps you avoid situations where the requested broker cardinality lacks enough resources to run optimally. It also helps to avoid potential CPU contention and pod evictions.
The MQTT broker currently requests one (1.0) CPU unit per frontend worker and two (2.0) CPU units per backend worker. For more information, see Kubernetes CPU resource units.
For example, the following cardinality would request the following CPU resources:
- For frontends: 2 CPU units per frontend pod, totaling 6 CPU units.
- For backends: 4 CPU units per backend pod (for two backend workers), times 2 (redundancy factor), times 3 (number of partitions), totaling 24 CPU units.
{
  "cardinality": {
    "frontend": {
      "replicas": 3,
      "workers": 2
    },
    "backendChain": {
      "partitions": 3,
      "redundancyFactor": 2,
      "workers": 2
    }
  }
}
To disable this setting, set the generateResourceLimits.cpu field to Disabled in the Broker resource.
Changing the generateResourceLimits field isn't supported in the Azure portal. To disable this setting, use the Azure CLI.
Multi-node deployment
To ensure high availability and resilience with multi-node deployments, the IoT Operations MQTT broker automatically sets anti-affinity rules for backend pods.
These rules are predefined and can't be modified.
Purpose of anti-affinity rules
The anti-affinity rules ensure that backend pods from the same partition don't run on the same node. This capability helps to distribute the load and provides resilience against node failures. Specifically, backend pods from the same partition have anti-affinity with each other.
Verify anti-affinity settings
To verify the anti-affinity settings for a backend pod, use the following command:
kubectl get pod aio-broker-backend-1-0 -n azure-iot-operations -o yaml | grep affinity -A 15
The output shows the anti-affinity configuration, similar to the following example:
affinity:
  podAntiAffinity:
    preferredDuringSchedulingIgnoredDuringExecution:
    - podAffinityTerm:
        labelSelector:
          matchExpressions:
          - key: chain-number
            operator: In
            values:
            - "1"
        topologyKey: kubernetes.io/hostname
      weight: 100
These rules are the only anti-affinity rules set for the broker.