Quickstart: Get insights from your processed data
In this quickstart, you populate a Real-Time Dashboard to capture insights from the OPC UA data that you sent to Event Hubs in the previous quickstart. Using Microsoft Fabric Real-Time Intelligence, you bring your data from Event Hubs into Microsoft Fabric, and map it into a KQL database that can be a source for Real-Time Dashboards. Then, you build a dashboard to display that data in visual tiles that capture insights and show the values over time.
These operations are the last steps in the sample end-to-end quickstart experience, which goes from deploying Azure IoT Operations at the edge through getting insights from that device data in the cloud.
Prerequisites
Before you begin this quickstart, you must complete the previous Azure IoT Operations quickstarts.
You also need to meet the following Fabric requirements:
- Have a Microsoft Fabric subscription. In your subscription, you need access to a workspace with Contributor or above permissions.
- Your Fabric tenant must allow the creation of Real-Time Dashboards. This is a setting that can be enabled by your tenant administrator. For more information, see Enable tenant settings in the admin portal.
What problem will we solve?
Once your OPC UA data has arrived in the cloud, you have a lot of information available to analyze. You might want to organize that data and create reports containing graphs and visualizations to derive insights from the data. The steps in this quickstart illustrate how you can connect that data to Real-Time Intelligence and create a Real-Time Dashboard.
Ingest data into Real-Time Intelligence
In this section, you set up a Microsoft Fabric eventstream to connect your event hub to a KQL database in Real-Time Intelligence. This process includes setting up a data mapping to transform the payload data from its JSON format to columns in KQL.
Create an eventstream
In this section, you create an eventstream that's used to bring your data from Event Hubs into Microsoft Fabric Real-Time Intelligence, and eventually into a KQL database.
Start by navigating to the Real-Time hub in Microsoft Fabric.
Add your event hub as a data source for a new eventstream (for detailed instructions, see Get events from Azure Event Hubs into Real-time hub). As you add the data source, keep the following notes in mind:
- You can edit the Eventstream name to something friendly in the Stream details pane.
- For Azure Event Hub Key, use the default selection (RootManageSharedAccessKey).
- For Connection, create a new connection with Shared Access Key authentication. The connection credential details should fill automatically.
- Make sure local authentication is enabled on your Event Hubs namespace. You can set this from its Overview page in the Azure portal.
- For Consumer group, use the default selection ($Default).
- For Data format, use the default selection (Json).
After connecting the eventstream, use the Open Eventstream button to see it in the authoring canvas. The stream from your Azure event hub is visible as an eventstream source.
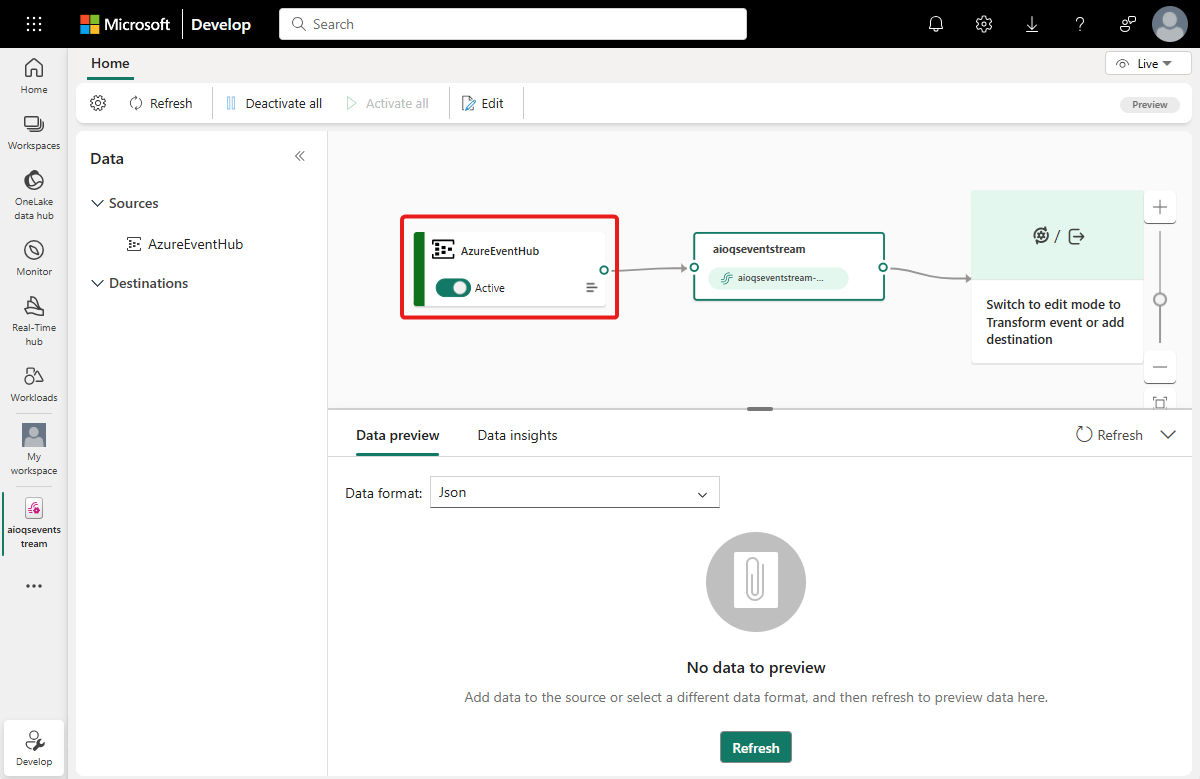
Verify data flow
Follow these steps to check your work so far, and make sure data is flowing into the eventstream.
Start your cluster where you deployed Azure IoT Operations in earlier quickstarts. The OPC PLC simulator you deployed with your Azure IoT Operations instance should begin running and sending data. You can confirm this by verifying that your event hub is receiving messages in the Azure portal.
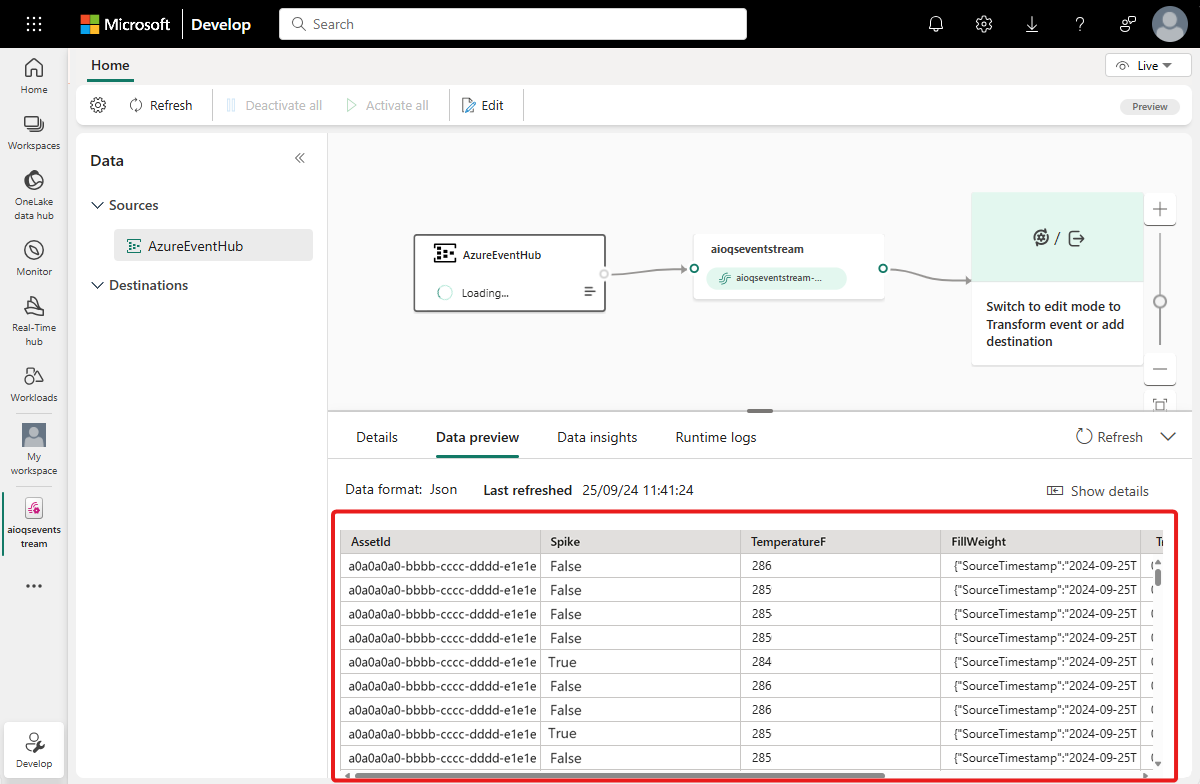
Wait a few minutes for data to propagate. Then, in the eventstream live view, select the eventstream source and refresh the Data preview. You should see JSON data from the simulator begin to appear in the table.
Tip
If data isn't arriving in your eventstream, you may want to check your event hub activity to help you isolate which section of the flow to debug.
Prepare KQL resources
In this section, you create a KQL database in your Microsoft Fabric workspace to use as a destination for your data.
First, create a Real-Time Intelligence Eventhouse (for detailed instructions, see Create an Eventhouse). When the Eventhouse is created, it automatically contains a default KQL database of the same name.
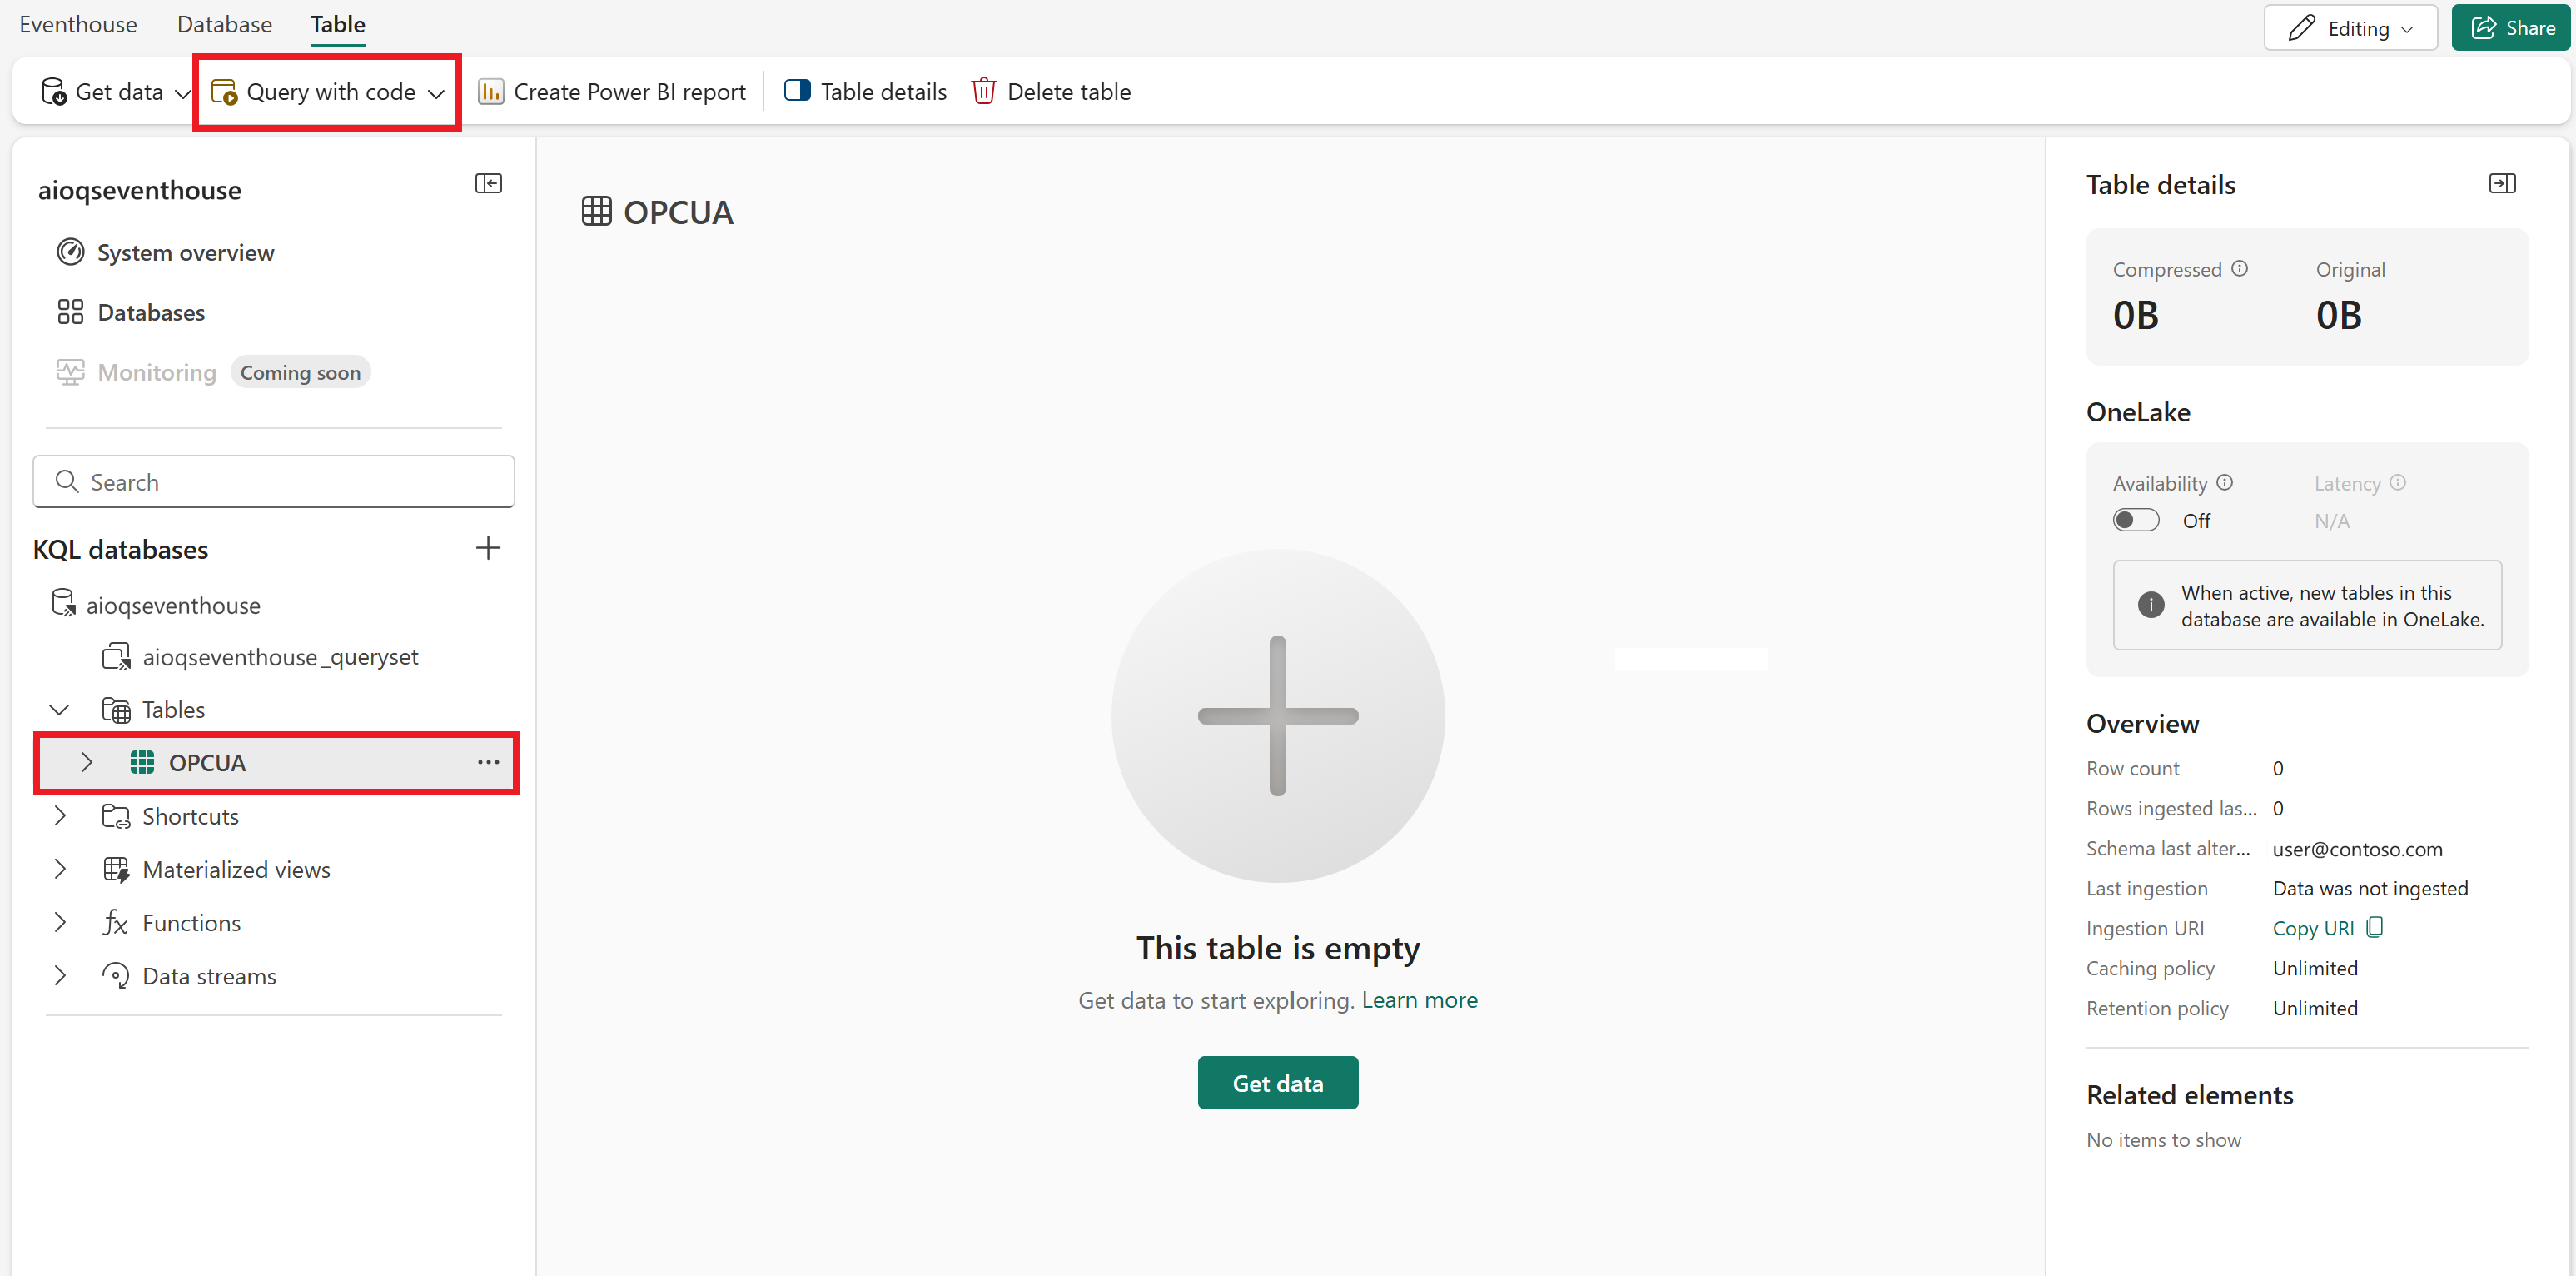
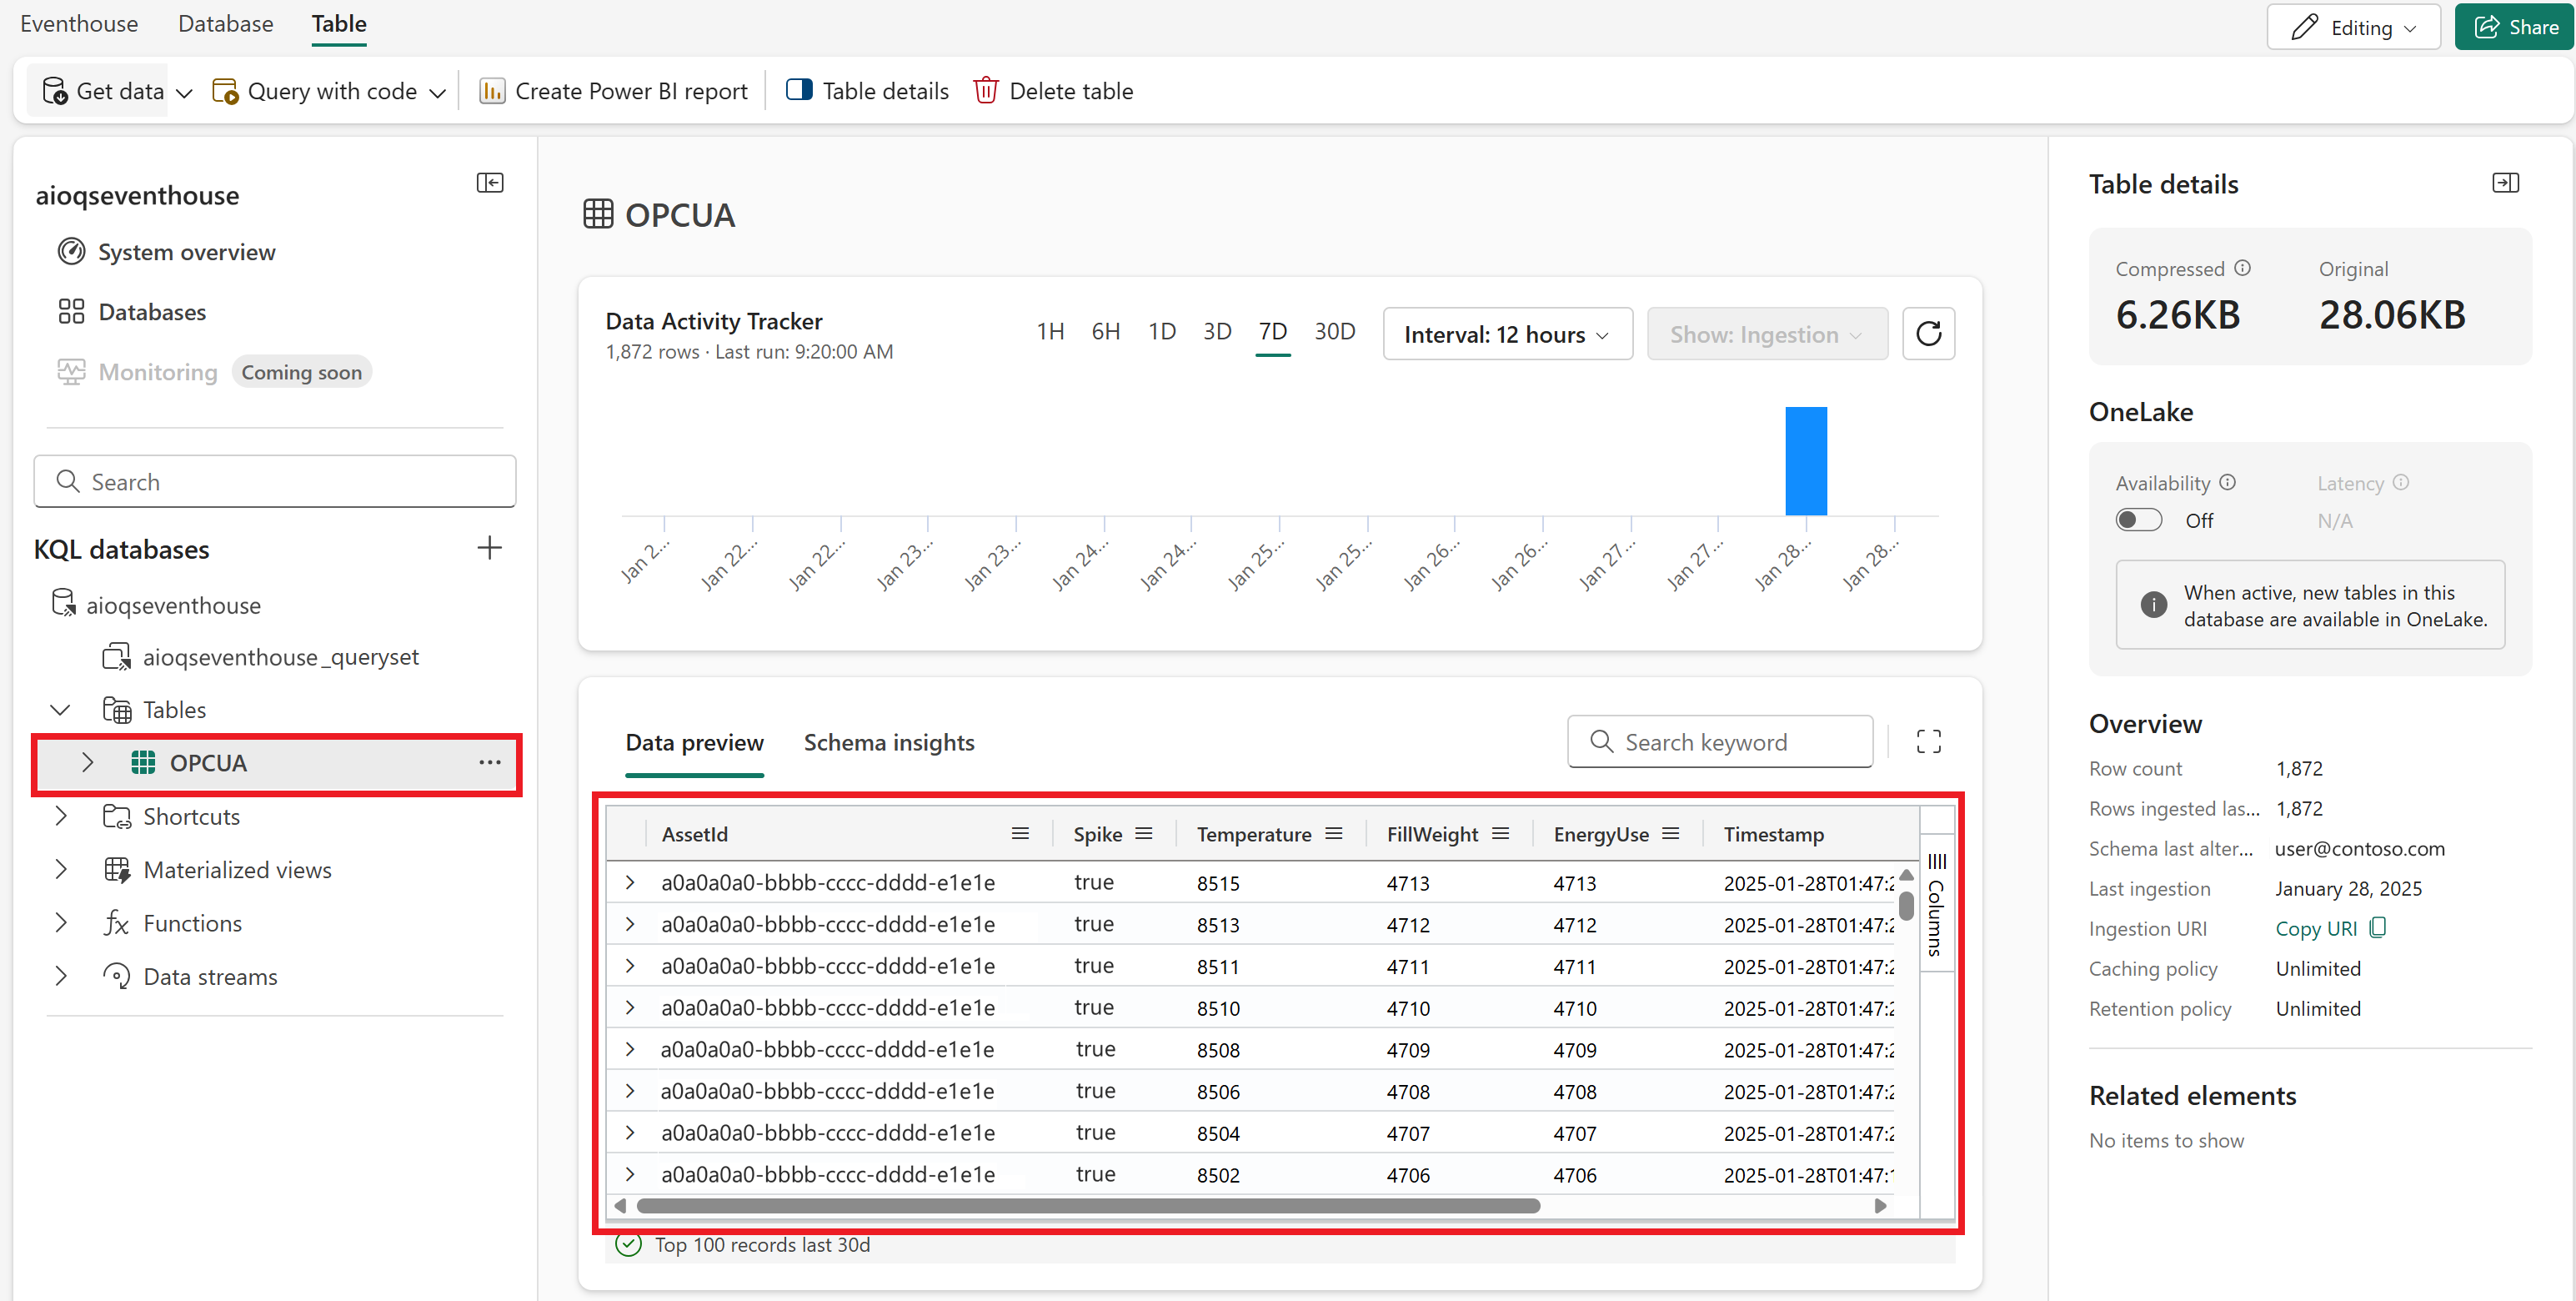
Next, create a new table in the default database in your Eventhouse (for detailed instructions, see Create an empty table in your KQL database). Name it OPCUA and manually enter the following schema.
Column name Data type AssetId string Spike bool Temperature decimal FillWeight decimal EnergyUse decimal Timestamp datetime After the OPCUA table is created, select it and use the Query with code button to open any sample query in a new query window for the table.
Clear the sample query, and run the following KQL query to create a data mapping for your table. The data mapping is called opcua_mapping.
.create table ['OPCUA'] ingestion json mapping 'opcua_mapping' '[{"column":"AssetId", "Properties":{"Path":"$[\'AssetId\']"}},{"column":"Spike", "Properties":{"Path":"$.Spike"}},{"column":"Temperature", "Properties":{"Path":"$.TemperatureF"}},{"column":"FillWeight", "Properties":{"Path":"$.FillWeight"}},{"column":"EnergyUse", "Properties":{"Path":"$.EnergyUse.Value"}},{"column":"Timestamp", "Properties":{"Path":"$[\'EventProcessedUtcTime\']"}}]'
Add eventstream data to KQL database
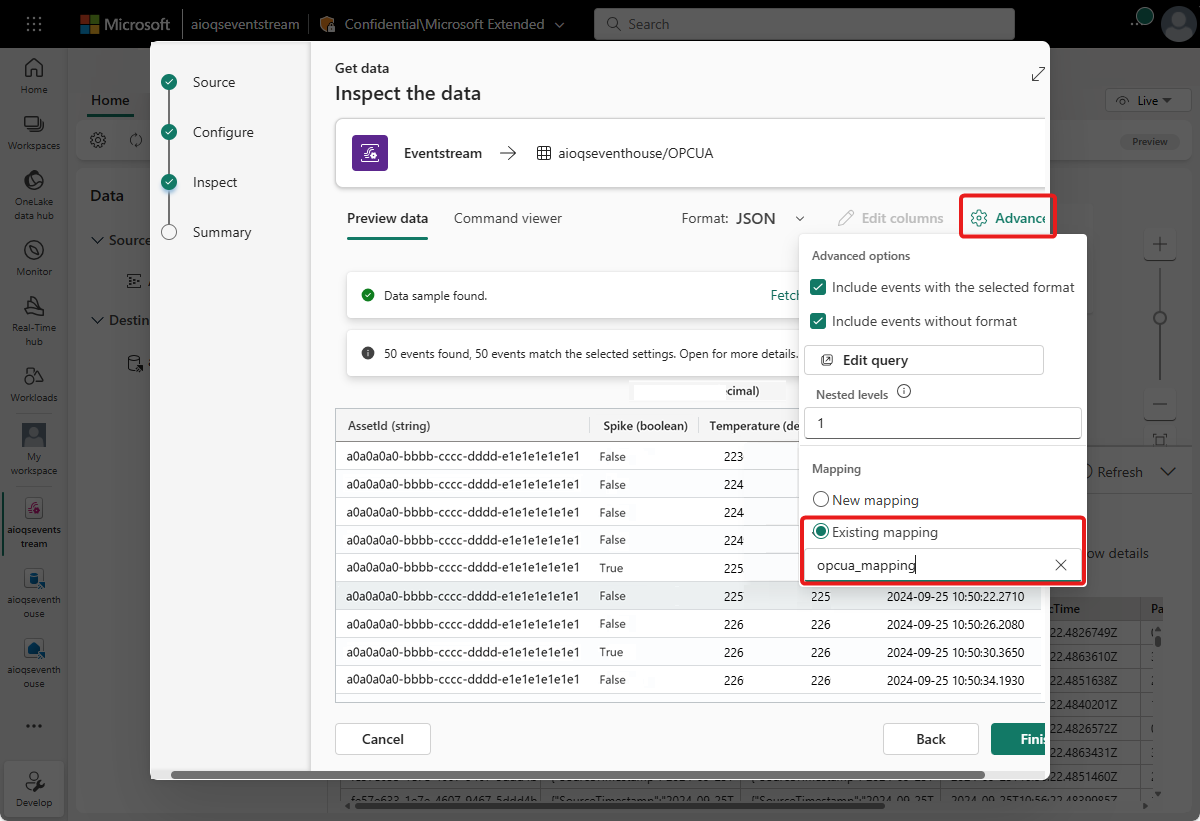
Next, add your eventstream as a data source for your KQL table (for detailed instructions, see Get data from Eventstream). As you add the data source, keep the following notes in mind:
Use the OPCUA table as the destination table and your eventstream as the source.
On the Inspect step, open the Advanced options. Under Mapping, select Existing mapping and choose opcua_mapping.
After you complete this setup, data begins to flow through your eventstream and is processed into your KQL table.
Wait a few minutes for data to propagate. Then, select the OPCUA table (you may need to refresh the view) to see a preview of the data from the eventstream appearing in the table.
You can also use the Query with code button to open a query window for the OPCUA table and run queries to explore the data.
Create a Real-Time Dashboard
In this section, you create a new Real-Time Dashboard to visualize your quickstart data, and import a set of tiles from a sample dashboard template. The dashboard allows filtering by asset ID and timestamp, and displays visual summaries of temperature, spike frequency, and other data.
Note
You can only create Real-Time Dashboards if your tenant admin has enabled the creation of Real-Time Dashboards in your Fabric tenant. For more information, see Enable tenant settings in the admin portal.
Create dashboard
Navigate to your workspace and create a new Real-Time Dashboard from the Real-Time Intelligence capabilities (for detailed instructions, see Create a new dashboard).
Upload template and connect data source
Download the sample dashboard template from this location in GitHub: dashboard-AIOquickstart.json.
Then, follow the steps below to upload the dashboard template and connect it to your data.
- In your Real-Time Dashboard, switch to the Manage tab and select Replace with file.
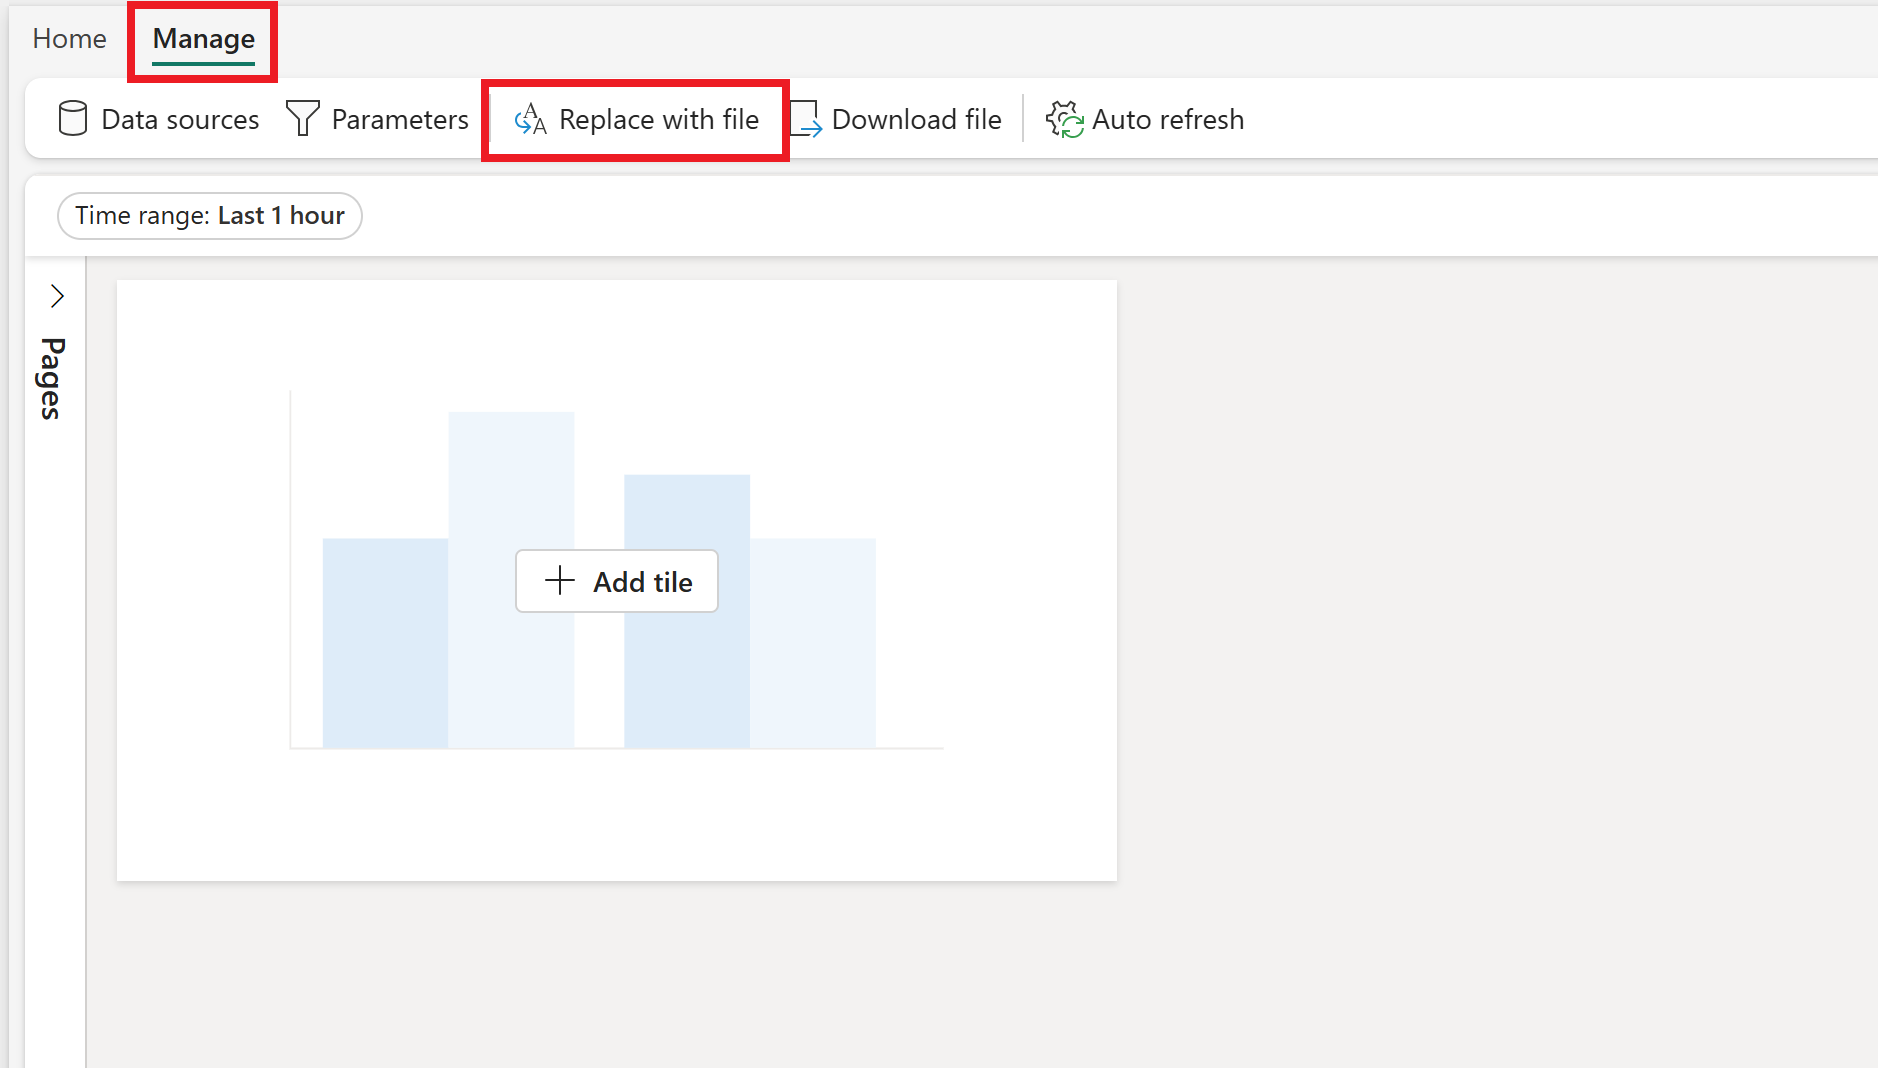
- Select the template file that you downloaded to your machine.
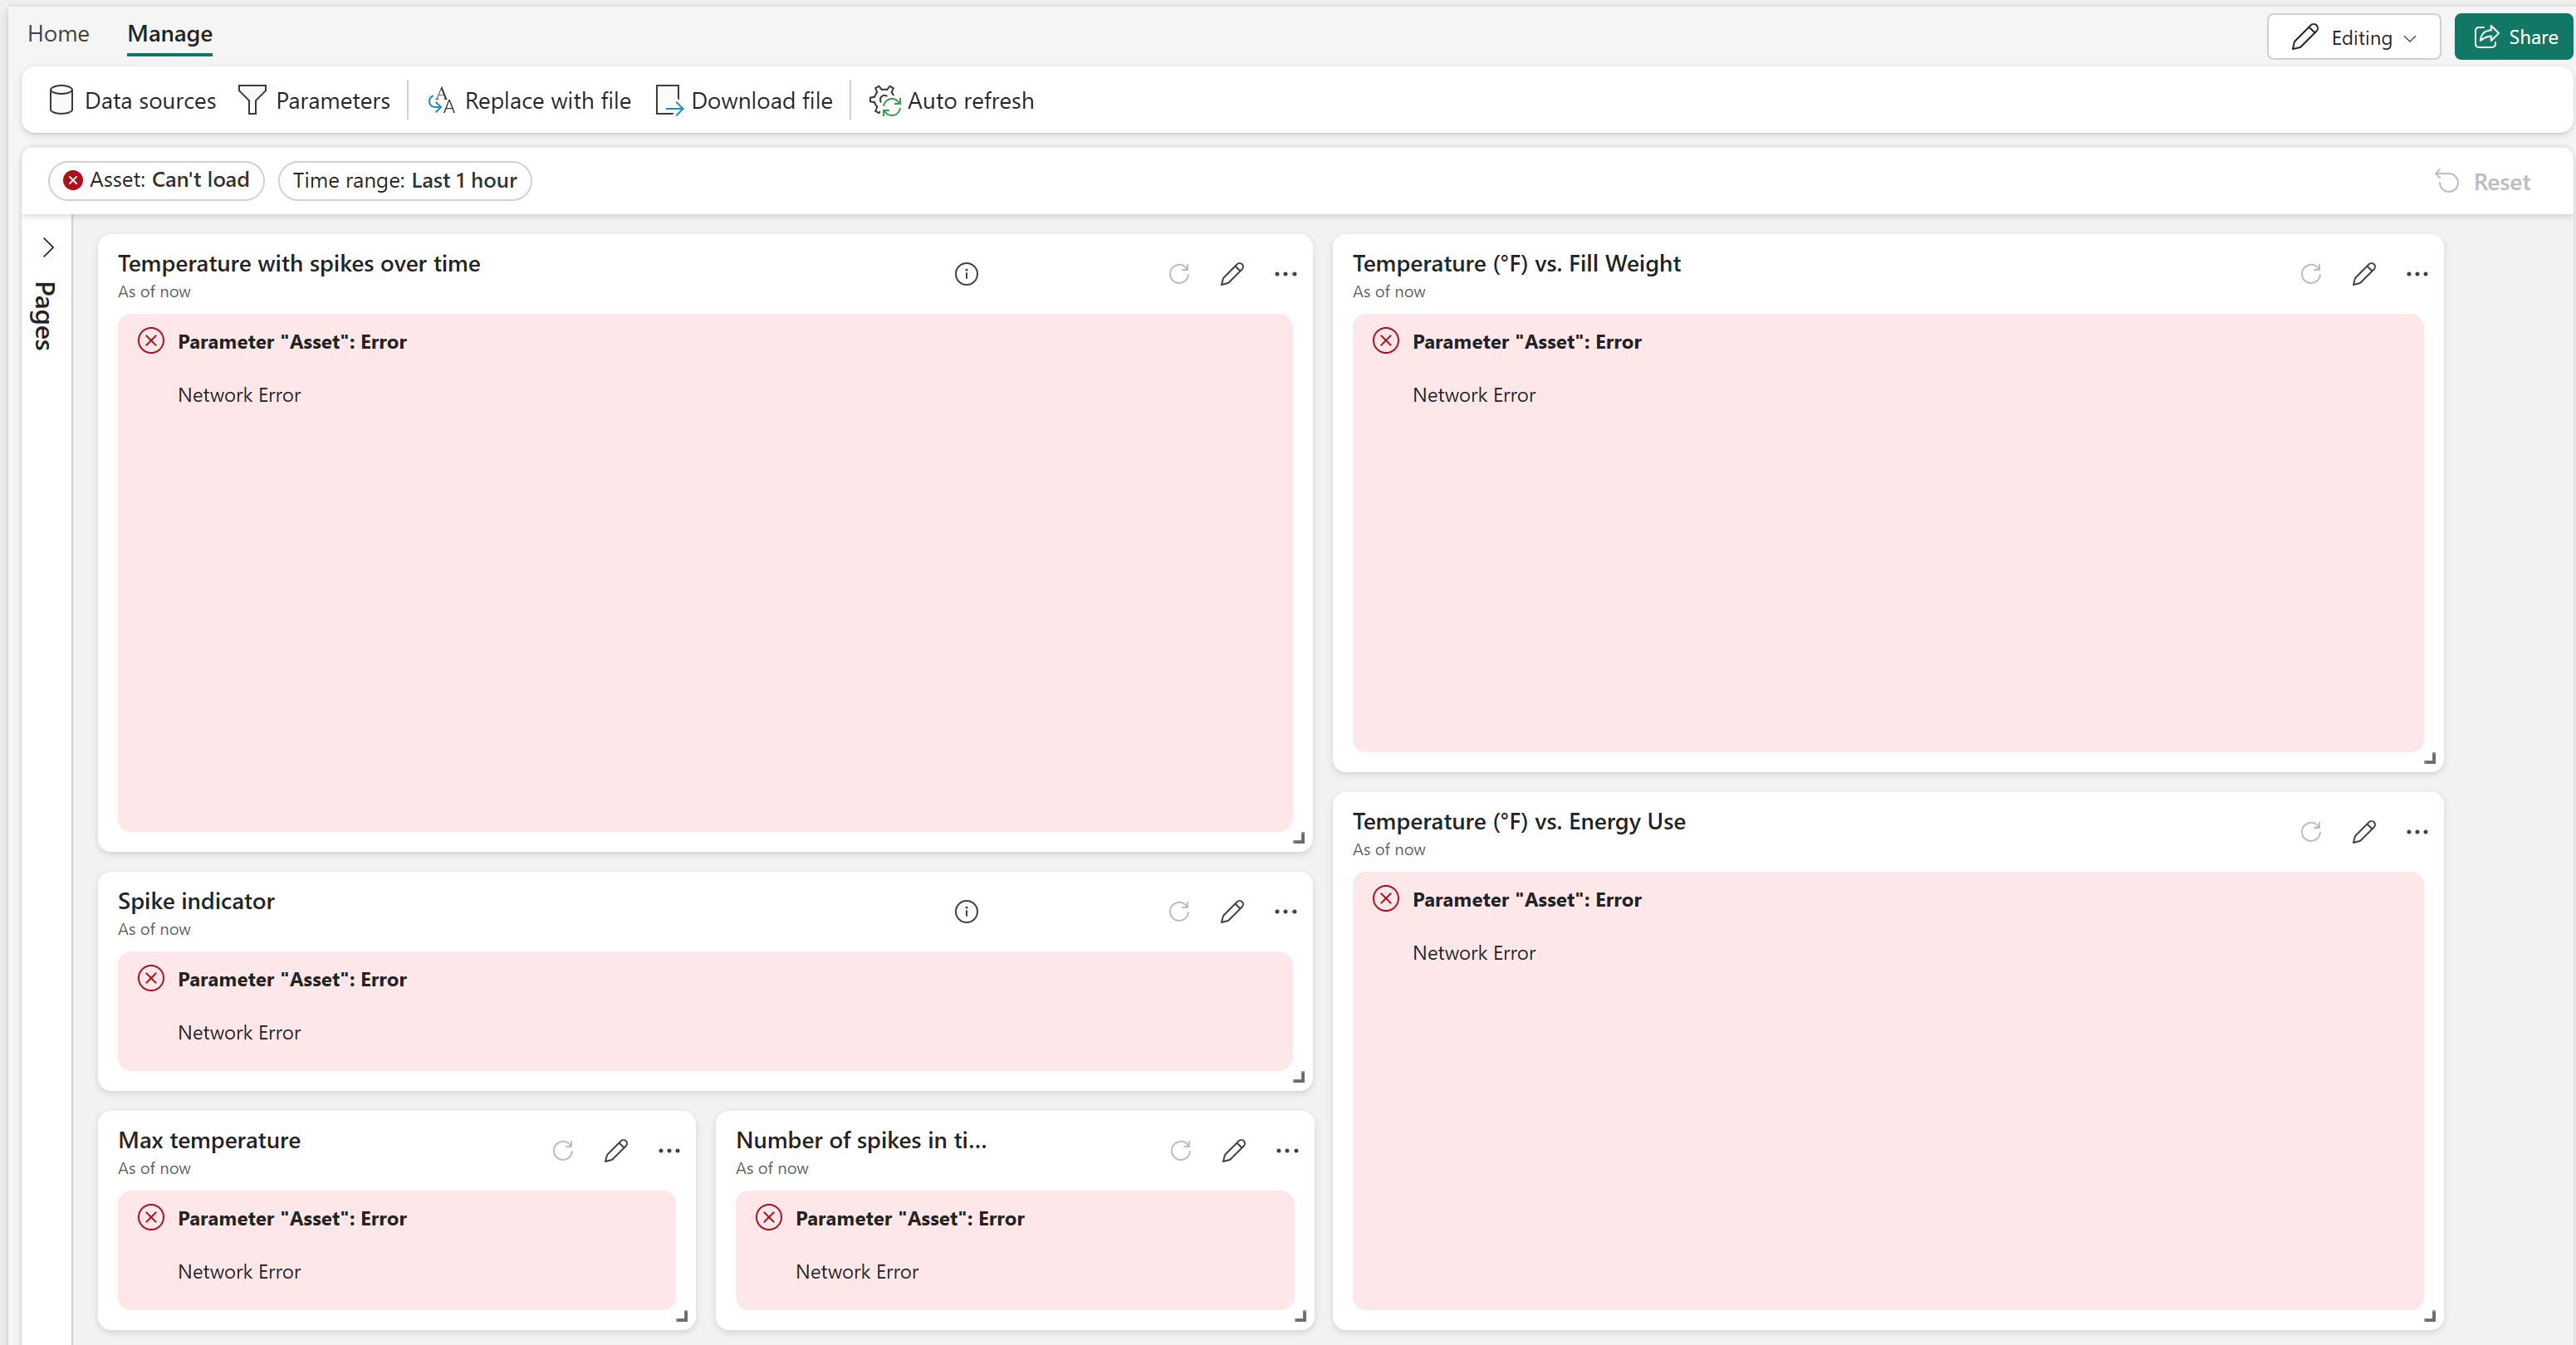
- The template file populates the dashboard with multiple tiles, although the tiles can't get data since you haven't yet connected your data source.
- From the Manage tab, select Data sources. This opens the Data sources pane with a sample source for your AIO data. Select the pencil icon to edit the AIOdata data source.
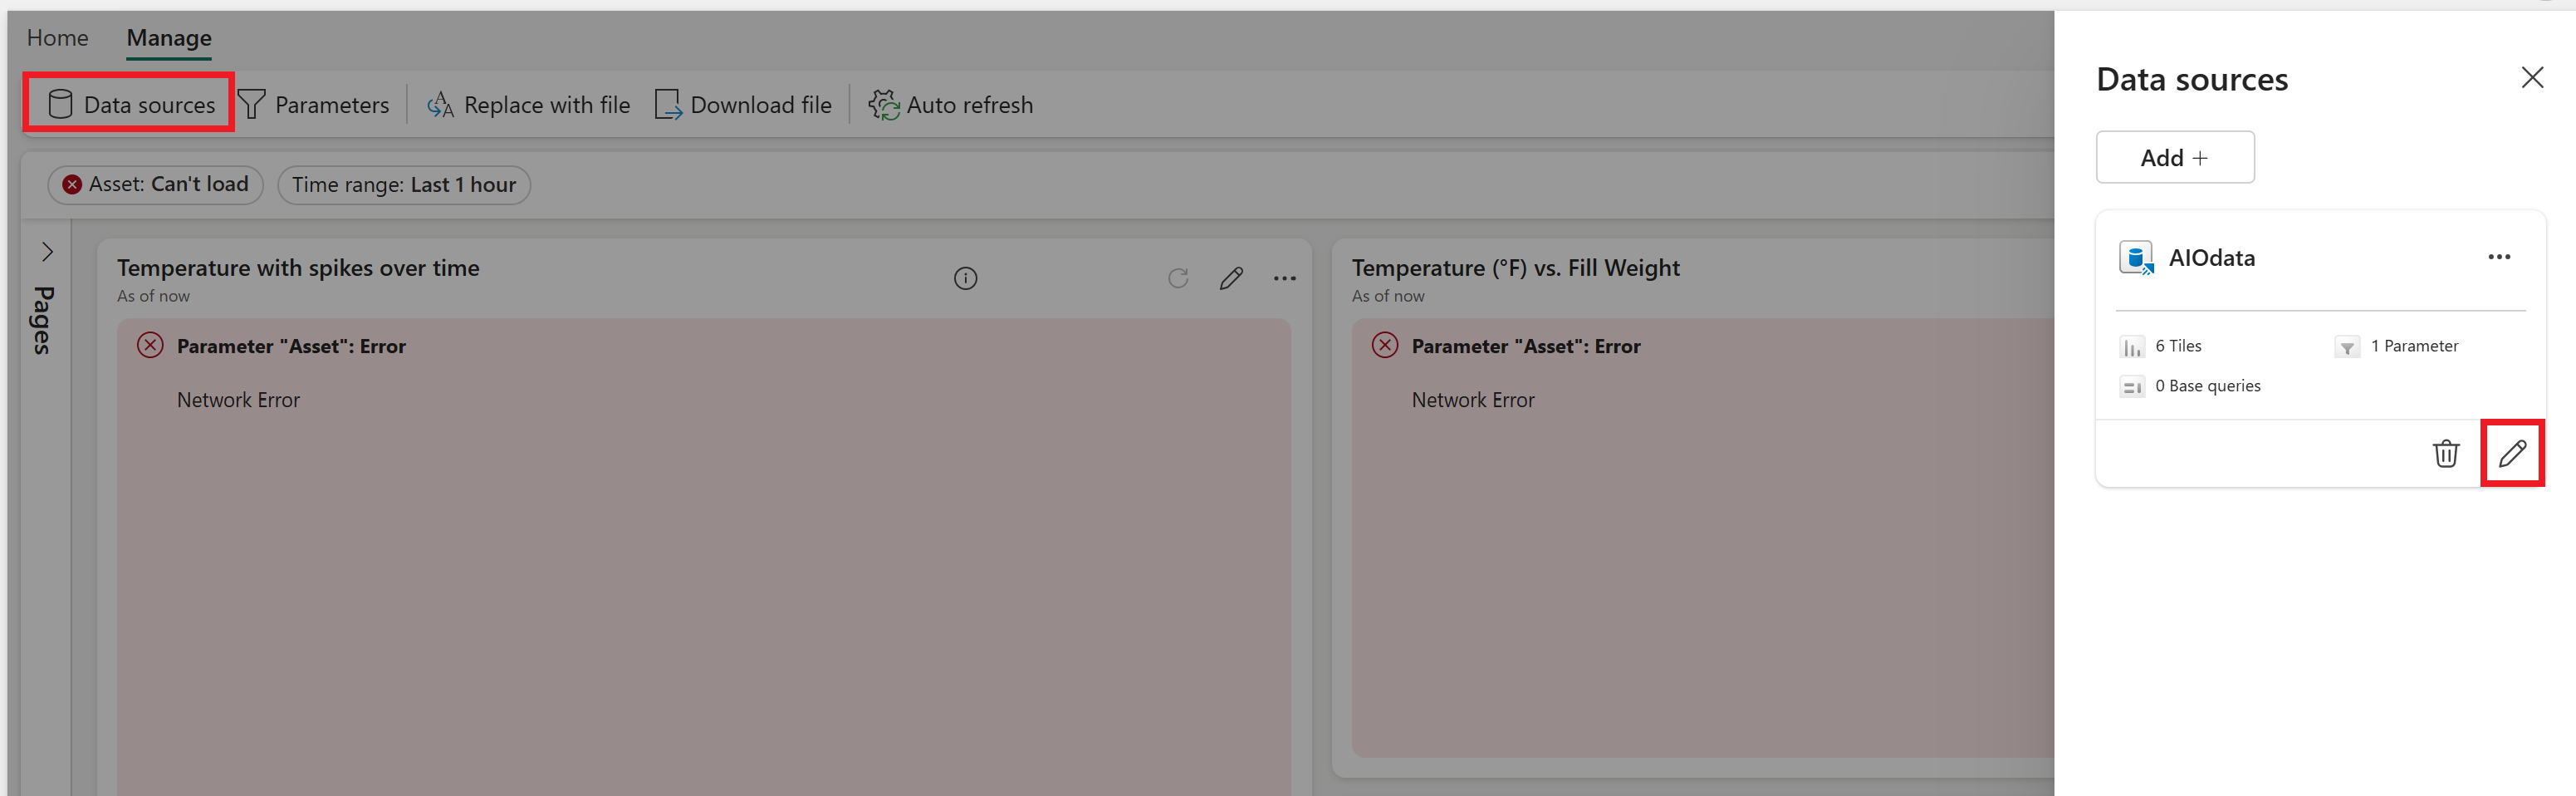
- Choose your database (it's under OneLake data hub). When you're finished connecting your data source, select Apply and close the Data sources pane.
The visuals should populate with the data from your KQL database.
On the Home tab, select Save to save your dashboard.
Explore dashboard
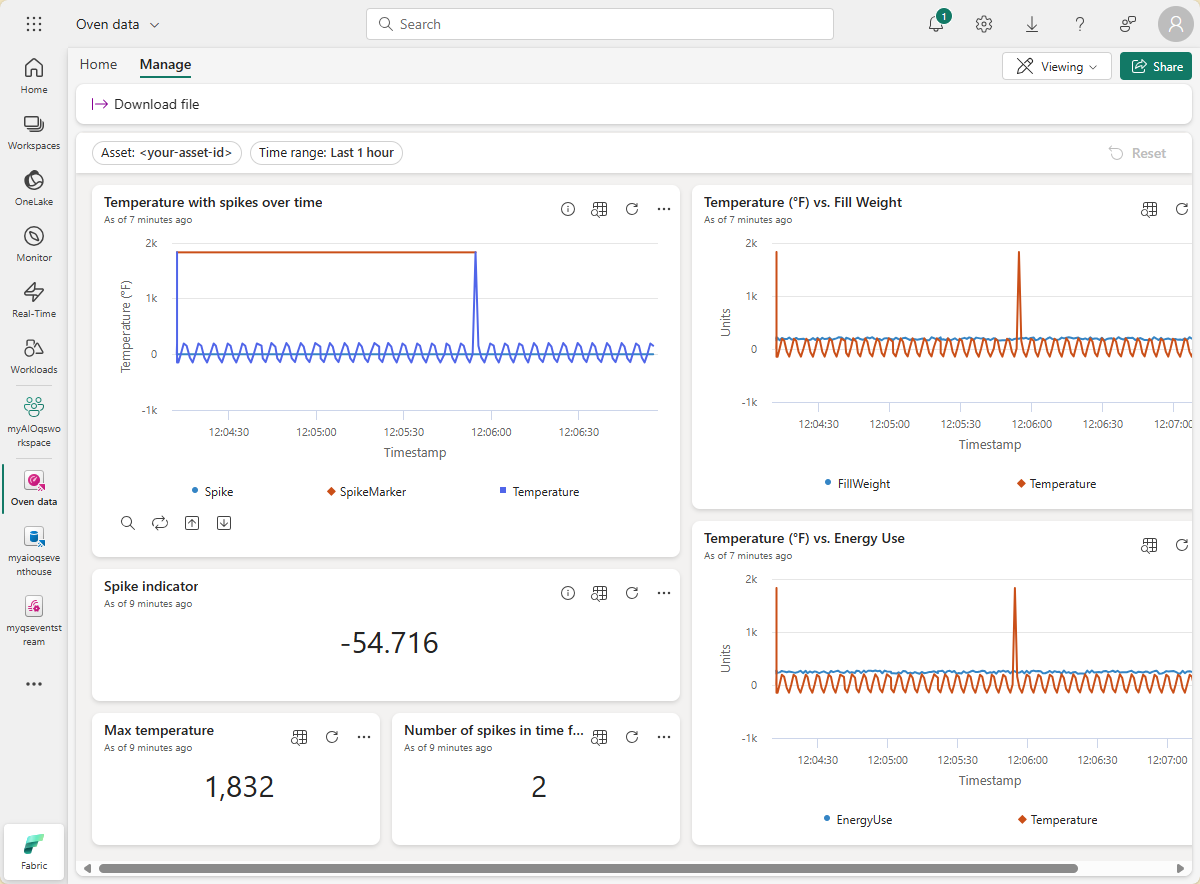
Now you have a dashboard that displays different types of visuals for the asset data in these quickstarts. Here are the visuals included with the template:
- Parameters for your dashboard that allow all visuals to be filtered by timestamp (included by default) and asset ID.
- A line chart tile showing temperature and its spikes over time.
- A stat tile showing a real-time spike indicator for temperature. The tile displays the most recent temperature value, and if that value is a spike, conditional formatting displays it as a warning.
- A stat tile showing max temperature.
- A stat tile showing the number of spikes in the selected time frame.
- A line chart tile showing temperature versus fill weight over time.
- A line chart tile showing temperature versus energy use over time.
From here, you can experiment with the filters and adding other tile types to see how a dashboard can enable you to do more with your data.
This completes the final step in the quickstart flow for using Azure IoT Operations to manage device data from deployment through analysis in the cloud.
Clean up resources
Now that you're finished with the quickstart experience, this section contains instructions to delete your sample resources.
If you want to remove the Azure IoT Operations deployment but keep your cluster, use the az iot ops delete command:
az iot ops delete --cluster $CLUSTER_NAME --resource-group $RESOURCE_GROUP
If you want to delete all the resources you created for this quickstart, delete the Kubernetes cluster where you deployed Azure IoT Operations and then remove the Azure resource group that contained the cluster.
If you used Codespaces for these quickstarts, delete your Codespace from GitHub.
Note
The resource group contains the Event Hubs namespace you created in this quickstart.
You can also delete your Microsoft Fabric workspace and/or all the resources within it associated with this quickstart, including the eventstream, Eventhouse, and Real-Time Dashboard. Additionally, you might want to delete the dashboard template file that you downloaded to your computer.