Monitor Azure Firewall
This article describes:
- The types of monitoring data you can collect for this service.
- Ways to analyze that data.
Note
If you're already familiar with this service and/or Azure Monitor and just want to know how to analyze monitoring data, see the Analyze section near the end of this article.
When you have critical applications and business processes that rely on Azure resources, you need to monitor and get alerts for your system. The Azure Monitor service collects and aggregates metrics and logs from every component of your system. Azure Monitor provides you with a view of availability, performance, and resilience, and notifies you of issues. You can use the Azure portal, PowerShell, Azure CLI, REST API, or client libraries to set up and view monitoring data.
- For more information on Azure Monitor, see the Azure Monitor overview.
- For more information on how to monitor Azure resources in general, see Monitor Azure resources with Azure Monitor.
You can use Azure Firewall logs and metrics to monitor your traffic and operations within the firewall. These logs and metrics serve several essential purposes, including:
Traffic Analysis: Use logs to examine and analyze the traffic passing through the firewall. This analysis includes examining permitted and denied traffic, inspecting source and destination IP addresses, URLs, port numbers, protocols, and more. These insights are essential for understanding traffic patterns, identifying potential security threats, and troubleshooting connectivity issues.
Performance and Health Metrics: Azure Firewall metrics provide performance and health metrics, such as data processed, throughput, rule hit count, and latency. Monitor these metrics to assess the overall health of your firewall, identify performance bottlenecks, and detect any anomalies.
Audit Trail: Activity logs enable auditing of operations related to firewall resources, capturing actions like creating, updating, or deleting firewall rules and policies. Reviewing activity logs helps maintain a historical record of configuration changes and ensures compliance with security and auditing requirements.
Resource types
Azure uses the concept of resource types and IDs to identify everything in a subscription. Resource types are also part of the resource IDs for every resource running in Azure. For example, one resource type for a virtual machine is Microsoft.Compute/virtualMachines. For a list of services and their associated resource types, see Resource providers.
Azure Monitor similarly organizes core monitoring data into metrics and logs based on resource types, also called namespaces. Different metrics and logs are available for different resource types. Your service might be associated with more than one resource type.
For more information about the resource types for Azure Firewall, see Azure Firewall monitoring data reference.
Data storage
For Azure Monitor:
- Metrics data is stored in the Azure Monitor metrics database.
- Log data is stored in the Azure Monitor logs store. Log Analytics is a tool in the Azure portal that can query this store.
- The Azure activity log is a separate store with its own interface in the Azure portal.
You can optionally route metric and activity log data to the Azure Monitor logs store. You can then use Log Analytics to query the data and correlate it with other log data.
Many services can use diagnostic settings to send metric and log data to other storage locations outside Azure Monitor. Examples include Azure Storage, hosted partner systems, and non-Azure partner systems, by using Event Hubs.
For detailed information on how Azure Monitor stores data, see Azure Monitor data platform.
Azure Monitor platform metrics
Azure Monitor provides platform metrics for most services. These metrics are:
- Individually defined for each namespace.
- Stored in the Azure Monitor time-series metrics database.
- Lightweight and capable of supporting near real-time alerting.
- Used to track the performance of a resource over time.
Collection: Azure Monitor collects platform metrics automatically. No configuration is required.
Routing: You can also route some platform metrics to Azure Monitor Logs / Log Analytics so you can query them with other log data. Check the DS export setting for each metric to see if you can use a diagnostic setting to route the metric to Azure Monitor Logs / Log Analytics.
- For more information, see the Metrics diagnostic setting.
- To configure diagnostic settings for a service, see Create diagnostic settings in Azure Monitor.
For a list of all metrics it's possible to gather for all resources in Azure Monitor, see Supported metrics in Azure Monitor.
For a list of available metrics for Azure Firewall, see Azure Firewall monitoring data reference.
Azure Monitor resource logs
Resource logs provide insight into operations that were done by an Azure resource. Logs are generated automatically, but you must route them to Azure Monitor logs to save or query them. Logs are organized in categories. A given namespace might have multiple resource log categories.
Collection: Resource logs aren't collected and stored until you create a diagnostic setting and route the logs to one or more locations. When you create a diagnostic setting, you specify which categories of logs to collect. There are multiple ways to create and maintain diagnostic settings, including the Azure portal, programmatically, and though Azure Policy.
Routing: The suggested default is to route resource logs to Azure Monitor Logs so you can query them with other log data. Other locations such as Azure Storage, Azure Event Hubs, and certain Microsoft monitoring partners are also available. For more information, see Azure resource logs and Resource log destinations.
For detailed information about collecting, storing, and routing resource logs, see Diagnostic settings in Azure Monitor.
For a list of all available resource log categories in Azure Monitor, see Supported resource logs in Azure Monitor.
All resource logs in Azure Monitor have the same header fields, followed by service-specific fields. The common schema is outlined in Azure Monitor resource log schema.
For the available resource log categories, their associated Log Analytics tables, and the log schemas for Azure Firewall, see Azure Firewall monitoring data reference.
Azure Firewall Workbook provides a flexible canvas for Azure Firewall data analysis. You can use it to create rich visual reports within the Azure portal. You can tap into multiple Firewalls deployed across Azure, and combine them into unified interactive experiences.
You can also connect to your storage account and retrieve the JSON log entries for access and performance logs. After you download the JSON files, you can convert them to CSV and view them in Excel, Power BI, or any other data-visualization tool.
Tip
If you are familiar with Visual Studio and basic concepts of changing values for constants and variables in C#, you can use the log converter tools available from GitHub.
Azure activity log
The activity log contains subscription-level events that track operations for each Azure resource as seen from outside that resource; for example, creating a new resource or starting a virtual machine.
Collection: Activity log events are automatically generated and collected in a separate store for viewing in the Azure portal.
Routing: You can send activity log data to Azure Monitor Logs so you can analyze it alongside other log data. Other locations such as Azure Storage, Azure Event Hubs, and certain Microsoft monitoring partners are also available. For more information on how to route the activity log, see Overview of the Azure activity log.
Change tracking (Preview)
Azure Resource Graph (ARG) is an Azure service designed to provide efficient and performant resource exploration at scale. Azure Resource Graph (ARG) provides change analysis data for various management and troubleshooting scenarios. Users can find when changes were detected on an Azure Resource Manager (ARM) property, view property change details and query changes at scale across their subscription, management group, or tenant.
ARG change analysis recently added support for RuleCollectionGroups. You can now track changes to Azure Firewall Rule Collection Groups using an Azure Resource Graph query from the Azure Portal ResourceGraphExplorer page using a query like this:

Below is a sample change output.
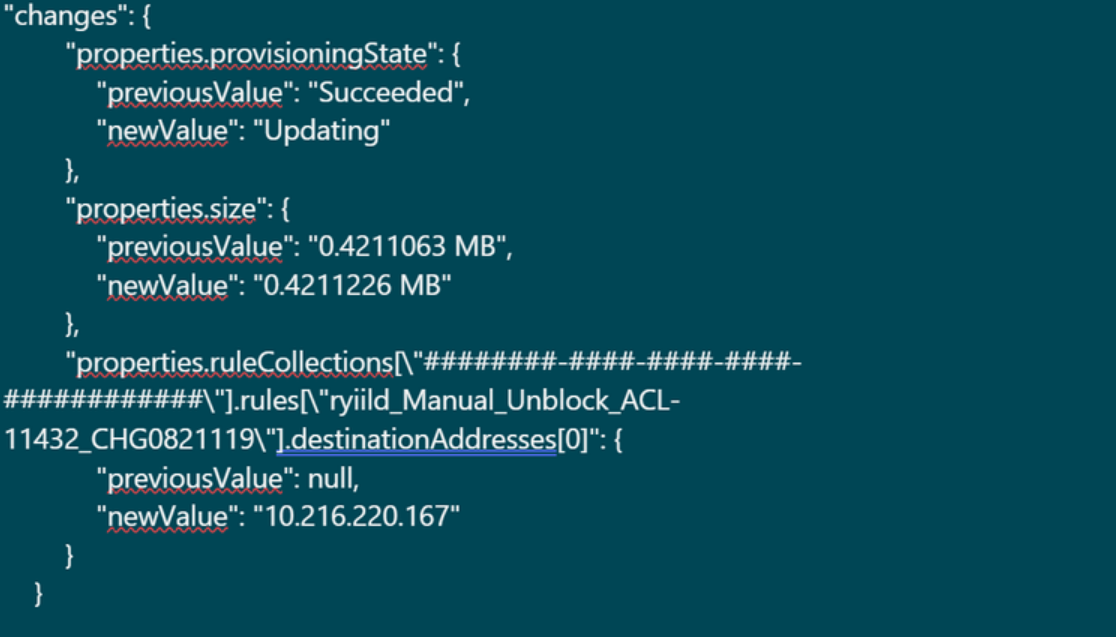
This capability can help you track changes made to your firewall rules helping ensure accountability for a sensitive resource like a firewall.
Structured Azure Firewall logs
Structured logs are a type of log data that are organized in a specific format. They use a predefined schema to structure log data in a way that makes it easy to search, filter, and analyze. Unlike unstructured logs, which consist of free-form text, structured logs have a consistent format that machines can parse and analyze.
Azure Firewall's structured logs provide a more detailed view of firewall events. They include information such as source and destination IP addresses, protocols, port numbers, and action taken by the firewall. They also include more metadata, such as the time of the event and the name of the Azure Firewall instance.
Currently, the following diagnostic log categories are available for Azure Firewall:
- Application rule log
- Network rule log
- DNS proxy log
These log categories use Azure diagnostics mode. In this mode, all data from any diagnostic setting is collected in the AzureDiagnostics table.
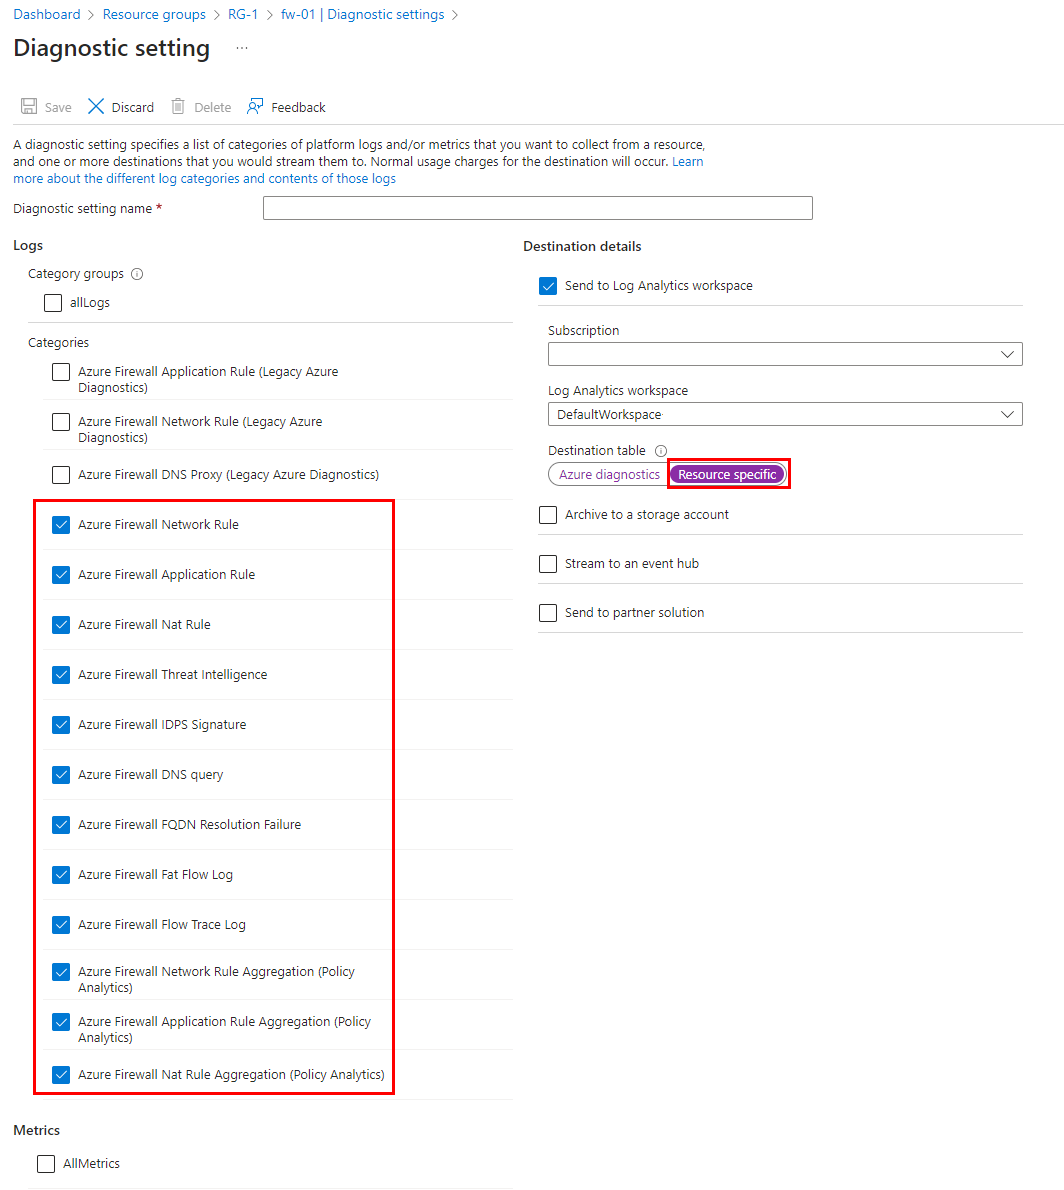
With structured logs, you're able to choose to use Resource Specific Tables instead of the existing AzureDiagnostics table. In case both sets of logs are required, at least two diagnostic settings need to be created per firewall.
Resource specific mode
In Resource specific mode, individual tables in the selected workspace are created for each category selected in the diagnostic setting. This method is recommended since it:
- might reduce overall logging costs by up to 80%.
- makes it much easier to work with the data in log queries.
- makes it easier to discover schemas and their structure.
- improves performance across both ingestion latency and query times.
- allows you to grant Azure RBAC rights on a specific table.
New resource specific tables are now available in Diagnostic setting that allows you to utilize the following categories:
- Network rule log - Contains all Network Rule log data. Each match between data plane and network rule creates a log entry with the data plane packet and the matched rule's attributes.
- NAT rule log - Contains all DNAT (Destination Network Address Translation) events log data. Each match between data plane and DNAT rule creates a log entry with the data plane packet and the matched rule's attributes. Asa note, the AZFWNATRule table logs only when a DNAT rule match occurs. If there is no match, no log is generated.
- Application rule log - Contains all Application rule log data. Each match between data plane and Application rule creates a log entry with the data plane packet and the matched rule's attributes.
- Threat Intelligence log - Contains all Threat Intelligence events.
- IDPS log - Contains all data plane packets that were matched with one or more IDPS signatures.
- DNS proxy log - Contains all DNS Proxy events log data.
- Internal FQDN resolve failure log - Contains all internal Firewall FQDN resolution requests that resulted in failure.
- Application rule aggregation log - Contains aggregated Application rule log data for Policy Analytics.
- Network rule aggregation log - Contains aggregated Network rule log data for Policy Analytics.
- NAT rule aggregation log - Contains aggregated NAT rule log data for Policy Analytics.
- Top flow log - The Top Flows (Fat Flows) log shows the top connections that are contributing to the highest throughput through the firewall.
- Flow trace - Contains flow information, flags, and the time period when the flows were recorded. You can see full flow information such as SYN, SYN-ACK, FIN, FIN-ACK, RST, INVALID (flows).
Enable structured logs
To enable Azure Firewall structured logs, you must first configure a Log Analytics workspace in your Azure subscription. This workspace is used to store the structured logs generated by Azure Firewall.
Once you configure the Log Analytics workspace, you can enable structured logs in Azure Firewall by navigating to the Firewall's Diagnostic settings page in the Azure portal. From there, you must select the Resource specific destination table and select the type of events you want to log.
Note
There's no requirement to enable this feature with a feature flag or Azure PowerShell commands.
Structured log queries
A list of predefined queries is available in the Azure portal. This list has a predefined KQL (Kusto Query Language) log query for each category and joined query showing the entire Azure firewall logging events in single view.

Azure Firewall Workbook
Azure Firewall Workbook provides a flexible canvas for Azure Firewall data analysis. You can use it to create rich visual reports within the Azure portal. You can tap into multiple firewalls deployed across Azure and combine them into unified interactive experiences.
To deploy the new workbook that uses Azure Firewall Structured Logs, see Azure Monitor Workbook for Azure Firewall.
Legacy Azure Diagnostics logs
Legacy Azure Diagnostic logs are the original Azure Firewall log queries that output log data in an unstructured or free-form text format. The Azure Firewall legacy log categories use Azure diagnostics mode, collecting entire data in the AzureDiagnostics table. In case both Structured and Diagnostic logs are required, at least two diagnostic settings need to be created per firewall.
The following log categories are supported in Diagnostic logs:
- Azure Firewall application rule
- Azure Firewall network rule
- Azure Firewall DNS proxy
To learn how to enable the diagnostic logging using the Azure portal, see Enable structured logs.
Application rule log
The Application rule log is saved to a storage account, streamed to Event hubs and/or sent to Azure Monitor logs only if you enable it for each Azure Firewall. Each new connection that matches one of your configured application rules results in a log for the accepted/denied connection. The data is logged in JSON format, as shown in the following examples:
Category: application rule logs.
Time: log timestamp.
Properties: currently contains the full message.
note: this field will be parsed to specific fields in the future, while maintaining backward compatibility with the existing properties field.
{
 "category": "AzureFirewallApplicationRule",
 "time": "2018-04-16T23:45:04.8295030Z",
 "resourceId": "/SUBSCRIPTIONS/{subscriptionId}/RESOURCEGROUPS/{resourceGroupName}/PROVIDERS/MICROSOFT.NETWORK/AZUREFIREWALLS/{resourceName}",
 "operationName": "AzureFirewallApplicationRuleLog",
 "properties": {
     "msg": "HTTPS request from 10.1.0.5:55640 to mydestination.com:443. Action: Allow. Rule Collection: collection1000. Rule: rule1002"
 }
}
{
  "category": "AzureFirewallApplicationRule",
  "time": "2018-04-16T23:45:04.8295030Z",
  "resourceId": "/SUBSCRIPTIONS/{subscriptionId}/RESOURCEGROUPS/{resourceGroupName}/PROVIDERS/MICROSOFT.NETWORK/AZUREFIREWALLS/{resourceName}",
  "operationName": "AzureFirewallApplicationRuleLog",
  "properties": {
      "msg": "HTTPS request from 10.11.2.4:53344 to www.bing.com:443. Action: Allow. Rule Collection: ExampleRuleCollection. Rule: ExampleRule. Web Category: SearchEnginesAndPortals"
  }
}
Network rule log
The Network rule log is saved to a storage account, streamed to Event hubs and/or sent to Azure Monitor logs only if you enable it for each Azure Firewall. Each new connection that matches one of your configured network rules results in a log for the accepted/denied connection. The data is logged in JSON format, as shown in the following example:
Category: network rule logs.
Time: log timestamp.
Properties: currently contains the full message.
note: this field will be parsed to specific fields in the future, while maintaining backward compatibility with the existing properties field.
{
 "category": "AzureFirewallNetworkRule",
 "time": "2018-06-14T23:44:11.0590400Z",
 "resourceId": "/SUBSCRIPTIONS/{subscriptionId}/RESOURCEGROUPS/{resourceGroupName}/PROVIDERS/MICROSOFT.NETWORK/AZUREFIREWALLS/{resourceName}",
 "operationName": "AzureFirewallNetworkRuleLog",
 "properties": {
     "msg": "TCP request from 111.35.136.173:12518 to 13.78.143.217:2323. Action: Deny"
 }
}
DNS proxy log
The DNS proxy log is saved to a storage account, streamed to Event hubs, and/or sent to Azure Monitor logs only if you enable it for each Azure Firewall. This log tracks DNS messages to a DNS server configured using DNS proxy. The data is logged in JSON format, as shown in the following examples:
Category: DNS proxy logs.
Time: log timestamp.
Properties: currently contains the full message.
note: this field will be parsed to specific fields in the future, while maintaining backward compatibility with the existing properties field.
Success:
{
  "category": "AzureFirewallDnsProxy",
  "time": "2020-09-02T19:12:33.751Z",
  "resourceId": "/SUBSCRIPTIONS/{subscriptionId}/RESOURCEGROUPS/{resourceGroupName}/PROVIDERS/MICROSOFT.NETWORK/AZUREFIREWALLS/{resourceName}",
  "operationName": "AzureFirewallDnsProxyLog",
  "properties": {
      "msg": "DNS Request: 11.5.0.7:48197 – 15676 AAA IN md-l1l1pg5lcmkq.blob.core.windows.net. udp 55 false 512 NOERROR - 0 2.000301956s"
  }
}
Failed:
{
  "category": "AzureFirewallDnsProxy",
  "time": "2020-09-02T19:12:33.751Z",
  "resourceId": "/SUBSCRIPTIONS/{subscriptionId}/RESOURCEGROUPS/{resourceGroupName}/PROVIDERS/MICROSOFT.NETWORK/AZUREFIREWALLS/{resourceName}",
  "operationName": "AzureFirewallDnsProxyLog",
  "properties": {
      "msg": " Error: 2 time.windows.com.reddog.microsoft.com. A: read udp 10.0.1.5:49126->168.63.129.160:53: i/o timeout”
  }
}
Message format:
[client’s IP address]:[client’s port] – [query ID] [type of the request] [class of the request] [name of the request] [protocol used] [request size in bytes] [EDNS0 DO (DNSSEC OK) bit set in the query] [EDNS0 buffer size advertised in the query] [response CODE] [response flags] [response size] [response duration]
Analyze monitoring data
There are many tools for analyzing monitoring data.
Azure Monitor tools
Azure Monitor supports the following basic tools:
Metrics explorer, a tool in the Azure portal that allows you to view and analyze metrics for Azure resources. For more information, see Analyze metrics with Azure Monitor metrics explorer.
Log Analytics, a tool in the Azure portal that allows you to query and analyze log data by using the Kusto query language (KQL). For more information, see Get started with log queries in Azure Monitor.
The activity log, which has a user interface in the Azure portal for viewing and basic searches. To do more in-depth analysis, you have to route the data to Azure Monitor logs and run more complex queries in Log Analytics.
Tools that allow more complex visualization include:
- Dashboards that let you combine different kinds of data into a single pane in the Azure portal.
- Workbooks, customizable reports that you can create in the Azure portal. Workbooks can include text, metrics, and log queries.
- Grafana, an open platform tool that excels in operational dashboards. You can use Grafana to create dashboards that include data from multiple sources other than Azure Monitor.
- Power BI, a business analytics service that provides interactive visualizations across various data sources. You can configure Power BI to automatically import log data from Azure Monitor to take advantage of these visualizations.
Azure Monitor export tools
You can get data out of Azure Monitor into other tools by using the following methods:
Metrics: Use the REST API for metrics to extract metric data from the Azure Monitor metrics database. The API supports filter expressions to refine the data retrieved. For more information, see Azure Monitor REST API reference.
Logs: Use the REST API or the associated client libraries.
Another option is the workspace data export.
To get started with the REST API for Azure Monitor, see Azure monitoring REST API walkthrough.
Kusto queries
You can analyze monitoring data in the Azure Monitor Logs / Log Analytics store by using the Kusto query language (KQL).
Important
When you select Logs from the service's menu in the portal, Log Analytics opens with the query scope set to the current service. This scope means that log queries will only include data from that type of resource. If you want to run a query that includes data from other Azure services, select Logs from the Azure Monitor menu. See Log query scope and time range in Azure Monitor Log Analytics for details.
For a list of common queries for any service, see the Log Analytics queries interface.
Alerts
Azure Monitor alerts proactively notify you when specific conditions are found in your monitoring data. Alerts allow you to identify and address issues in your system before your customers notice them. For more information, see Azure Monitor alerts.
There are many sources of common alerts for Azure resources. For examples of common alerts for Azure resources, see Sample log alert queries. The Azure Monitor Baseline Alerts (AMBA) site provides a semi-automated method of implementing important platform metric alerts, dashboards, and guidelines. The site applies to a continually expanding subset of Azure services, including all services that are part of the Azure Landing Zone (ALZ).
The common alert schema standardizes the consumption of Azure Monitor alert notifications. For more information, see Common alert schema.
Types of alerts
You can alert on any metric or log data source in the Azure Monitor data platform. There are many different types of alerts depending on the services you're monitoring and the monitoring data you're collecting. Different types of alerts have various benefits and drawbacks. For more information, see Choose the right monitoring alert type.
The following list describes the types of Azure Monitor alerts you can create:
- Metric alerts evaluate resource metrics at regular intervals. Metrics can be platform metrics, custom metrics, logs from Azure Monitor converted to metrics, or Application Insights metrics. Metric alerts can also apply multiple conditions and dynamic thresholds.
- Log alerts allow users to use a Log Analytics query to evaluate resource logs at a predefined frequency.
- Activity log alerts trigger when a new activity log event occurs that matches defined conditions. Resource Health alerts and Service Health alerts are activity log alerts that report on your service and resource health.
Some Azure services also support smart detection alerts, Prometheus alerts, or recommended alert rules.
For some services, you can monitor at scale by applying the same metric alert rule to multiple resources of the same type that exist in the same Azure region. Individual notifications are sent for each monitored resource. For supported Azure services and clouds, see Monitor multiple resources with one alert rule.
Alert on Azure Firewall metrics
Metrics provide critical signals to track your resource health. So, it’s important to monitor metrics for your resource and watch out for any anomalies. But what if the Azure Firewall metrics stop flowing? It could indicate a potential configuration issue or something more ominous like an outage. Missing metrics can happen because of publishing default routes that block Azure Firewall from uploading metrics, or the number of healthy instances going down to zero. In this section, you learn how to configure metrics to a log analytics workspace and to alert on missing metrics.
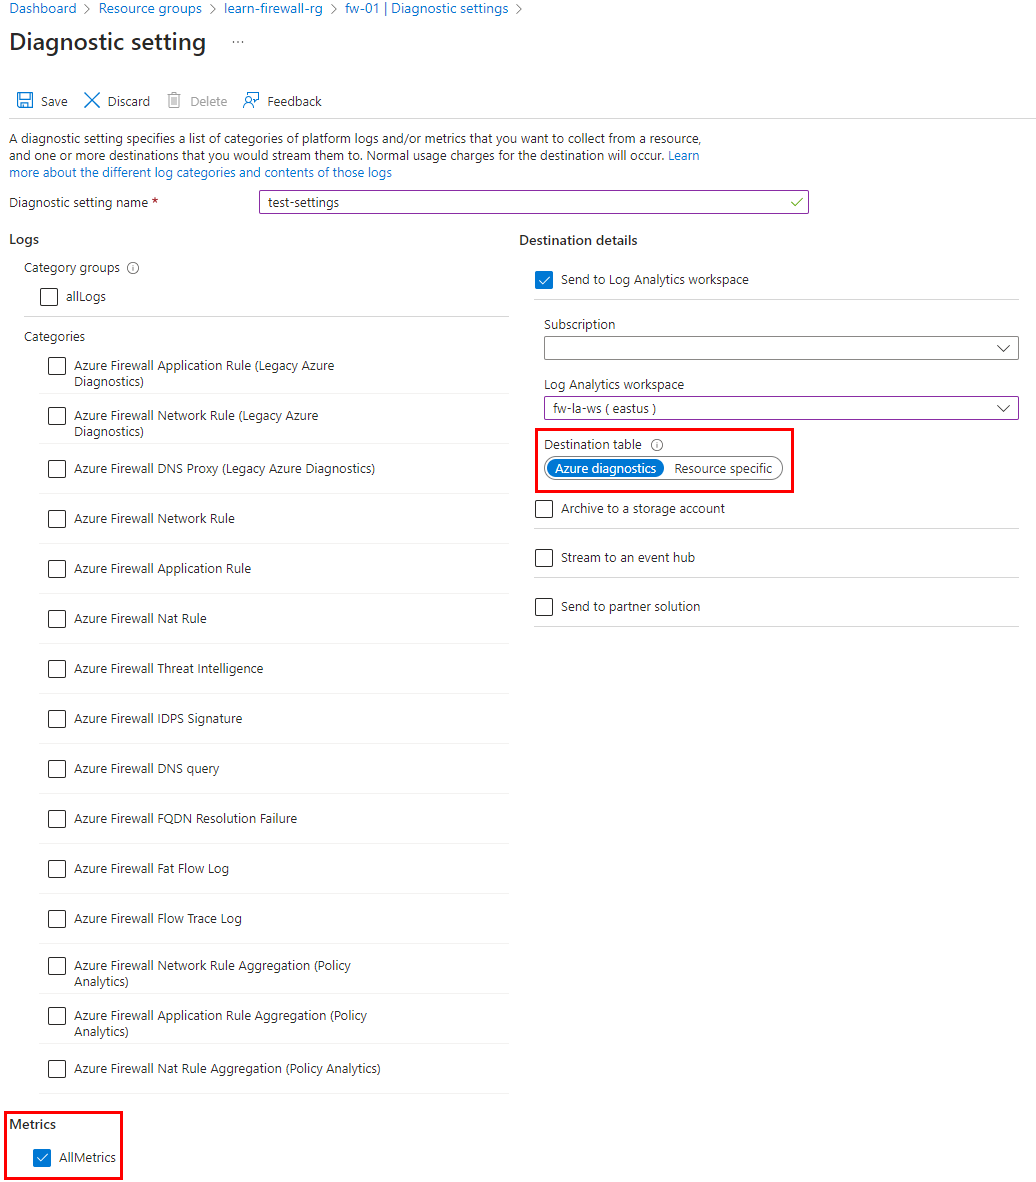
Configure metrics to a log analytics workspace
The first step is to configure metrics availability to the log analytics workspace using diagnostics settings in the firewall.
To configure diagnostic settings as shown in the following screenshot, browse to the Azure Firewall resource page. This pushes firewall metrics to the configured workspace.
Note
The diagnostics settings for metrics must be a separate configuration than logs. Firewall logs can be configured to use Azure Diagnostics or Resource Specific. However, Firewall metrics must always use Azure Diagnostics.
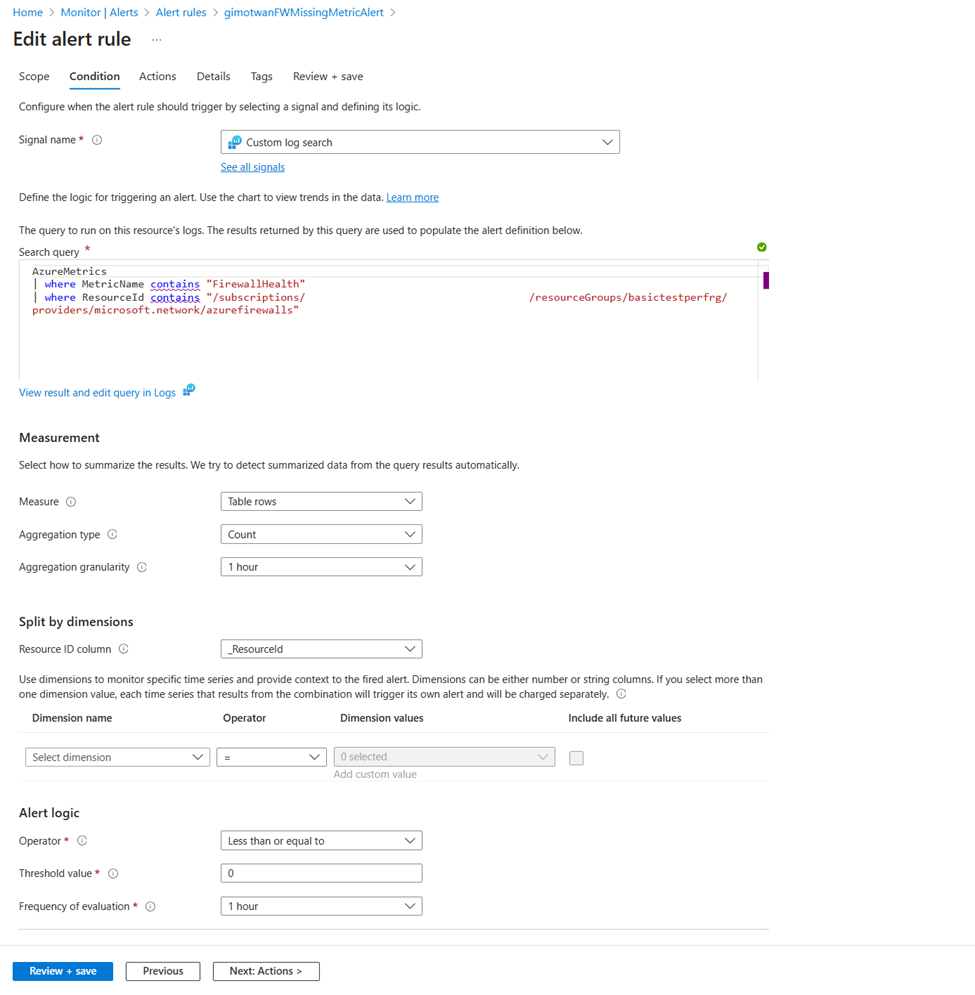
Create alert to track receiving firewall metrics without any failures
Browse to the workspace configured in the metrics diagnostics settings. Check if metrics are available using the following query:
AzureMetrics
| where MetricName contains "FirewallHealth"
| where ResourceId contains "/SUBSCRIPTIONS/XXXXXXXX-XXXX-XXXX-XXXX-XXXXXXXXXXXX/RESOURCEGROUPS/PARALLELIPGROUPRG/PROVIDERS/MICROSOFT.NETWORK/AZUREFIREWALLS/HUBVNET-FIREWALL"
| where TimeGenerated > ago(30m)
Next, create an alert for missing metrics over a time period of 60 minutes. To set up new alerts on missing metrics, browse to the Alert page in the log analytics workspace.
Azure Firewall alert rules
You can set alerts for any metric, log entry, or activity log entry listed in the Azure Firewall monitoring data reference.
Advisor recommendations
For some services, if critical conditions or imminent changes occur during resource operations, an alert displays on the service Overview page in the portal. You can find more information and recommended fixes for the alert in Advisor recommendations under Monitoring in the left menu. During normal operations, no advisor recommendations display.
For more information on Azure Advisor, see Azure Advisor overview.
Related content
- See Azure Firewall monitoring data reference for a reference of the metrics, logs, and other important values created for Azure Firewall.
- See Monitoring Azure resources with Azure Monitor for general details on monitoring Azure resources.