Notebook outputs and results
After you attach a notebook to a cluster and run one or more cells, your notebook has state and displays outputs. This section describes how to manage notebook state and outputs.
Clear notebooks state and outputs
To clear the notebook state and outputs, select one of the Clear options at the bottom of the Run menu.
| Menu option | Description |
|---|---|
| Clear all cell outputs | Clears the cell outputs. This is useful if you share the notebook and want to avoid including any results. |
| Clear state | Clears the notebook state, including function and variable definitions, data, and imported libraries. |
| Clear state and outputs | Clears cell outputs and the notebook state. |
| Clear state and run all | Clears the notebook state and starts a new run. |
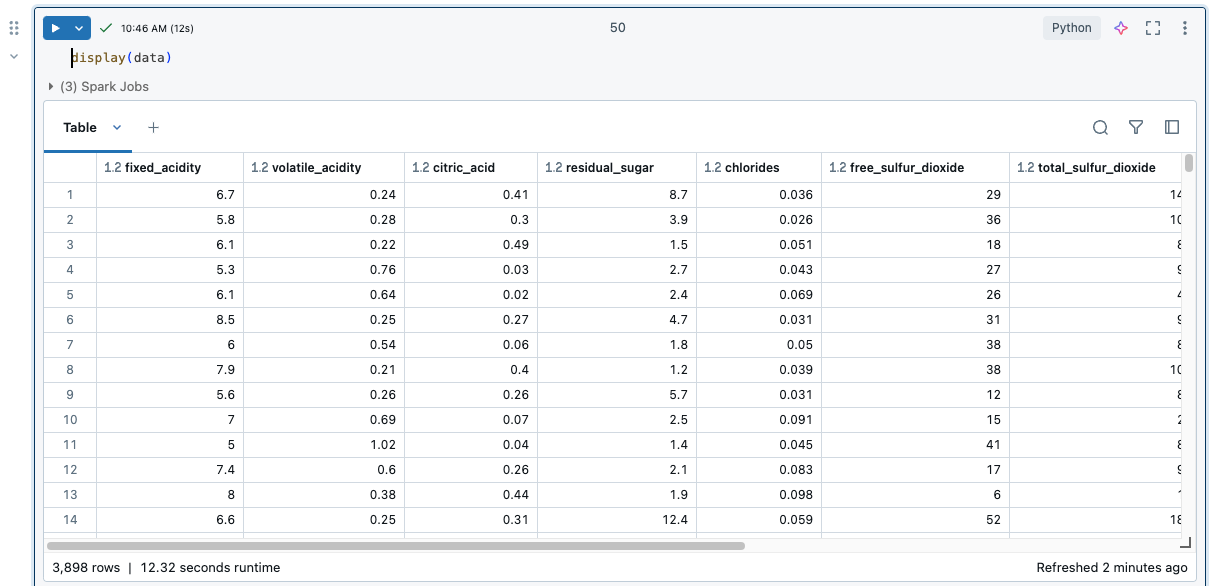
Results table
When a cell is run, results are shown in a results table. With the results table, you can do the following:
- Copy a column or other subset of tabular results data to the clipboard.
- Do a text search over the results table.
- Sort and filter data.
- Navigate between table cells using the keyboard arrow keys.
- Select part of a column name or cell value by double-clicking and dragging to select the desired text.
To view limits on the results table, see Notebook results table limits.
Select data
To select data in the results table, do any of the following.
- Click a column or row header.
- Click in the upper-left cell of the table to select the entire table.
- Drag your cursor across any set of cells to select them.
To open a side panel displaying selection information, click the panel icon ![]() icon in the upper-right corner, next to the Search box.
icon in the upper-right corner, next to the Search box.
![]()
Copy data to clipboard
To copy the selected data to the clipboard, press Cmd + c on MacOS or Ctrl + c on Windows, or right-click and select Copy from the drop-down menu. You can also select Copy as to copy the selected data in CSV, TSV, or Markdown format.
Sort results
To sort the results table by the values in a column, hover your cursor over the column name. An icon containing the column name appears at the right of the cell. Click the arrow to sort the column.
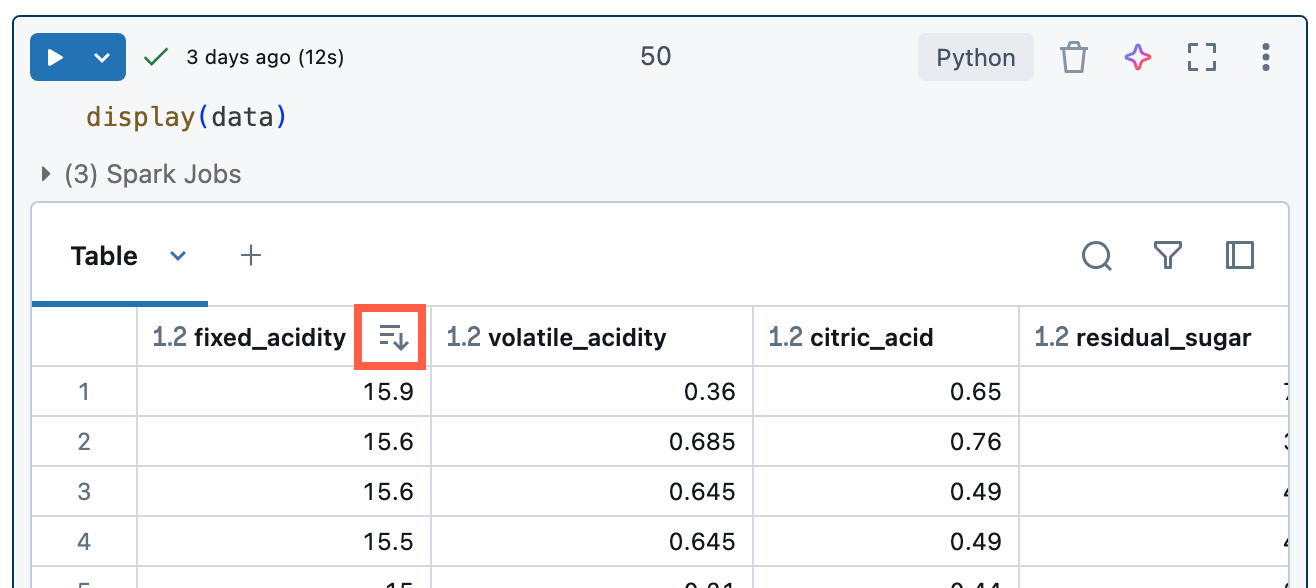
To sort by multiple columns, hold down the Shift key as you click the sort arrow for the columns.
Filter results
There are several ways to create a filter:
Click
 at the upper-right of the cell results. In the dialog that appears, select the column to filter on and the filter rule and value to apply. For example:
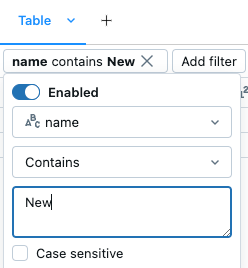
To add another filter, click
 .
.To temporarily enable or disable a filter, toggle the Enabled/Disabled button in the dialog. To delete a filter, click the X next to the filter name
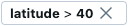 .
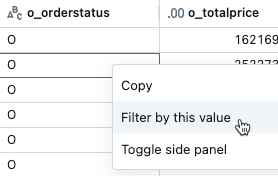
.To filter by a specific value, right-click on a cell with that value and select Filter by this value from the drop-down menu.
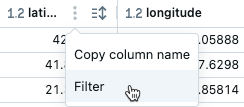
To filter on a specific column, use the kebab menu in the column name:
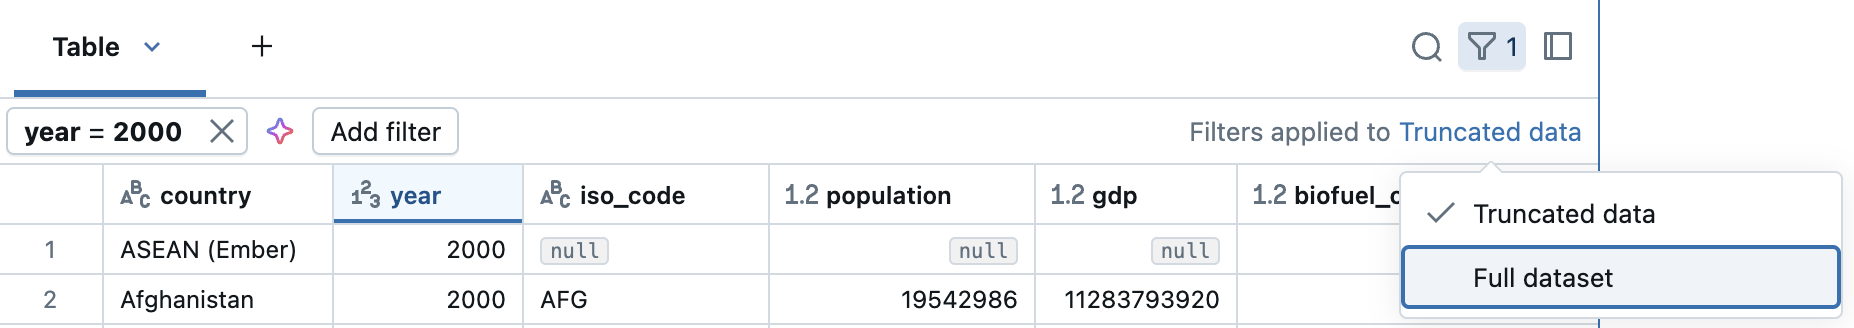
By default, filters are applied only to the results shown in the results table. If the data returned is truncated (for example, when a query returns more than 10,000 rows or the dataset is larger than 2MB), the filter is applied only to the returned rows. A note in the top right of the table indicates that the filter was applied to truncated data.
You can choose to filter the full dataset instead. Click Truncated data, then choose Full dataset. Depending on the size of the dataset, it may take a long time for the filter to apply.
Format columns
Column headers indicate the data type of the column. For example,  indicates integer data type. Hover over the indicator to see the data type.
You can format columns in results tables as types like Currency, Percentage, URL and more, with control over decimal places for clearer tables.
Format columns from the kebab menu in the column name.
Download results
By default, downloading results is enabled. To toggle this setting, see Manage the ability to download results from notebooks.
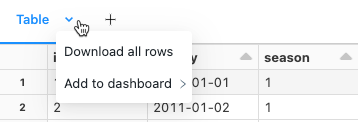
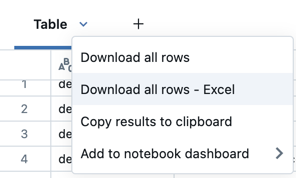
You can download a cell result that contains tabular output to your local machine. Click the downward pointing arrow next to the tab title. The menu options depend on the number of rows in the result and the Databricks Runtime version. Downloaded results are saved on your local machine as a CSV file with a name corresponding to your notebook name.
For notebooks connected to SQL warehouses, you can also download the results as an Excel file.
Explore SQL cell results
In a Databricks notebook, results from a SQL language cell are automatically available as a DataFrame assigned to the variable _sqldf. You can use the _sqldf variable to refer to the previous SQL output in subsequent Python and SQL cells. For details, see Explore SQL cell results.
View multiple outputs per cell
Python notebooks and %python cells in non-Python notebooks support multiple outputs per cell. For example, the output of the following code includes both the plot and the table:
import pandas as pd
from sklearn.datasets import load_iris

data = load_iris()
iris = pd.DataFrame(data=data.data, columns=data.feature_names)
ax = iris.plot()
print("plot")
display(ax)
print("data")
display(iris)
Resize outputs
Resize cell outputs by dragging the bottom right corner of the table or visualization.
Commit notebook outputs in Databricks Git folders
To learn about committing .ipynb notebook outputs, see Allow committing .ipynb notebook output.
- The notebook must be a .ipynb file
- Workspace admin settings must allow notebook outputs to be committed