Call Automation Insights
In this document, we outline the available insights dashboard to monitor Call Automation logs and metrics.
Overview
Within your Communications Resource, we've provided an Insights Preview feature that displays many data visualizations conveying insights from the Azure Monitor logs and metrics monitored for your Communications Services. The visualizations within Insights are made possible via Azure Monitor Workbooks. In order to take advantage of Workbooks, follow the instructions outlined in Enable Azure Monitor in Diagnostic Settings. To enable Workbooks, you need to send your logs to a Log Analytics workspace destination.
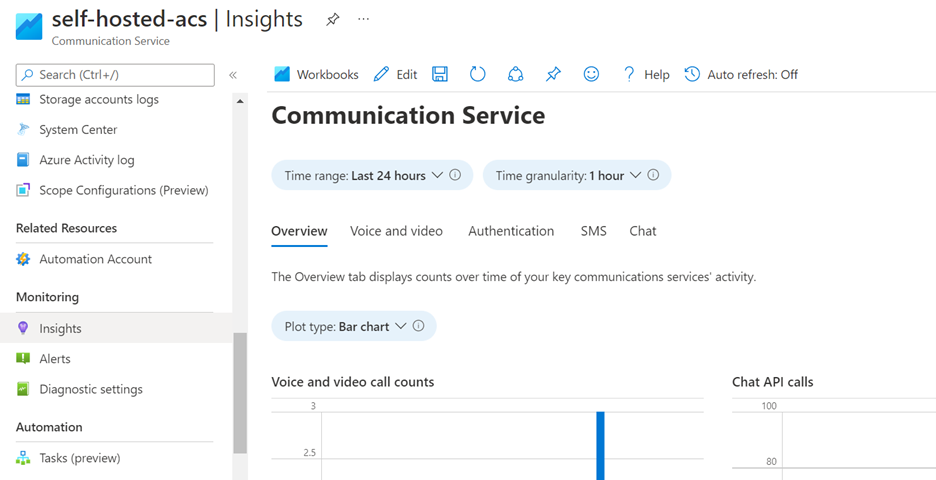
Prerequisites
- In order to take advantage of Workbooks, follow the instructions outlined in Enable Azure Monitor in Diagnostic Settings. You need to enable
Operational Call Automation Logs. - To use Workbooks, you need to send your logs to a Log Analytics workspace destination.
Accessing Azure Insights for Communication Services
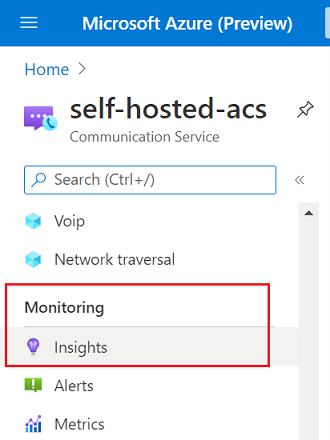
Inside your Azure Communication Services resource, scroll down on the left nav bar to the Monitor category and click on the Insights tab:
Call Automation Insights
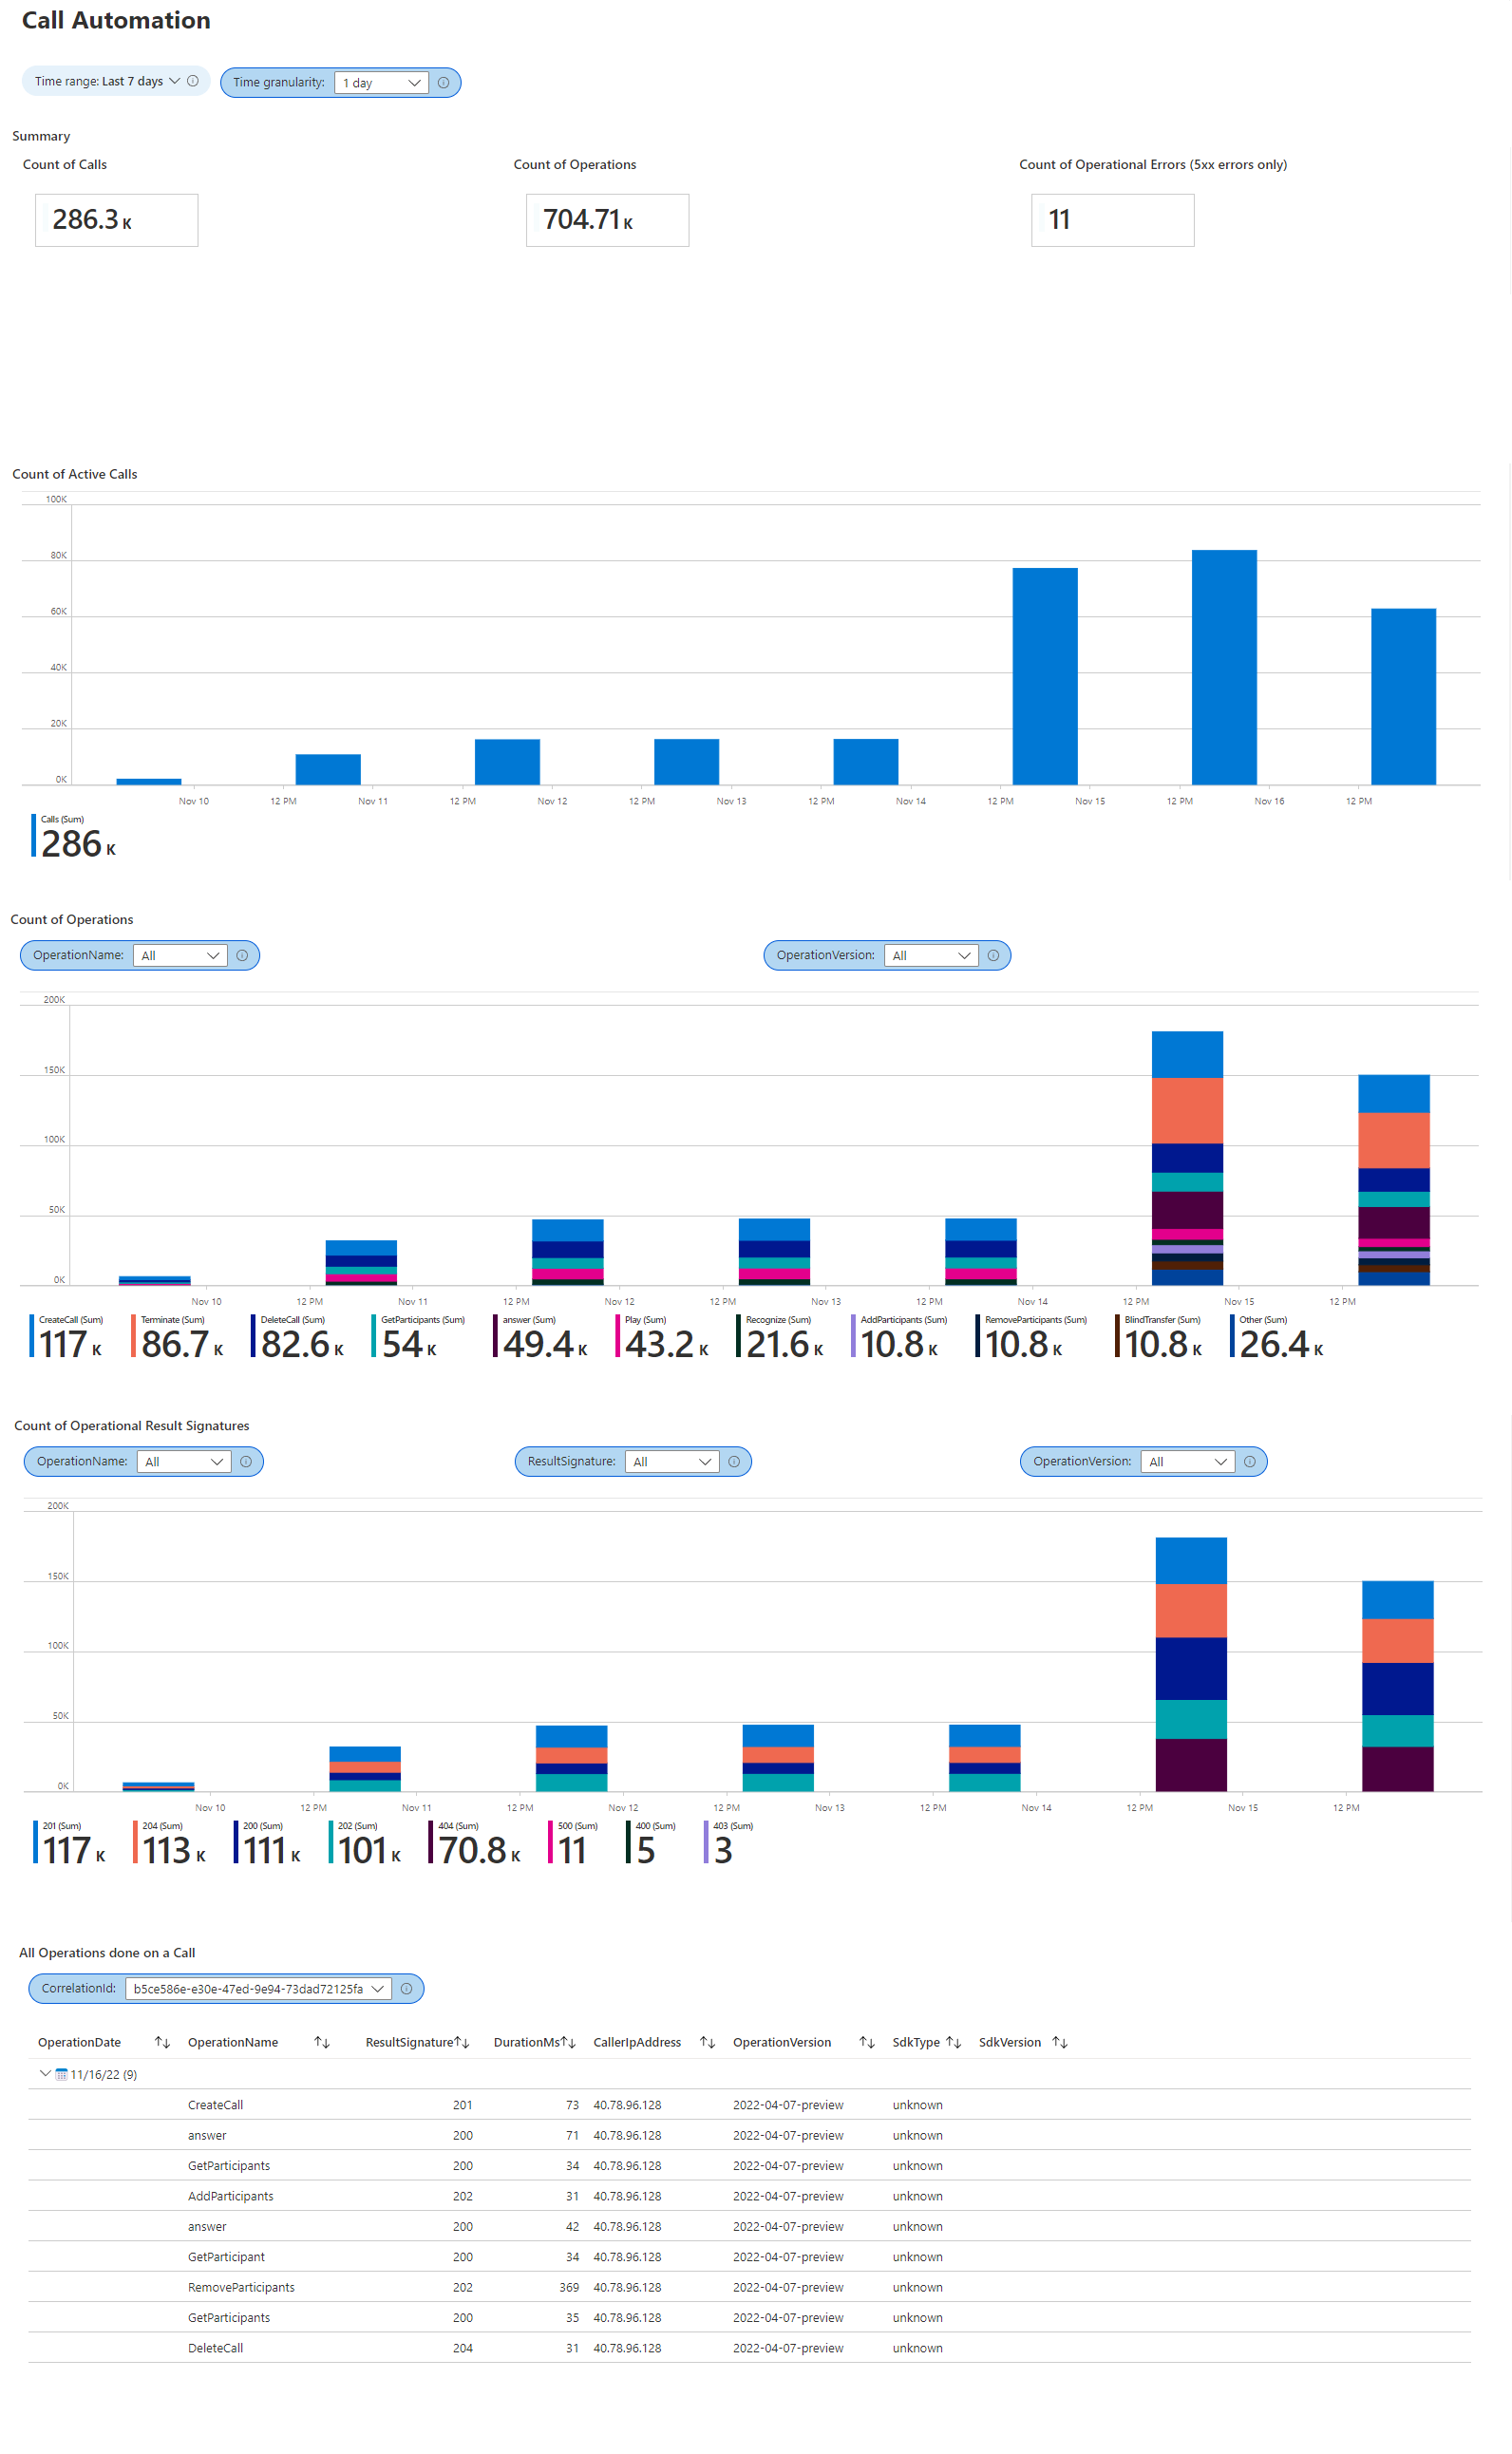
The Call Automation tab displays data about calls placed or answered using Call Automation SDK, like active call count, operations executed and errors encountered by your resource over time. You can also examine a particular call by looking at the sequence of operations taken on that call using the SDK:
More information about workbooks
For an in-depth description of workbooks, refer to the Azure Monitor Workbooks documentation.
Editing dashboards
The Insights dashboards provided with your Communication Service resource can be customized by clicking on the Edit button on the top navigation bar:
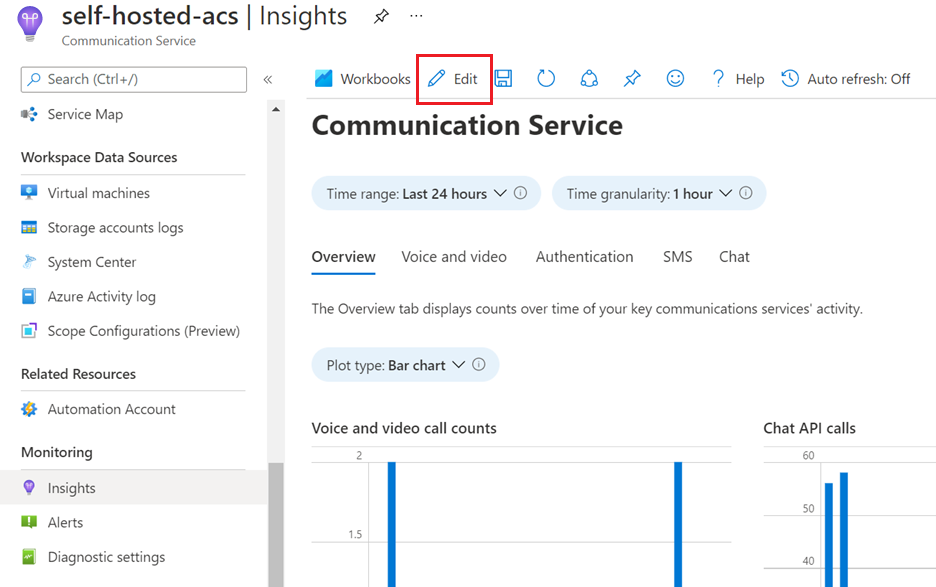
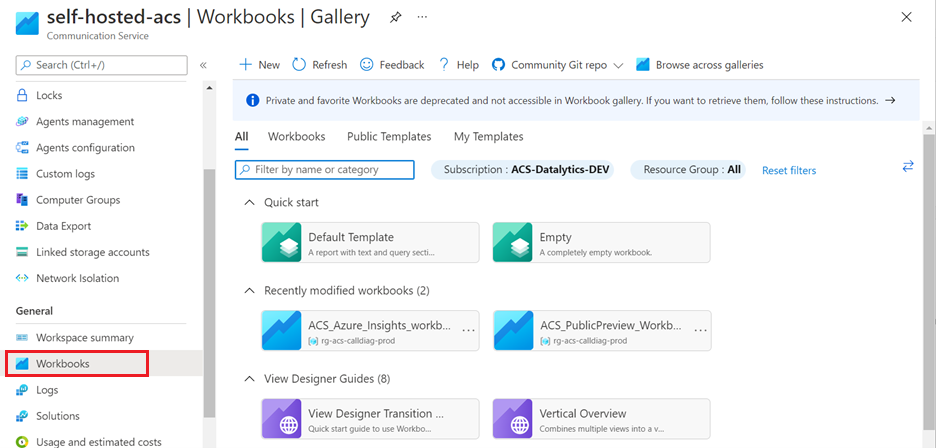
Editing these dashboards doesn't modify the Insights tab, but rather creates a separate workbook that can be accessed on your resource’s Workbooks tab:
For an in-depth description of workbooks, refer to the Azure Monitor Workbooks documentation.