Configure PV monitoring with Container insights
Container insights automatically starts monitoring PV usage by collecting the following metrics at 60-second intervals and storing them in the InsightsMetrics table.
| Metric name | Metric dimension (tags) | Metric description |
|---|---|---|
pvUsedBytes |
podUID, podName, pvcName, pvcNamespace, capacityBytes, clusterId, clusterName |
Used space in bytes for a specific persistent volume with a claim used by a specific pod. The capacityBytes tag is folded in as a dimension in the Tags field to reduce data ingestion cost and to simplify queries. |
To learn more about how to configure collected PV metrics, see Configure agent data collection for Container insights.
PV inventory
Container insights automatically starts monitoring PVs by collecting the following information at 60-second intervals and storing them in the KubePVInventory table.
| Data | Data source | Data type | Fields |
|---|---|---|---|
| Inventory of persistent volumes in a Kubernetes cluster | Kube API | KubePVInventory |
PVName, PVCapacityBytes, PVCName, PVCNamespace, PVStatus, PVAccessModes, PVType, PVTypeInfo, PVStorageClassName, PVCreationTimestamp, TimeGenerated, ClusterId, ClusterName, _ResourceId |
Monitor persistent volumes
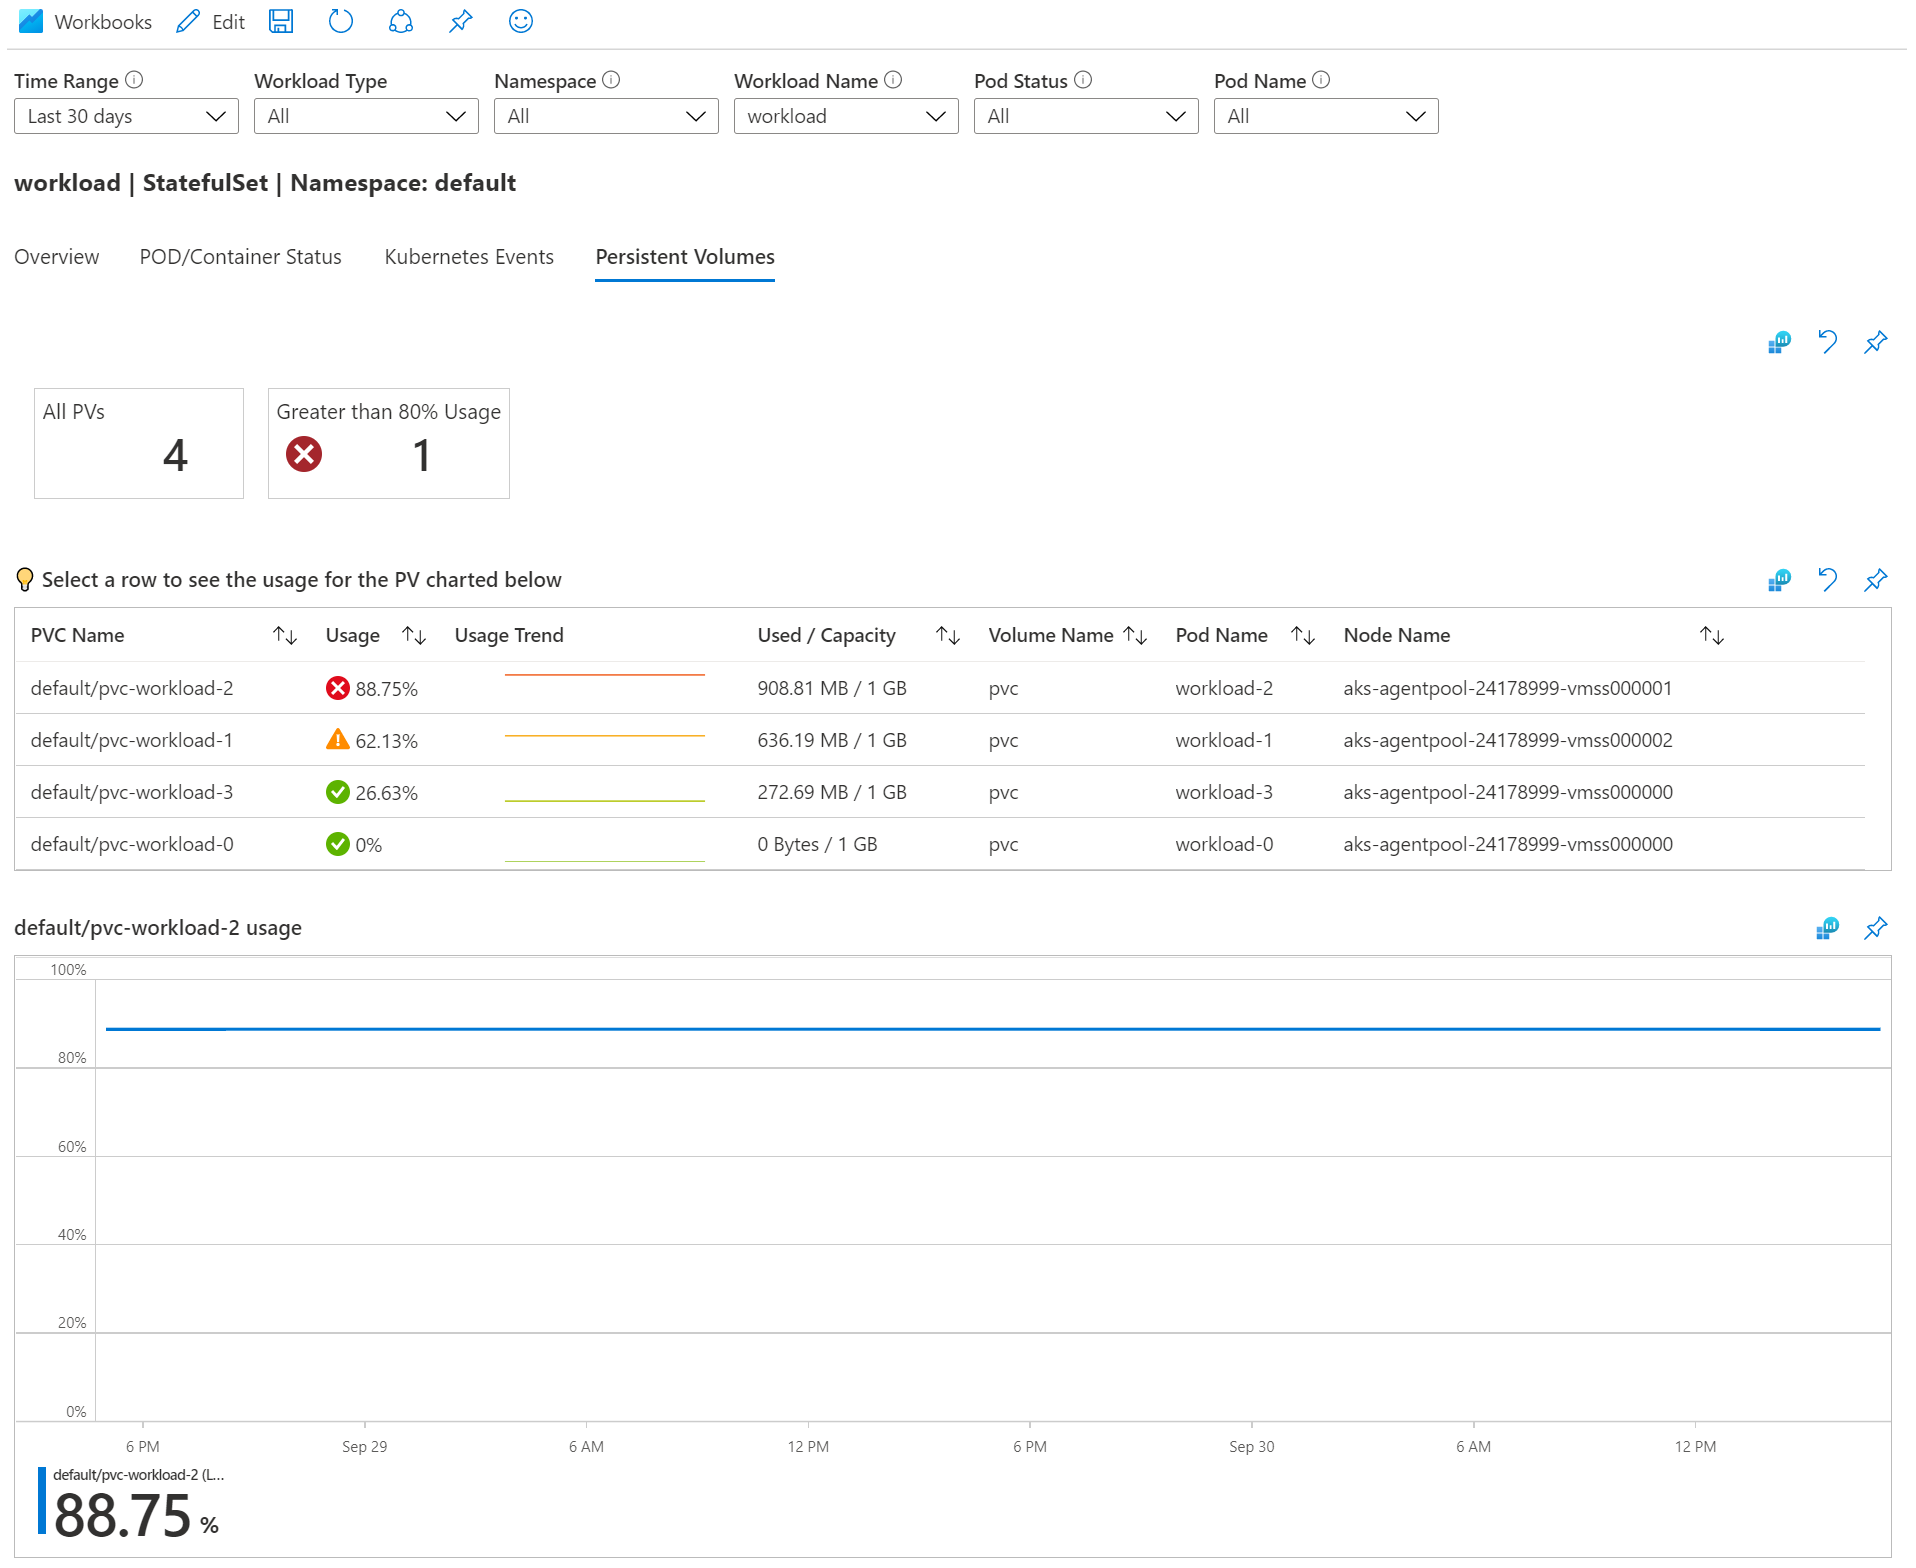
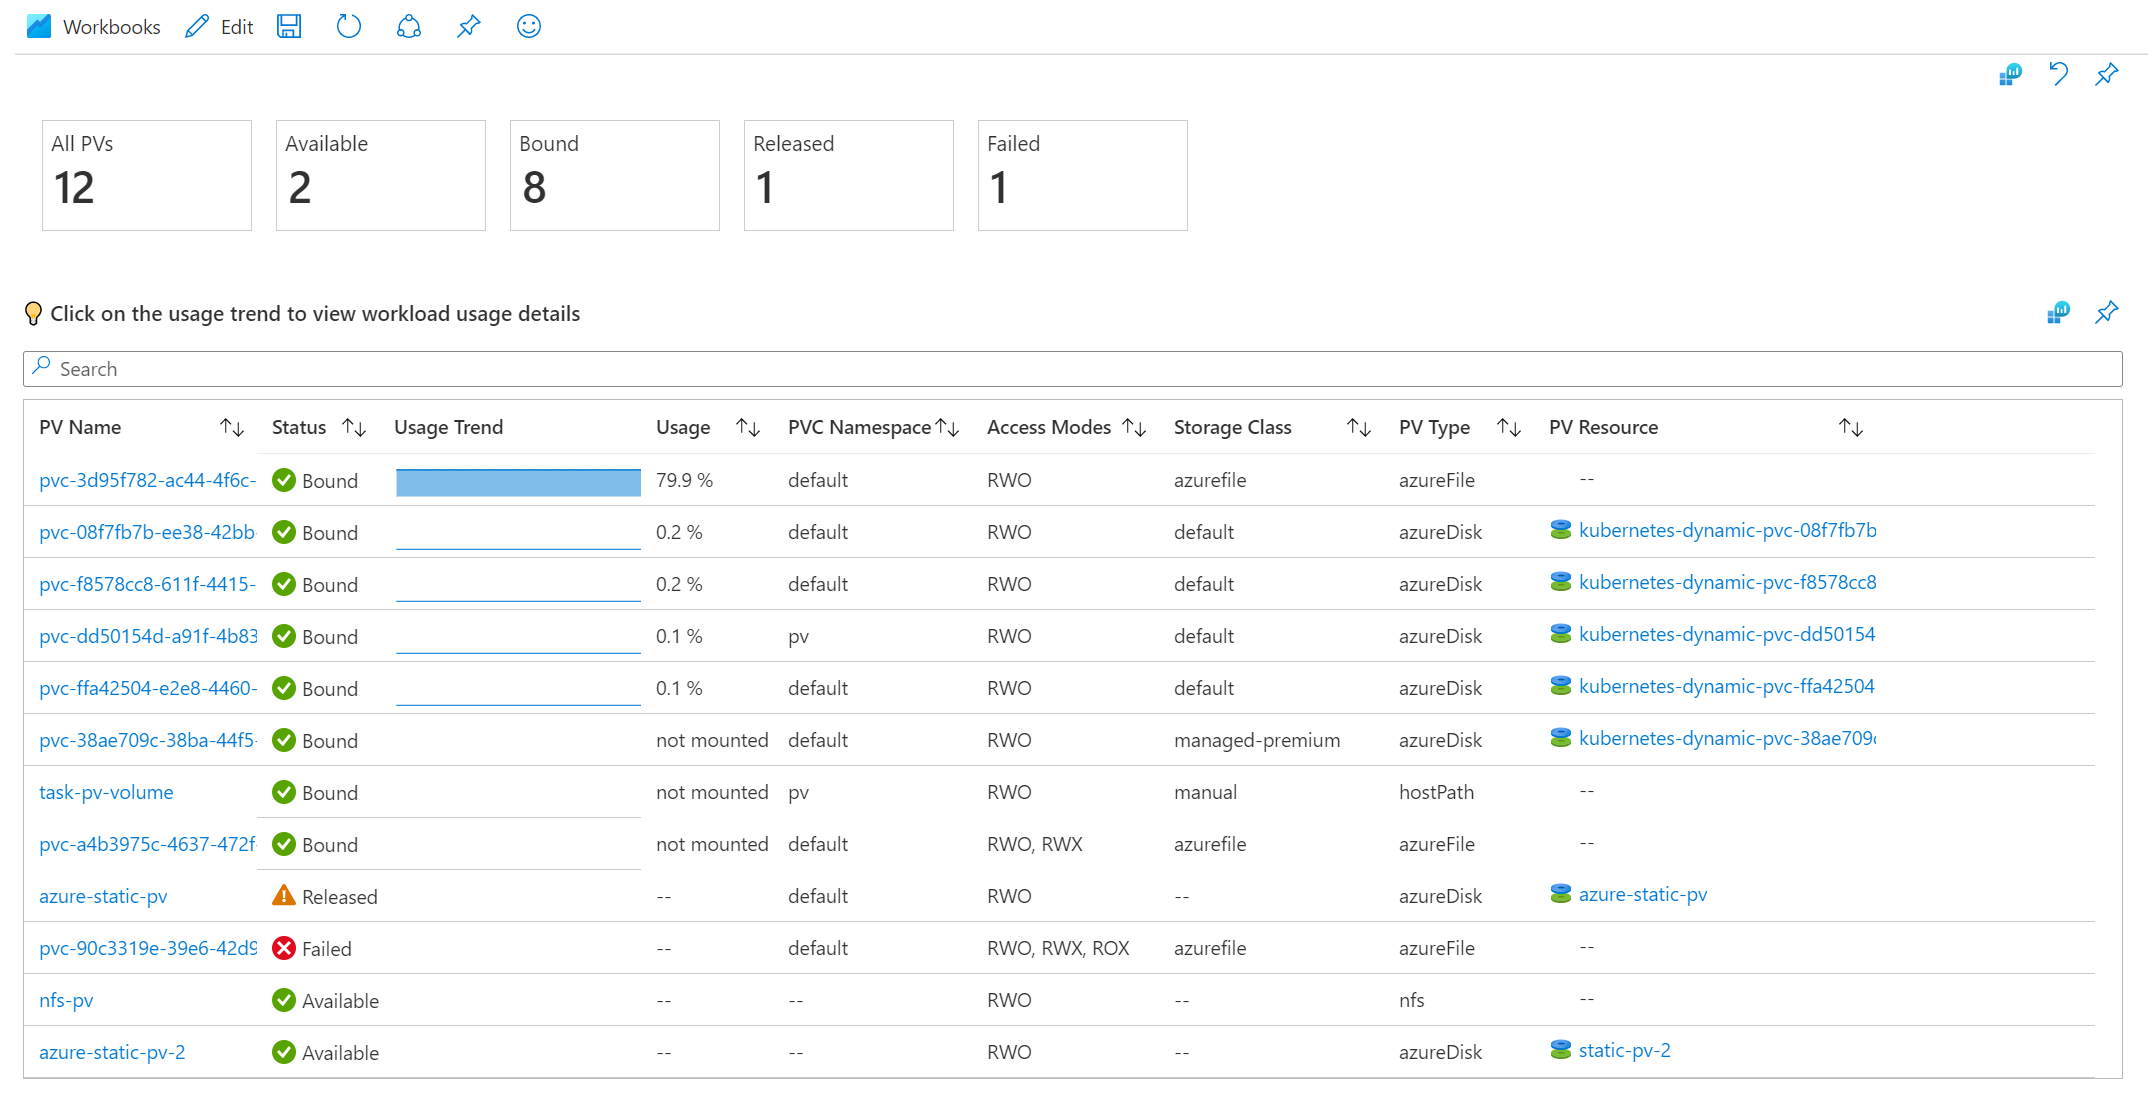
Container insights includes preconfigured charts for this usage metric and inventory information in workbook templates for every cluster. You can also enable a recommended alert for PV usage and query these metrics in Log Analytics.
Workload Details workbook
You can find usage charts for specific workloads on the Persistent Volumes tab of the Workload Details workbook directly from an Azure Kubernetes Service (AKS) cluster. Select Workbooks on the left pane, from the View Workbooks dropdown list in the Insights pane, or from the Reports (preview) tab in the Insights pane.

Persistent Volume Details workbook
You can find an overview of persistent volume inventory in the Persistent Volume Details workbook directly from an AKS cluster by selecting Workbooks from the left pane. You can also open this workbook from the View Workbooks dropdown list in the Insights pane or from the Reports tab in the Insights pane.

Persistent Volume Usage recommended alert
You can enable a recommended alert to alert you when average PV usage for a pod is above 80%. To learn more about alerting, see Metric alert rules in Container insights (preview). To learn how to override the default threshold, see the Configure alertable metrics in ConfigMaps section.
Limitations
Persistent volumes where storage class is "azureblob-*" won't collect PV metrics due to a limitation in CAdvisor. The following command will show persistent volumes and their properties (including storage class).
kubectl get pvc
Next steps
To learn more about collected PV metrics, see Configure agent data collection for Container insights.