Troubleshooting problems in Azure Monitor alerts
This article discusses common problems in Azure Monitor alerts and notifications. Azure Monitor alerts proactively notify you when important conditions are found in your monitoring data.
For specific information about troubleshooting Azure metric or log search alerts, see:
Before troubleshooting
If the alert fires as intended, but the proper notifications don't perform as expected, test your action group first to ensure it's properly configured.
Otherwise, use the information in the rest of this article to troubleshoot your issue.
I didn't receive the expected email
If you can see a fired alert in the Azure portal, but didn't receive the email that you configured, follow these steps:
Was the email suppressed by an alert processing rule?
Check by clicking on the fired alert in the portal, and look at the history tab for suppressed action groups:
Is the type of action "Email Azure Resource Manager Role"?
This action only looks at Azure Resource Manager role assignments that are at the subscription scope and of type User or Group. Make sure that you assigned the role at the subscription level, and not at the resource level or resource group level.
Are your email server and mailbox accepting external emails?
Verify that emails from these three addresses aren't blocked:
- azure-noreply@microsoft.com
- azureemail-noreply@microsoft.com
- alerts-noreply@mail.windowsazure.com
It's common for internal mailing lists or distribution lists to block emails from external email addresses. Make sure that you allow mail from the above email addresses. To test, add a regular work email address (not a mailing list) to the action group and see if alerts arrive to that email.
Was the email processed by inbox rules or a spam filter?
Verify that there are no inbox rules that delete those emails or move them to a side folder. For example, inbox rules could catch specific senders or specific words in the subject. Also, check:
- The spam settings of your email client (like Outlook, Gmail)
- The sender limits / spam settings / quarantine settings of your email server (like Exchange, Microsoft 365, G-suite)
- The settings of your email security appliance, if any (like Barracuda, Cisco).
Have you accidentally unsubscribed from the action group?
Note
Keep in mind if you unsubscribe from an action group then all members from a distribution list will be unsubscribed as well. You can continue to use your distribution list email address. However, you will need to inform the users of your distribution list that if they unsubscribe, they are unsubscribing the whole distribution list rather than just themselves. A work around for this is to add the email address of all the users in the action group individually. One action group can contain up to 1000 email address. Then, if a specific user wants to unsubscribe, then they will be able to do so without affecting the other users. You will also be able to see which users have unsubscribed.
The alert emails provide a link to unsubscribe from the action group. To check if you accidentally unsubscribed from this action group, either:
- Edit the action group in the portal and check the Status column:
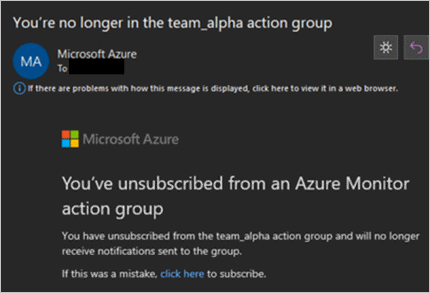
- Search your email for the unsubscribe confirmation:
To subscribe again – either use the link in the unsubscribe confirmation email you received, or remove the email address from the action group, and then add it back again.
Have you exceeded service limits by sending many emails going to a single email address?
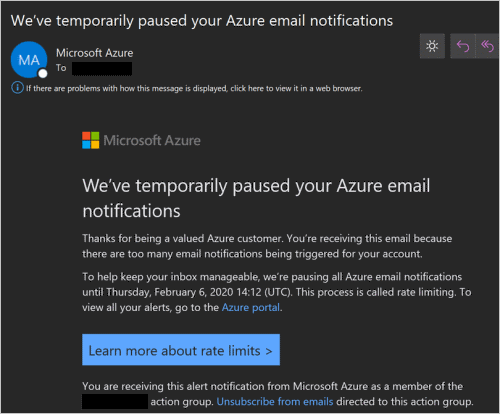
Email is rate limited to no more than 100 emails every hour to each email address. If you pass this threshold, no more email notifications are sent. Check if you received a message indicating that your email address is temporarily rate limited:
If you want to receive a high volume of notifications without rate limiting, consider using a different action, such as:
None of these actions are rate limited.
I didn't receive the expected SMS, voice call, or push notification
If you can see a fired alert in the portal, but did not receive the SMS, voice call or push notification that you configured, follow these steps:
Was the action suppressed by an alert processing rule?
Check by clicking on the fired alert in the portal, and look at the history tab for suppressed action groups:
If that was unintentional, you can modify, disable, or delete the alert processing rule.
SMS/voice: Is your phone number correct?
Check the SMS action for typos in the country code or phone number.
SMS/voice: have you exceeded service limits?
SMS and voice calls are rate limited to no more than one notification every five minutes per phone number. If you pass this threshold, the notifications are dropped.
- Voice call - check your call history and see if you had a different call from Azure in the preceding five minutes.
- SMS - check your SMS history for a message indicating that your phone number is rate limited.
If you want to receive high-volume of notifications without rate limiting, consider using a different action, such as:
None of these actions are rate limited.
SMS: Have you accidentally unsubscribed from the action group?
Open your SMS history and check if you opted out of SMS delivery from this specific action group (using the DISABLE action_group_short_name reply) or from all action groups (using the STOP reply).
To subscribe again, either send the relevant SMS command (ENABLE action_group_short_name or START), or remove the SMS action from the action group, and then add it back again. For more information, see SMS alert behavior in action groups.
Have you accidentally blocked the notifications on your phone?
Most mobile phones allow you to block calls or SMS from specific phone numbers or short codes, or to block push notifications from specific apps (such as the Azure mobile app). To check if you accidentally blocked the notifications on your phone, search the documentation specific for your phone operating system and model, or test with a different phone and phone number.
The expected action didn't trigger
If you can see a fired alert in the portal, but its configured action didn't trigger, follow these steps:
Was the action suppressed by an alert processing rule?
Check by clicking on the fired alert in the portal, and look at the history tab for suppressed action groups:
If that was unintentional, you can modify, disable, or delete the alert processing rule.
Did the webhook trigger?
Is the source IP address blocked?
Webhooks only support public networks and firewalls, IP addresses for all regions need to be in the allowlist.Add the IP addresses that the webhook is called from to your allowlist.
Does your webhook endpoint work correctly?
Verify the webhook endpoint you configured is correct and the endpoint is working correctly. Check your webhook logs or instrument its code so you could investigate (for example, log the incoming payload).
Are you using the correct format for calling Slack or Microsoft Teams?
Each of these endpoints expects a specific JSON format. Follow these instructions to configure a logic app action instead.Did your webhook become unresponsive or return errors?
Webhook action groups generally follow these rules when called:
- When a webhook is invoked, if the first call fails, it's retried at least 1 more time, and up to five times (5 retries) at various delay intervals (5, 20, 40 seconds).
- The delay between 1st and 2nd attempt is 5 seconds
- The delay between 2nd and 3rd attempt is 20 seconds
- The delay between 3rd and 4th attempt is 5 seconds
- The delay between 4th and 5th attempt is 40 seconds
- The delay between 5th and 6th attempt is 5 seconds
- After retries attempted to call the webhook fail, no action group calls the endpoint for 15 minutes.
- The retry logic assumes that the call can be retried. The status codes: 408, 429, 503, 504, or
HttpRequestException,WebException, orTaskCancellationExceptionallow for the call to be retried.
- When a webhook is invoked, if the first call fails, it's retried at least 1 more time, and up to five times (5 retries) at various delay intervals (5, 20, 40 seconds).
The action or notification happened more than once
If you received a notification for an alert (such as an email or an SMS) more than once, or the alert's action (such as webhook or Azure function) was triggered multiple times, follow these steps:
Is it really the same alert?
In some cases, multiple similar alerts are fired at around the same time. So, it might just seem like the same alert triggered its actions multiple times. For example, an activity log alert rule might be configured to fire both when an event starts and finishes (succeeded or failed), by not filtering on the event status field. Another example is in Log search alerts when you define dimentins and we check all the dimension combinations due to the factthat we are checking all the diffrent combinations it can also result in similar alerts.
To check if these actions or notifications came from different alerts, examine the alert details, such as its timestamp and either the alert ID or its correlation ID. Alternatively, check the list of fired alerts in the portal. If that is the case, you would need to adapt the alert rule logic or otherwise configure the alert source.
Does the action repeat in multiple action groups?
When an alert is fired, each of its action groups is processed independently. So, if an action (such as an email address) appears in multiple triggered action groups, it would be called once per action group.
To check which action groups were triggered, check the alert history tab. You would see there both action groups defined in the alert rule, and action groups added to the alert by alert processing rules:
The action or notification has unexpected content
Was there an outage that triggered the use of the fallback email provider?
Action Groups uses two different email providers to ensure email notification delivery. The primary email provider is resilient and quick but occasionally suffers outages. When there are outages, the secondary email provider handles email requests. The secondary provider is only a fallback solution. Due to provider differences, an email sent from our secondary provider might have a degraded email experience. The degradation results in slightly different email formatting and content. Since email templates differ in the two systems, maintaining parity across the two systems isn't feasible.
Notifications generated by the fallback solution contain a note that says:
"This is a degraded email experience. That means the formatting may be off or details could be missing. For more information on the degraded email experience, read here."
If your notification doesn't contain this note and you received the alert, but believe some of its fields are missing or incorrect, check the payload format. The payload can be either common schema format or non common which means a diffrent scheme between alert types:activity log alerts, for log search alerts (both Application Insights and log analytics), for metric alerts. In order to see the payload you can use a webhook action and to send it to your IP in order to see the result.
What format did you use when configuring the alert rule?
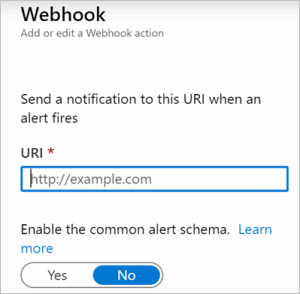
Each action type (email, webhook, etc.) has two formats - the default, legacy format, and the common schema format. When you create an action group, you specify the format of the action. Different actions in the action groups may have different formats.
For example, for webhook actions:
Check if the format specified at the action level is what you expect. For example, you might have developed code that responds to alerts (webhook, function, logic app, etc.), expecting one format, but later in the action you or another person specified a different format.
Also, check the payload format (JSON) for activity log alerts, for log search alerts (both Application Insights and log analytics), for metric alerts,and for the common alert schema.
The search results are not included in the log search alert notifications.
As of log search alerts API version 2021-08-01, search results were removed from alert notification payload. Search results are only available for alert rules created with older API versions (2018-04-16). Creation of new alert rules through the Azure portal will, by default, create the rule with the newer version. Follow Changes to the log alert rule creation experience to learn about the changes and recommended adjustments for using the updated version.
The MetricValue field contains "null" for resolved log search alert notifications.
This is by design. Stateful log search alerts use a time-based resolution logic rather than value-based. Azure Monitor is sending a null metric value since there's no value that caused the alert to resolve, but rather elapsed time.
The dimensions list is empty or alert title doesn't contain a dimension name
When a query does not return any rows, the resource ID field (which is the basis for populating dimension and title fields) is empty. For example, when you have a log search alert rule that returns no results, if the threshold is 0, the alert fires as expected, but the dimensions list is empty or alert title doesn't contain a dimension name.
Information is missing in an activity log alert
Activity log alerts are alerts that are based on events written to the Azure activity log, such as events about creating, updating, or deleting Azure resources, service health and resource health events, or findings from Azure Advisor and Azure Policy. If you received an alert based on the activity log but some fields that you need are missing or incorrect, first check the events in the activity log itself. If the Azure resource did not write the fields you are looking for in its activity log event, those fields aren't included in the corresponding alert.
The custom properties are missing from email, SMS, or push notifications.
Custom properties are only passed to the payload for actions, such as webhook, Azure function or logic apps. Custom properties aren't included in for notifications (email/SMS/push).
The alert processing rule isn't working as expected
If you can see a fired alert in the portal, but a related alert processing rule didn't work as expected, follow these steps:
Is the alert processing rule enabled?
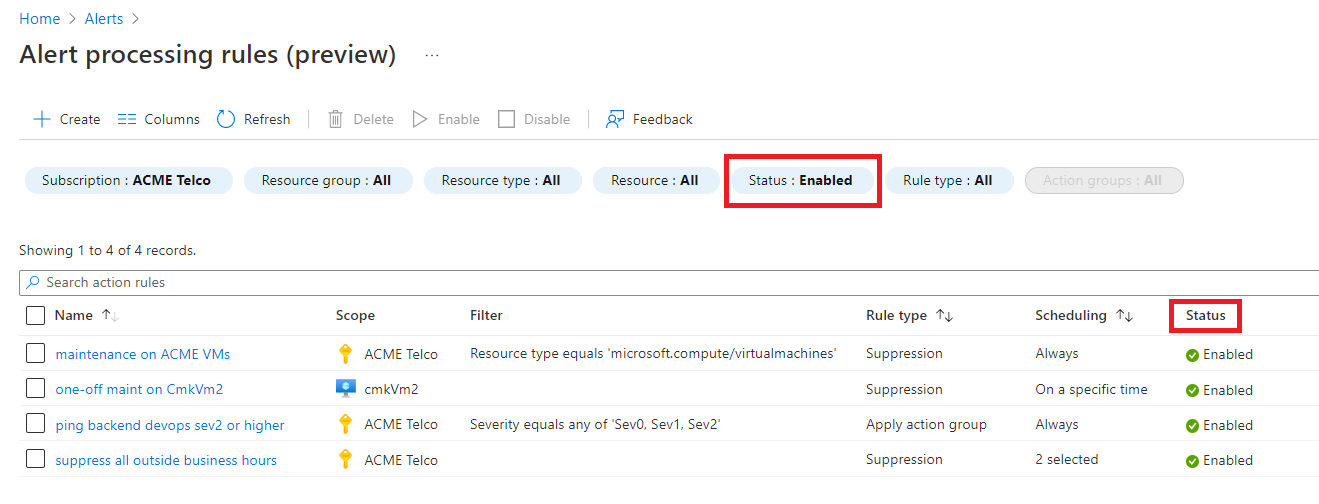
Check the alert processing rule status field to verify that the related action role is enabled. By default, the portal only shows alert rules that are enabled, but you can change the filter to show all rules.
If it isn't enabled, you can enable the alert processing rule by selecting it and clicking Enable.
Is it a service health alert?
Service health alerts aren't affected by alert processing rules. So, if you have an alert processing rule configured for a scope that includes service health alerts, while the service health alerts are within the scope, the alert processing rule won't affect them.
Did the alert processing rule process your alert?
Select the fired alert in the portal, and look at the History tab to see if the alert processing rule was processed.
Here's an example of alert processing rule that suppresses all action groups:
Here's an example of an alert processing rule that adds another action group:
Do the alert processing rule scope and filter match the fired alert?
If you think the alert processing rule should have fired but didn't, or that it shouldn't have fired but it did, carefully examine the alert processing rule scope and filter conditions and compare them to the properties of the fired alert. In Azure alerts:
- The scope defines the range of resources that the alert rule applies to. This could be a single resource, a resource group, or even an entire subscription. The scope determines which resources are included in the evaluation of the alert rule.
- The target resource refers to the specific resource that triggered the alert. This could be an individual virtual machine, a database, or any other Azure resource. When an alert is triggered, it is because a condition has been met on this particular resource. The scope defines the range of resources that the alert rule applies to. This could be a single resource, a resource group, or even an entire subscription. The scope determines which resources are included in the evaluation of the alert rule. For example, if you have an alert rule with a scope that includes multiple virtual machines, the alert will monitor all those virtual machines. If any of them meet the alert condition, the alert will be triggered. However, the target resource will be the specific virtual machine that caused the alert to fire. For example, in log search alerts, if the scope of the alert is a Log Analytics workspace, and the _ResourceId column is selected, the target resource gets the value of the Resource ID, causing the alert to be triggered on a different resource than initially intended. In summary, the target resource is the individual resource being monitored, while the scope defines the broader set of resources that the alert rule applies to.
Problems creating, updating, or deleting alert processing rules in the Azure portal
If you received an error while trying to create, update or delete an alert processing rule, follow these steps:
Check the permissions.
You should either have the Monitoring Contributor built-in role, or the specific permissions related to alert processing rules and alerts.
Check the alert processing rule parameters.
Check the alert processing rule documentation, or the alert processing rule PowerShell Set-AzAlertProcessingRule command.


