Add a simple data layer
The Azure Maps Web SDK provides a Spatial IO module that includes a SimpleDataLayer class. This class makes it easy to render styled features on a map. It can even render data sets that have style properties and data sets that contain mixed geometry types.
The simple data layer achieves this functionality by wrapping multiple rendering layers and by using style expressions. The style expressions search wrapped layers for common style properties. The atlas.io.read and atlas.io.write functions use these properties to read and write styles into a supported file format. When you add properties to a supported file format, you can use the file for purposes like displaying styled features on a map.
The SimpleDataLayer class also provides a built-in popup feature with a popup template. The popup appears when a feature is selected. This layer also supports clustered data. When a cluster is selected, the map zooms in to the cluster and expands it into individual points and subclusters. You can disable the popup feature if you don't need it.
The SimpleDataLayer class is intended to be used on large data sets that include features with many applied geometry types and styles. When you use this class, it adds an overhead of six layers that contain style expressions. If you only need to render a few geometry types and styles on a feature, it might be more efficient to use a core rendering layer. For more information, see Add a bubble layer to the map, Add a line layer to the map, and Add a polygon layer to the map.
Use a simple data layer
You can use the SimpleDataLayer class like the other rendering layers. The following code shows how to use a simple data layer in a map:
//Create a data source and add it to the map.
var datasource = new atlas.source.DataSource();
map.sources.add(datasource);

//Add a simple data layer for rendering data.
var layer = new atlas.layer.SimpleDataLayer(datasource);
map.layers.add(layer);
The following code snippet demonstrates how to use a simple data layer that references data from an online source:
<script src="https://atlas.microsoft.com/sdk/javascript/spatial/0/atlas-spatial.min.js"></script>

<script>
    function InitMap() {
        var map = new atlas.Map("myMap", {
            center: [-73.967605, 40.780452],
            zoom: 12,
            view: "Auto",

            //Add authentication details to connect to Azure Maps.
            authOptions: {
                // Get an Azure Maps key at https://azuremaps.com/.
                authType: "subscriptionKey",
                subscriptionKey: '{Your-Azure-Maps-Subscription-key}'
            }
        });

        //Wait until the map resources are ready.
        map.events.add("ready", function () {
            //Create a data source and add it to the map.
            var datasource = new atlas.source.DataSource();
            map.sources.add(datasource);

            //Add a simple data layer for rendering data.
            var layer = new atlas.layer.SimpleDataLayer(datasource);
            map.layers.add(layer);

            //Load an initial data set.
            const dataSet = {
                type: "FeatureCollection",
                bbox: [0, 0, 0, 0],
                features: [
                    {
                        type: "Feature",
                        geometry: {
                            type: "Point",
                            coordinates: [0, 0]
                        },
                        properties: {
                            color: "red"
                        }
                    }
                ]
            };

            loadDataSet(dataSet);

            function loadDataSet(r) {
                //Update the features in the data source.
                datasource.setShapes(r);

                //If bounding box information is known for data, set the map view to it.
                if (r.bbox) {
                    map.setCamera({
                        bounds: r.bbox,
                        padding: 50
                    });
                }
            }
        });
    }
</script>
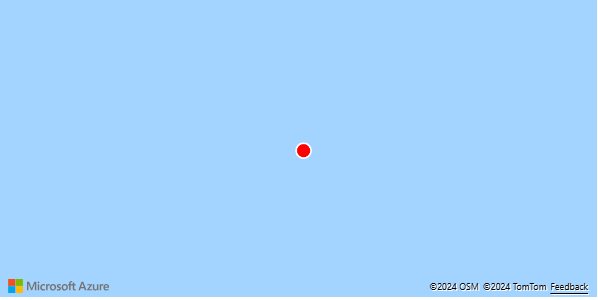
When you add features to the data source, the simple data layer renders them in the most appropriate way. You can set styles as properties for each individual feature.
The preceding sample code shows a Geographic JavaScript Object Notation (GeoJSON) point feature with a color property set to red.
The sample code renders the point feature by using the simple data layer, and the result appears as follows.
Note
The value from the data source "coordinates": [0, 0] overrides the coordinates center: [-73.967605, 40.780452] that you set when the map was initialized.
The simple data layer is a powerful tool in the following scenarios:
- A data source includes several feature types.
- Features in the data set have several style properties that are individually set.
- You're not sure what the data set contains.
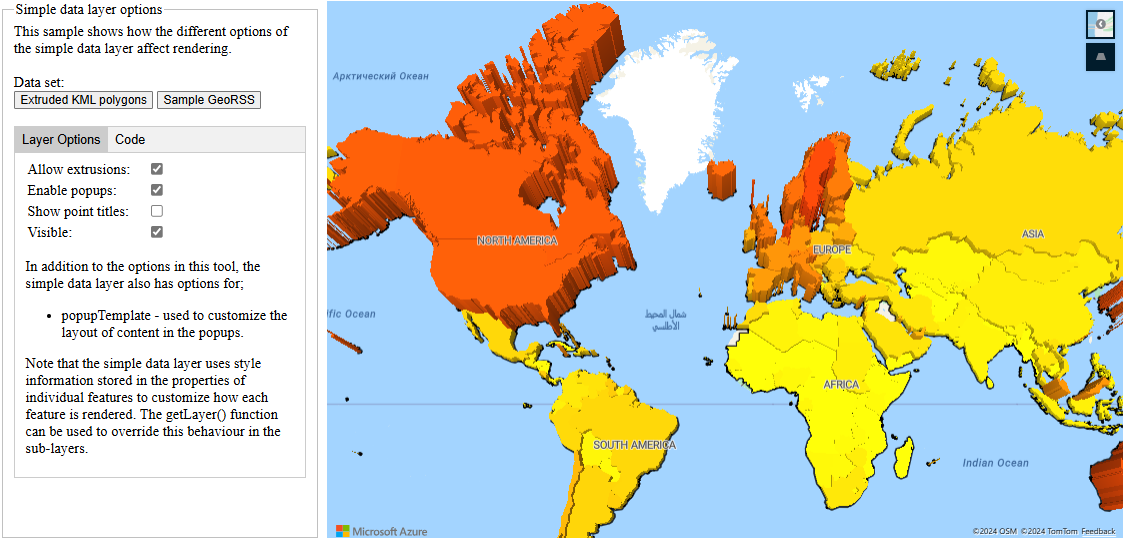
For example, when you're parsing XML data feeds, you might not know the features' style and geometry types. The Simple data layer options sample shows how the simple data layer renders the features of a Keyhole Markup Language (KML) file. You can also see the options in the SimpleDataLayer class. For the source code for this sample, see Simple data layer options.html in the Azure Maps code samples in GitHub.
Note
This simple data layer uses the popup template class to display KML balloons or feature properties as a table. By default, all content rendered in the popup is sandboxed inside an iFrame as a security feature. However, there are limitations:
- All pointer lock functionality, top navigation functionality, scripts, and forms are disabled. Links can open in a new tab when they're selected.
- Older browsers that don't support the
srcdocparameter on iFrames can render only a small amount of content.
If you trust the data loaded into the popups, and want the popup scripts to be able to access your application, you can disable this feature. Just set the sandboxContent option in the popup template to false.
Default supported style properties
The simple data layer wraps several of the core rendering layers: bubble, symbol, line, polygon, and extruded polygon. It uses expressions to search for valid style properties on individual features.
The two main sets of supported property names are Azure Maps and GitHub. Most property names of Azure Maps layer options are supported in the simple data layer as style properties of features. Some layer options include expressions that support style property names that GitHub commonly uses.
GitHub's GeoJSON map support defines these property names, which are used to style GeoJSON files that are stored and rendered within the platform. Most of GitHub's styling properties are supported in the simple data layer, except the marker-symbol styling properties.
If the reader comes across a less common style property, it converts it to the most similar Azure Maps style property. Additionally, you can override the default style expressions by using the getLayers function of the simple data layer and updating the options on any of the layers.
The following sections provide details on the default style properties that the simple data layer supports. The order of the supported property names is also the priority. If two style properties are defined for the same layer option, the first one in the list takes precedence. Colors can be any CSS3 color value (HEX, RGB, RGBA, HSL, HSLA) or named color value.
Bubble layer style properties
If a feature is a Point or a MultiPoint, and doesn't have an image property to use as a custom icon to render the point as a symbol, it's rendered with a BubbleLayer.
| Layer option | Supported property names | Default value |
|---|---|---|
color |
color, marker-color |
'#1A73AA' |
radius |
size1, marker-size2, scale1 |
8 |
strokeColor |
strokeColor, stroke |
'#FFFFFF' |
1 The size and scale values are considered scalar values, and are multiplied by 8.
2 If the GitHub marker-size option is specified, the radius uses the following values:
| Marker size | Radius |
|---|---|
small |
6 |
medium |
8 |
large |
12 |
Clusters are also rendered in the bubble layer. By default, the radius of a cluster is set to 16. The color of the cluster varies depending on the number of points in the cluster, as defined in the following table:
| Number of points | Color |
|---|---|
| >= 100 | red |
| >= 10 | yellow |
| < 10 | green |
Symbol style properties
If a feature is a Point or MultiPoint, with an image property used as a custom icon to render the point as a symbol, then it's rendered with a SymbolLayer.
| Layer option | Supported property names | Default value |
|---|---|---|
image |
image |
none |
size |
size, marker-size1 |
1 |
rotation |
rotation |
0 |
offset |
offset |
[0, 0] |
anchor |
anchor |
'bottom' |
1 If the GitHub marker-size option is specified, the following values are used for the icon size option:
| Marker size | Symbol size |
|---|---|
small |
0.5 |
medium |
1 |
large |
2 |
If the point feature is a cluster, the point_count_abbreviated property is rendered as a text label. No image is rendered.
Line style properties
If the feature is a LineString, MultiLineString, Polygon, or MultiPolygon, it's rendered with a LineLayer.
| Layer option | Supported property names | Default value |
|---|---|---|
strokeColor |
strokeColor, stroke |
'#1E90FF' |
strokeWidth |
strokeWidth, stroke-width, stroke-thickness |
3 |
strokeOpacity |
strokeOpacity, stroke-opacity |
1 |
Polygon style properties
If the feature is a Polygon or a MultiPolygon, and doesn't have a height property, or if the height property is zero, it's rendered with a PolygonLayer.
| Layer option | Supported property names | Default value |
|---|---|---|
fillColor |
fillColor, fill |
'#1E90FF' |
fillOpacity |
fillOpacity, 'fill-opacity |
0.5 |
Extruded polygon style properties
If the feature is a Polygon or a MultiPolygon, and has a height property with a value greater than zero, it's rendered with a PolygonExtrusionLayer.
| Layer option | Supported property names | Default value |
|---|---|---|
base |
base |
0 |
fillColor |
fillColor, fill |
'#1E90FF' |
height |
height |
0 |
Related content
Learn more about the classes and methods in this article:
See the following articles to get more code samples to add to your maps: