Use the dashboard to manage Azure Local (preview)
Applies to: Azure Local 2311.2 and later
This article details how to manage at-scale your Azure Local via the dashboard in the Azure portal. You can view the status of the systems as charts or lists.
Important
This feature is currently in PREVIEW. See the Supplemental Terms of Use for Microsoft Azure Previews for legal terms that apply to Azure features that are in beta, preview, or otherwise not yet released into general availability.
View the dashboard charts
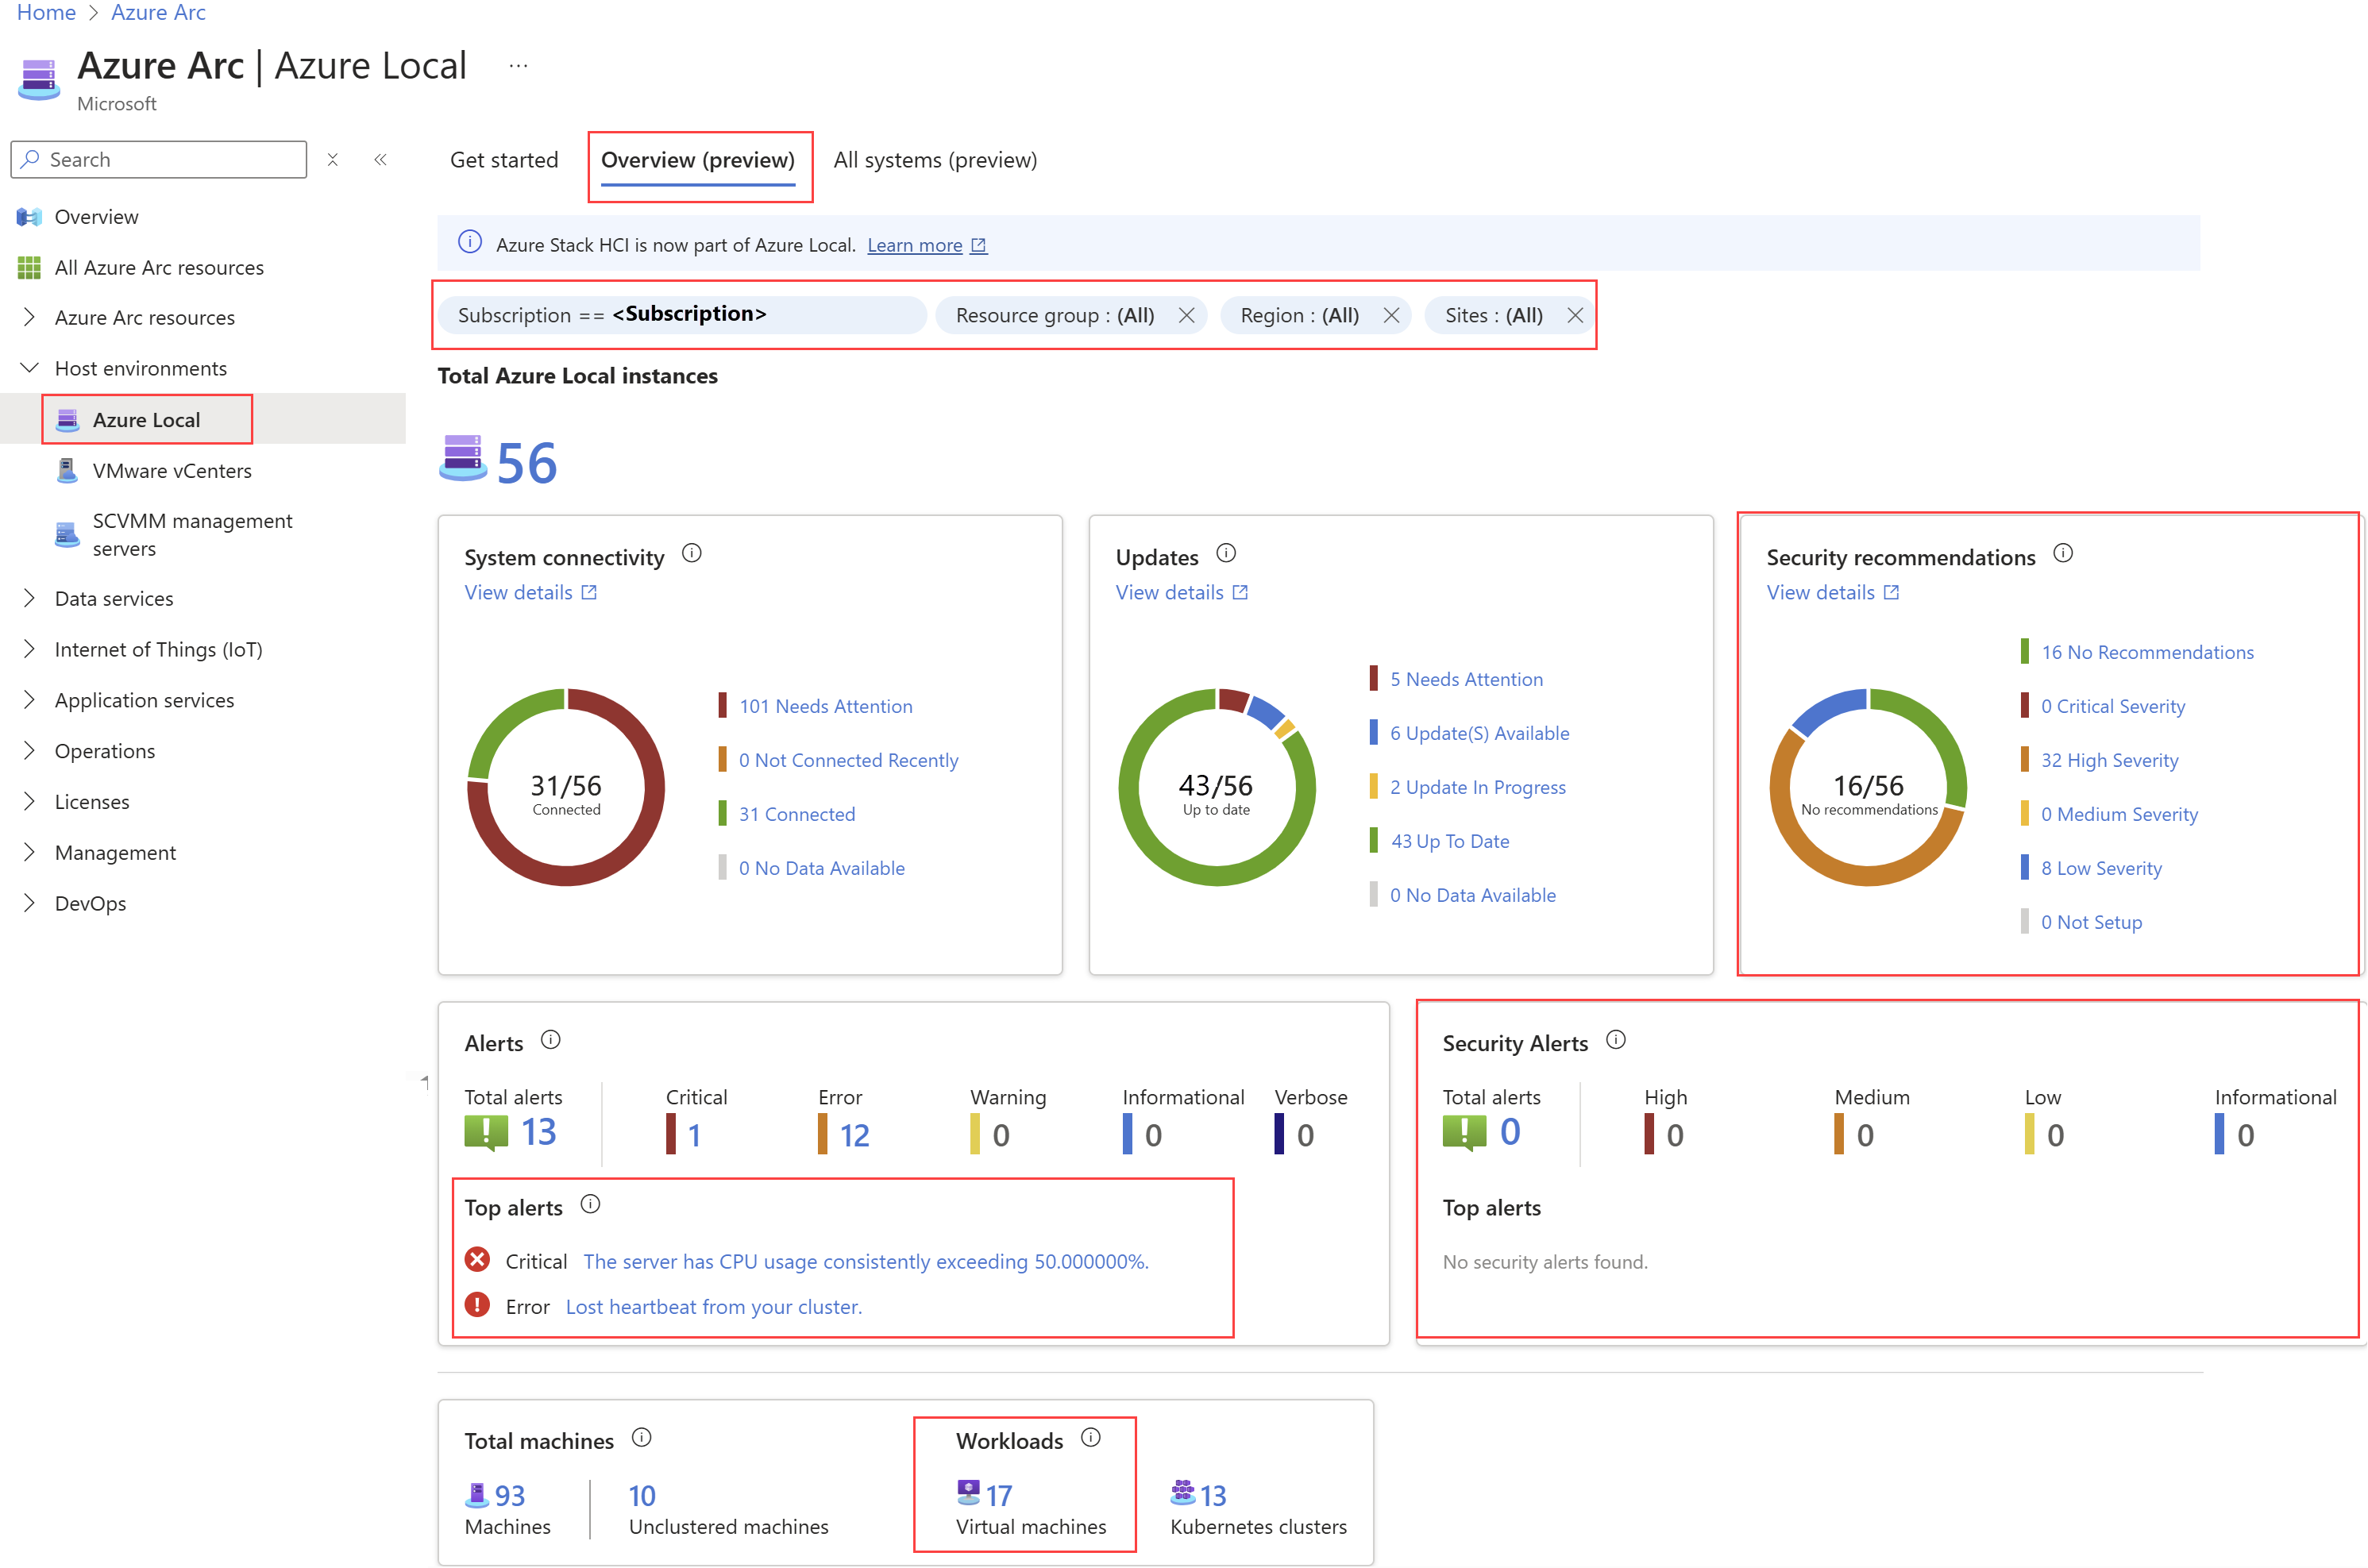
The Azure Local dashboard displays overview and detailed information about your systems in the form of charts.
To access the dashboard chart view, follow these steps in the Azure portal:
In Azure portal, go to Azure Arc > Host environments > Azure Local > Overview (preview).
You can filter the dashboard display by Subscription, Resource group, Region, and Sites.
In each tile, you can select the View details link or other labeled hyperlinks to open the corresponding dashboard or view more details.
Here are some sample screens that appear when you select different links on the various tiles:
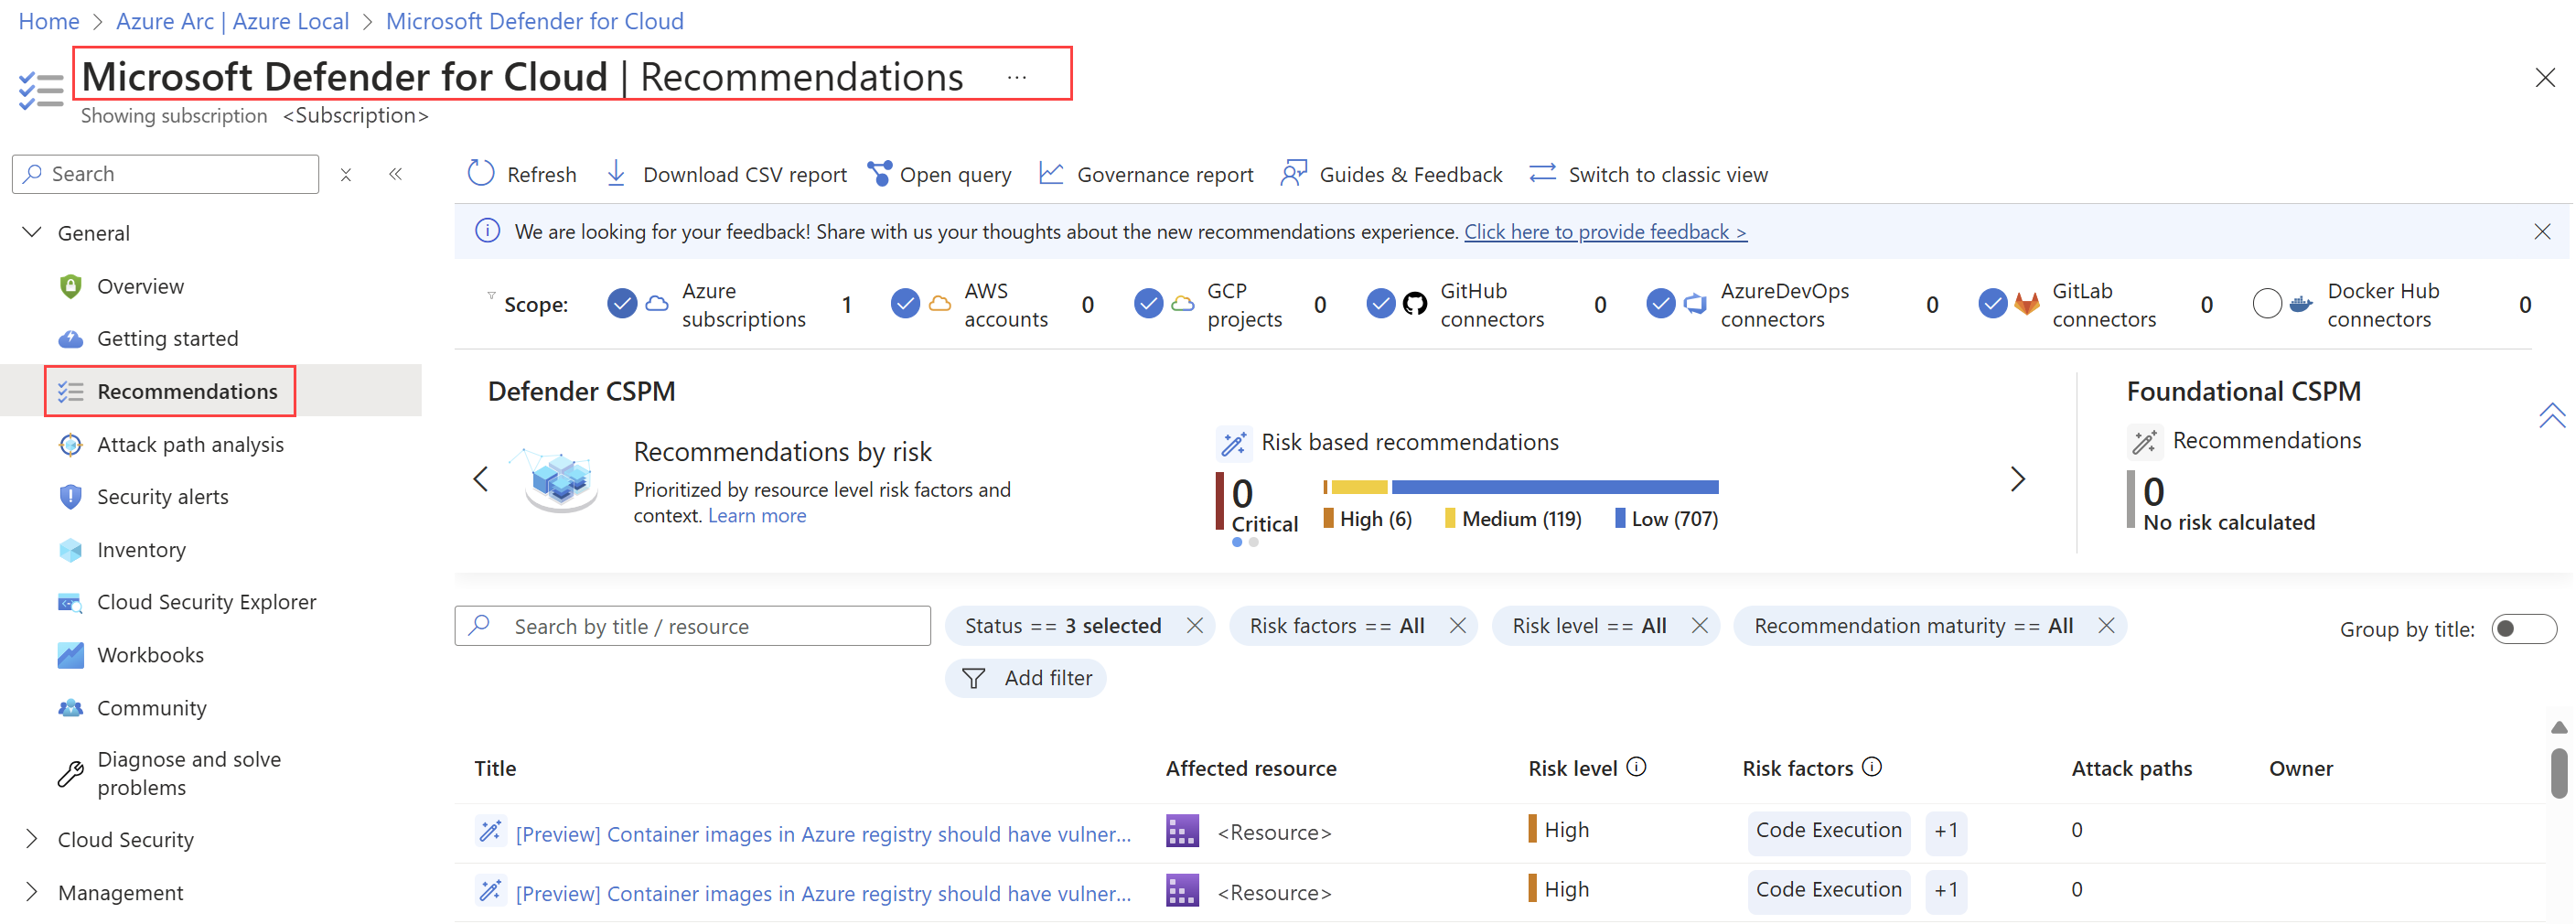
Security recommendations tile. Select the View details link to open the Microsoft Defender for Cloud > Recommendations dashboard.
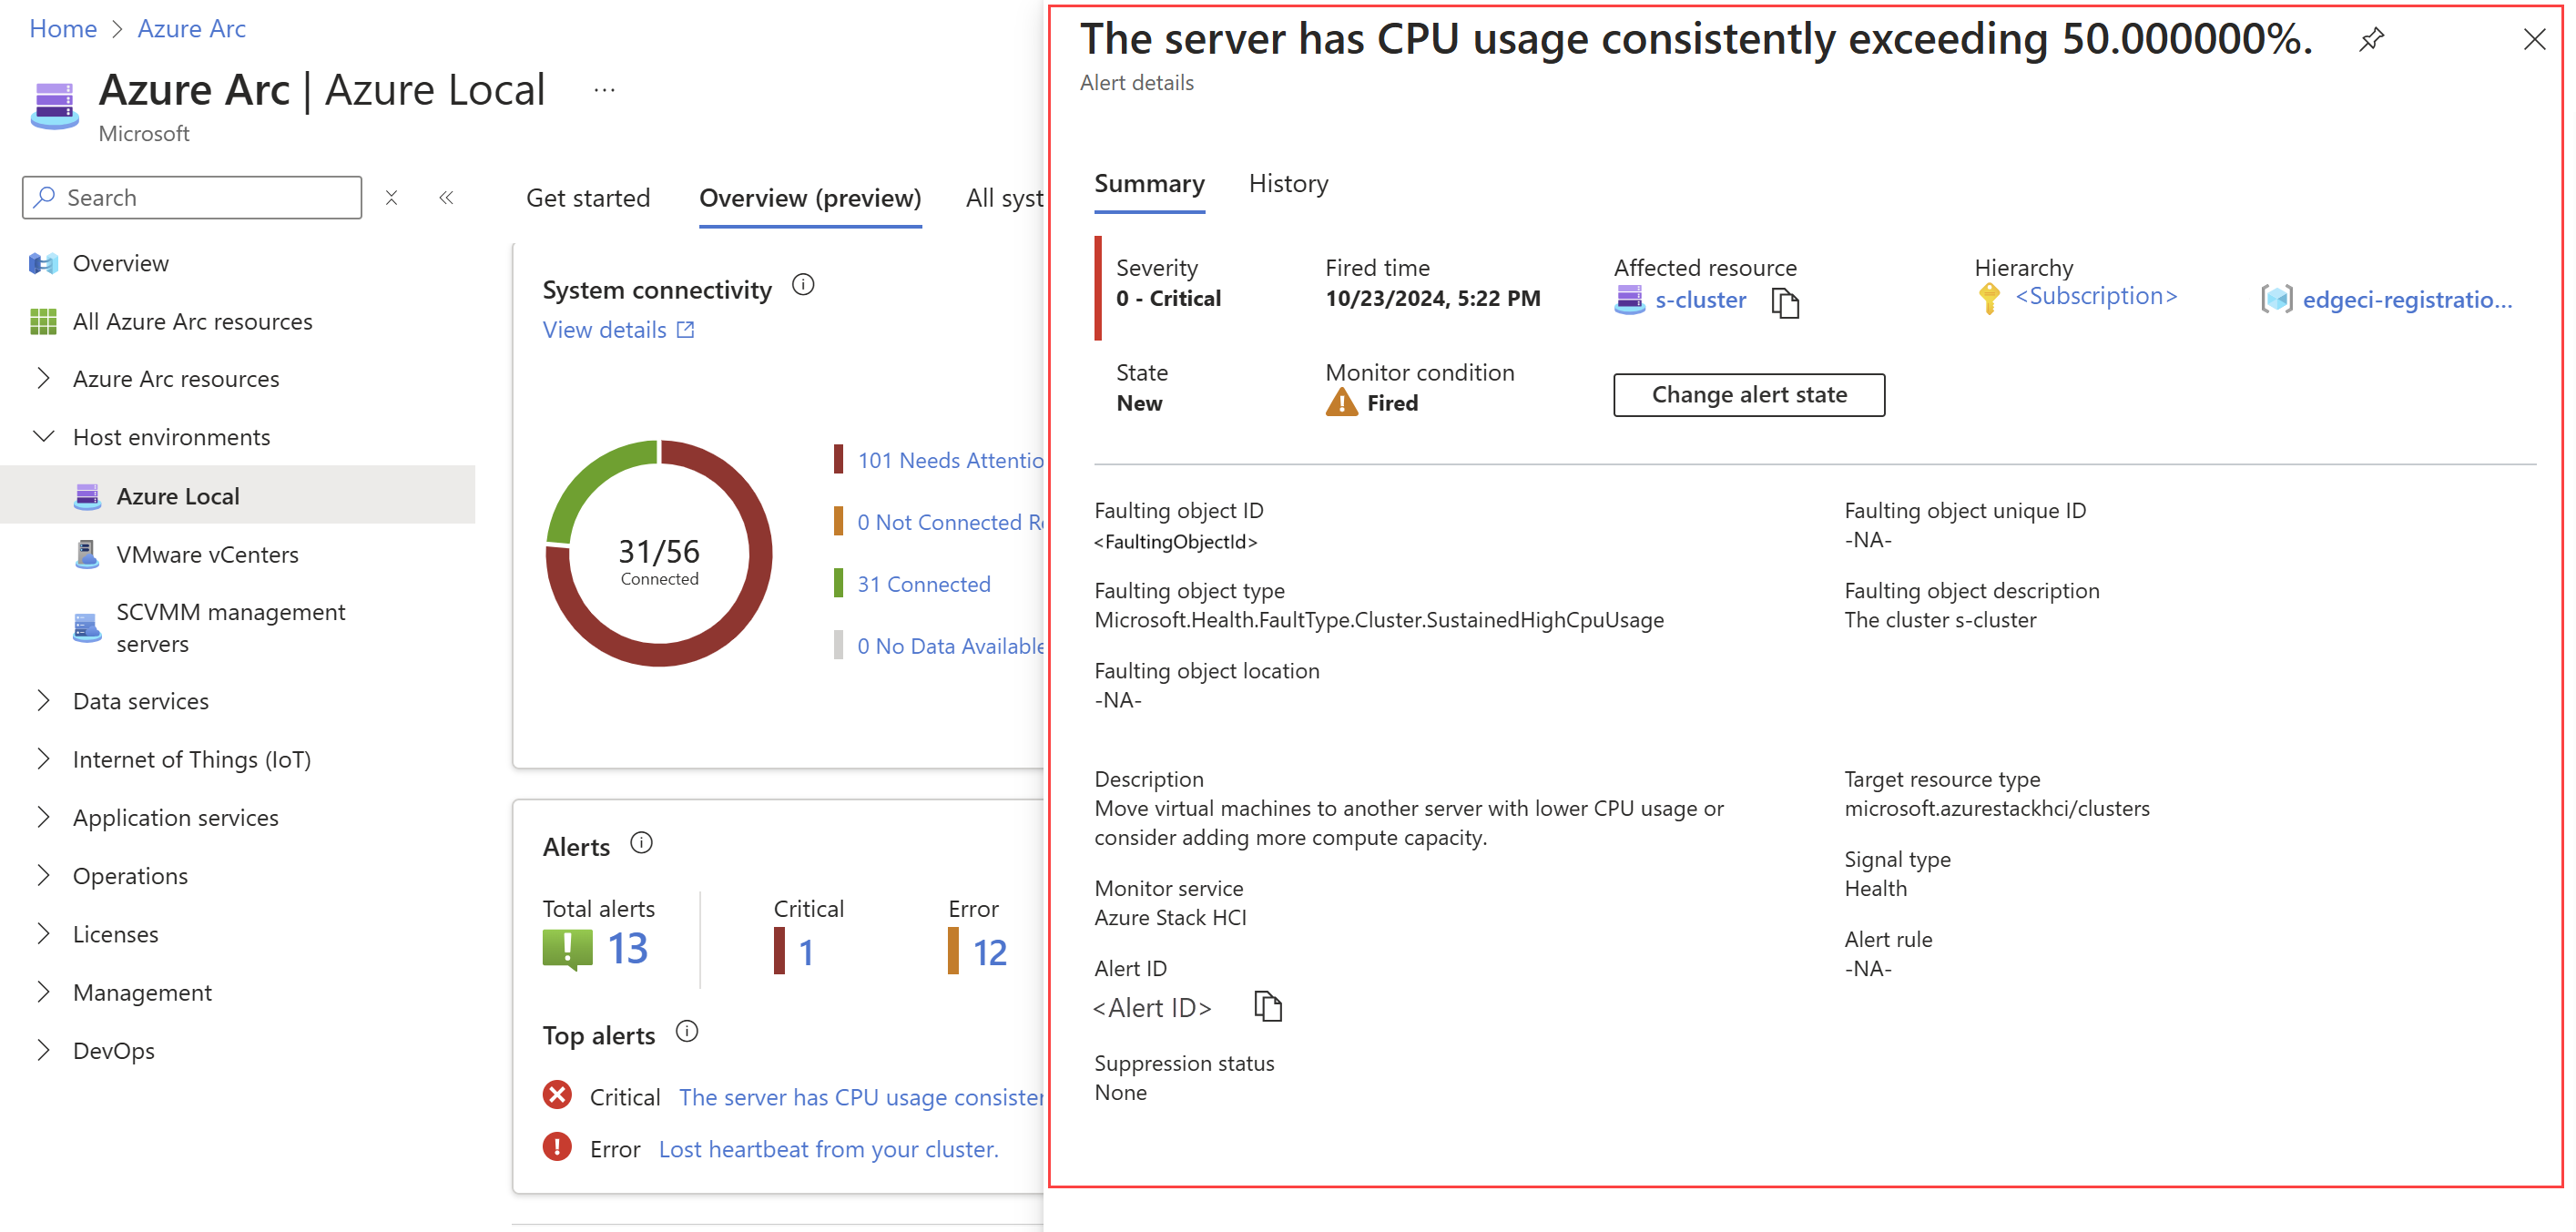
Alerts tile. Select Top alerts to view top alerts.
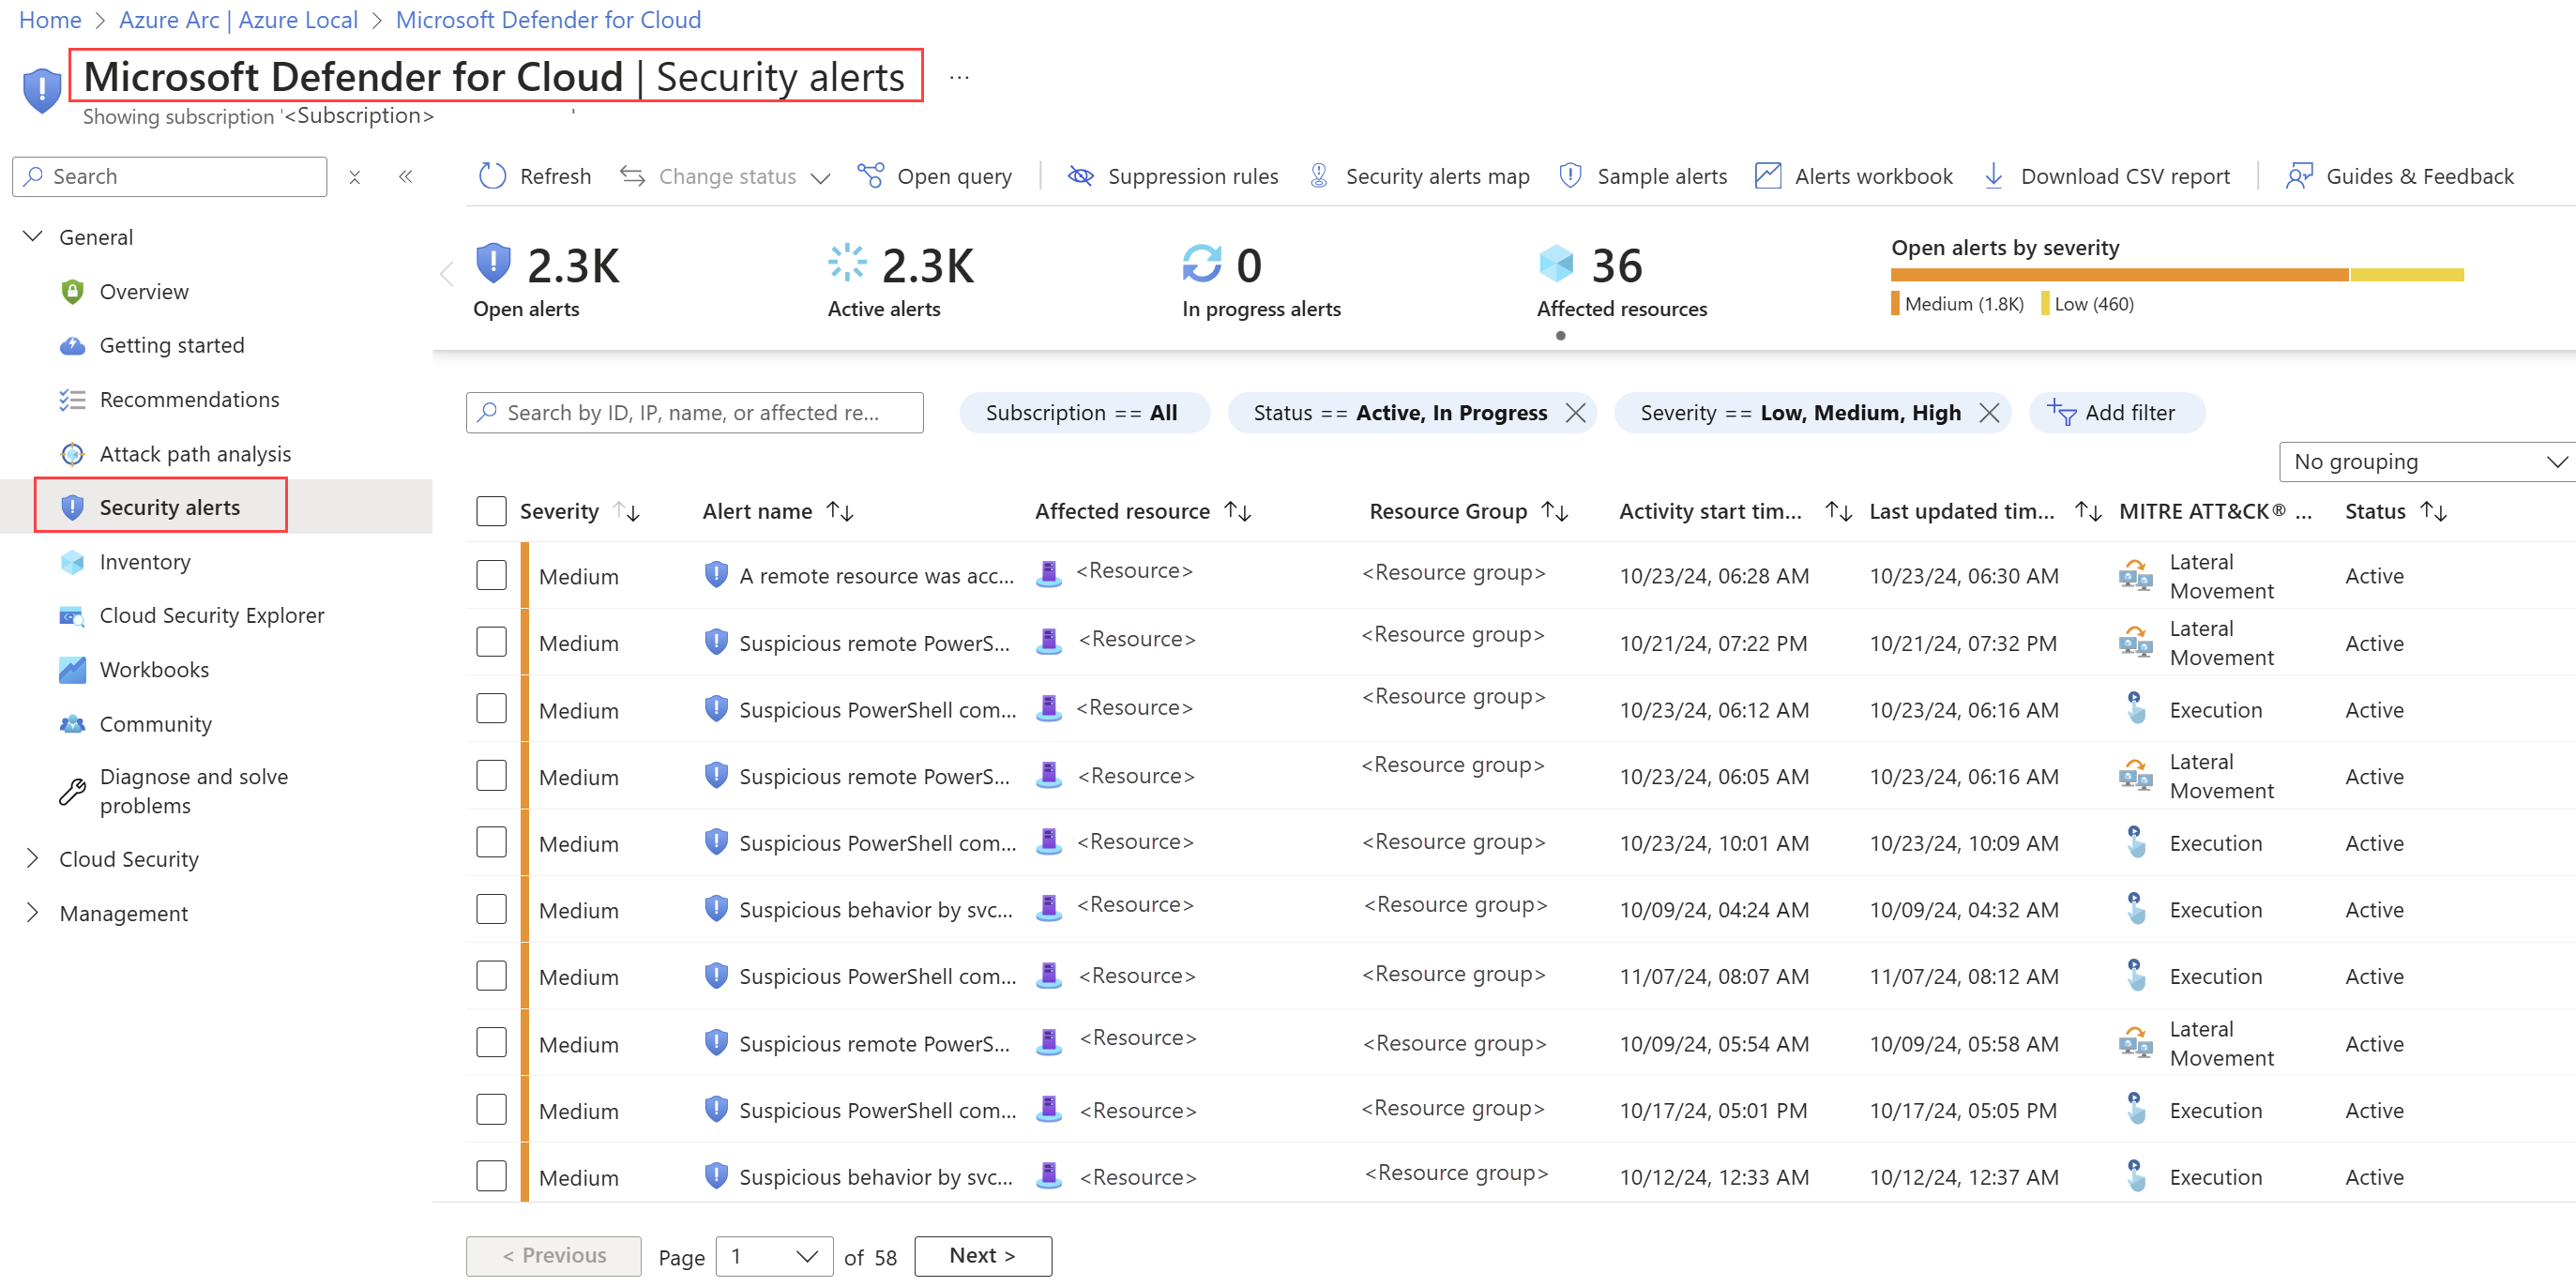
Security alerts tile. Select the View details link to open the Microsoft Defender for Cloud > Security alerts dashboard.
Total machines tile. Select Virtual machines under Workloads to view the VM workloads running on your Azure Local.
View the all systems list
The Azure Local All systems list view displays information about your systems.
To view the dashboard list view, follow these steps in the Azure portal:
In Azure portal, go to Azure Arc > Host environments > Azure Local > All systems (preview). The All systems page presents a hierarchical view of all your workloads within a system.
All columns can be sorted by selecting a column header. You can filter the dashboard display by subscription, resource group, region, and sites. You can also group display results by using the grouping control at the top right.
Select a system name to view details about a system, or select a parameter to view details about system status.
Troubleshooting
Issue: No data available
Use the following information when no system data is displayed in the All systems (preview) tab on the Azure portal dashboard. You might see No data available in the Updates column or in the Connection status column.
| Issue | Issue seen in | Resolution |
|---|---|---|
| Microsoft.Edge Resource Provider (RP) is not registered with your subscription. | Connection status | Use the following steps: 1. Run PowerShell as administrator. 2. Run the following cmdlet: Register-AzResourceProvider -ProviderNamespace "Microsoft.Edge" |
| The Microsoft.Edge RP isn't able to process data for the system. | Connection status | No action is required on your part. Azure Local service will automatically detect this condition and raise a Support ticket. |
| Your system isn't functioning. | Connection status | Your system is in Needs attention state. Bring up the system. |
| You have an older version system running Azure Local, version 22H2. This version can't be updated to Azure Local, version 23H2. | Updates and Connection status | Make sure to use an Azure Local, version 23H2 system. |
Next steps
- Learn about the various options available to monitor your Azure Local in What is Azure Local monitoring?.


