Note
This article relies on an open source library hosted on GitHub at: https://github.com/mspnp/spark-monitoring.
The original library supports Azure Databricks Runtimes 10.x (Spark 3.2.x) and earlier.
Databricks has contributed an updated version to support Azure Databricks Runtimes 11.0 (Spark 3.3.x) and above on the l4jv2 branch at: https://github.com/mspnp/spark-monitoring/tree/l4jv2.
Please note that the 11.0 release is not backward compatible due to the different logging systems used in the Databricks Runtimes. Be sure to use the correct build for your Databricks Runtime. The library and GitHub repository are in maintenance mode. There are no plans for further releases, and issue support will be best-effort only. For any additional questions regarding the library or the roadmap for monitoring and logging of your Azure Databricks environments, please contact azure-spark-monitoring-help@databricks.com.
This solution demonstrates observability patterns and metrics to improve the processing performance of a big data system that uses Azure Databricks.
Architecture
Download a Visio file of this architecture.
Workflow
The solution involves the following steps:
The server sends a large GZIP file that's grouped by customer to the Source folder in Azure Data Lake Storage.
Data Lake Storage then sends a successfully extracted customer file to Azure Event Grid, which turns the customer file data into several messages.
Azure Event Grid sends the messages to the Azure Queue Storage service, which stores them in a queue.
Azure Queue Storage sends the queue to the Azure Databricks data analytics platform for processing.
Azure Databricks unpacks and processes queue data into a processed file that it sends back to Data Lake Storage:
If the processed file is valid, it goes in the Landing folder.
Otherwise, the file goes in the Bad folder tree. Initially, the file goes in the Retry subfolder, and Data Lake Storage attempts customer file processing again (step 2). If a pair of retry attempts still leads to Azure Databricks returning processed files that aren't valid, the processed file goes in the Failure subfolder.
As Azure Databricks unpacks and processes data in the previous step, it also sends application logs and metrics to Azure Monitor for storage.
An Azure Log Analytics workspace applies Kusto queries on the application logs and metrics from Azure Monitor for troubleshooting and deep diagnostics.
Components
- Azure Data Lake Storage is a set of capabilities dedicated to big data analytics.
- Azure Event Grid allows a developer to easily build applications with event-based architectures.
- Azure Queue Storage is a service for storing large numbers of messages. It allows access to messages from anywhere in the world through authenticated calls using HTTP or HTTPS. You can use queues to create a backlog of work to process asynchronously.
- Azure Databricks is a data analytics platform optimized for the Azure cloud platform. One of the two environments Azure Databricks offers for developing data-intensive applications is Azure Databricks Workspace, an Apache Spark-based unified analytics engine for large-scale data processing.
- Azure Monitor collects and analyzes app telemetry, such as performance metrics and activity logs.
- Azure Log Analytics is a tool used to edit and run log queries with data.
Scenario details
Your development team can use observability patterns and metrics to find bottlenecks and improve the performance of a big data system. Your team has to do load testing of a high-volume stream of metrics on a high-scale application.
This scenario offers guidance for performance tuning. Since the scenario presents a performance challenge for logging per customer, it uses Azure Databricks, which can monitor these items robustly:
- Custom application metrics
- Streaming query events
- Application log messages
Azure Databricks can send this monitoring data to different logging services, such as Azure Log Analytics.
This scenario outlines the ingestion of a large set of data that has been grouped by customer and stored in a GZIP archive file. Detailed logs are unavailable from Azure Databricks outside of the real-time Apache Spark™ user interface, so your team needs a way to store all the data for each customer, and then benchmark and compare. With a large data scenario, it's important to find an optimal combination executor pool and virtual machine (VM) size for the fastest processing time. For this business scenario, the overall application relies on the speed of ingestion and querying requirements, so that system throughput doesn't degrade unexpectedly with increasing work volume. The scenario must guarantee that the system meets service-level agreements (SLAs) that are established with your customers.
Potential use cases
Scenarios that can benefit from this solution include:
- System health monitoring.
- Performance maintenance.
- Monitoring day-to-day system usage.
- Spotting trends that might cause future problems if unaddressed.
Considerations
These considerations implement the pillars of the Azure Well-Architected Framework, which is a set of guiding tenets that can be used to improve the quality of a workload. For more information, see Microsoft Azure Well-Architected Framework.
Keep these points in mind when considering this architecture:
Azure Databricks can automatically allocate the computing resources necessary for a large job, which avoids problems that other solutions introduce. For example, with Databricks-optimized autoscaling on Apache Spark, excessive provisioning may cause the suboptimal use of resources. Or you might not know the number of executors required for a job.
A queue message in Azure Queue Storage can be up to 64 KB in size. A queue may contain millions of queue messages, up to the total capacity limit of a storage account.
Cost Optimization
Cost Optimization is about looking at ways to reduce unnecessary expenses and improve operational efficiencies. For more information, see Design review checklist for Cost Optimization.
Use the Azure pricing calculator to estimate the cost of implementing this solution.
Deploy this scenario
Note
The deployment steps described here apply only to Azure Databricks, Azure Monitor, and Azure Log Analytics. Deployment of the other components isn't covered in this article.
To get all the logs and information of the process, set up Azure Log Analytics and the Azure Databricks monitoring library. The monitoring library streams Apache Spark level events and Spark Structured Streaming metrics from your jobs to Azure Monitor. You don't need to make any changes to your application code for these events and metrics.
The steps to set up performance tuning for a big data system are as follows:
In the Azure portal, create an Azure Databricks workspace. Copy and save the Azure subscription ID (a globally unique identifier (GUID)), resource group name, Databricks workspace name, and workspace portal URL for later use.
In a web browser, go to the Databricks workspace URL and generate a Databricks personal access token. Copy and save the token string that appears (which begins with
dapiand a 32-character hexadecimal value) for later use.Clone the mspnp/spark-monitoring GitHub repository onto your local computer. This repository has the source code for the following components:
- The Azure Resource Manager template (ARM template) for creating an Azure Log Analytics workspace, which also installs prebuilt queries for collecting Spark metrics
- Azure Databricks monitoring libraries
- The sample application for sending application metrics and application logs from Azure Databricks to Azure Monitor
Using the Azure CLI command for deploying an ARM template, create an Azure Log Analytics workspace with prebuilt Spark metric queries. From the command output, copy and save the generated name for the new Log Analytics workspace (in the format spark-monitoring-<randomized-string>).
In the Azure portal, copy and save your Log Analytics workspace ID and key for later use.
Install the Community Edition of IntelliJ IDEA, an integrated development environment (IDE) that has built-in support for the Java Development Kit (JDK) and Apache Maven. Add the Scala plug-in.
Using IntelliJ IDEA, build the Azure Databricks monitoring libraries. To do the actual build step, select View > Tool Windows > Maven to show the Maven tools window, and then select Execute Maven Goal > mvn package.
Using a Python package installation tool, install the Azure Databricks CLI and set up authentication with the Databricks personal access token you copied earlier.
Configure the Azure Databricks workspace by modifying the Databricks init script with the Databricks and Log Analytics values you copied earlier, and then using the Azure Databricks CLI to copy the init script and the Azure Databricks monitoring libraries to your Databricks workspace.
In your Databricks workspace portal, create and configure an Azure Databricks cluster.
In IntelliJ IDEA, build the sample application using Maven. Then in your Databricks workspace portal, run the sample application to generate sample logs and metrics for Azure Monitor.
While the sample job is running in Azure Databricks, go to the Azure portal to view and query the event types (application logs and metrics) in the Log Analytics interface:
- Select Tables > Custom Logs to view the table schema for Spark listener events (SparkListenerEvent_CL), Spark logging events (SparkLoggingEvent_CL), and Spark metrics (SparkMetric_CL).
- Select Query explorer > Saved Queries > Spark Metrics to view and run the queries that were added when you created the Log Analytics workspace.
Read more about viewing and running prebuilt and custom queries in the next section.
Query the logs and metrics in Azure Log Analytics
Access prebuilt queries
The prebuilt query names for retrieving Spark metrics are listed below.
- % CPU Time Per Executor
- % Deserialize Time Per Executor
- % JVM Time Per Executor
- % Serialize Time Per Executor
- Disk Bytes Spilled
- Error Traces (Bad Record Or Bad Files)
- File System Bytes Read Per Executor
- File System Bytes Write Per Executor
- Job Errors Per Job
- Job Latency Per Job (Batch Duration)
- Job Throughput
- Running Executors
- Shuffle Bytes Read
- Shuffle Bytes Read Per Executor
- Shuffle Bytes Read To Disk Per Executor
- Shuffle Client Direct Memory
- Shuffle Client Memory Per Executor
- Shuffle Disk Bytes Spilled Per Executor
- Shuffle Heap Memory Per Executor
- Shuffle Memory Bytes Spilled Per Executor
- Stage Latency Per Stage (Stage Duration)
- Stage Throughput Per Stage
- Streaming Errors Per Stream
- Streaming Latency Per Stream
- Streaming Throughput Input Rows/Sec
- Streaming Throughput Processed Rows/Sec
- Sum Task Execution Per Host
- Task Deserialization Time
- Task Errors Per Stage
- Task Executor Compute Time (Data Skew Time)
- Task Input Bytes Read
- Task Latency Per Stage (Tasks Duration)
- Task Result Serialization Time
- Task Scheduler Delay Latency
- Task Shuffle Bytes Read
- Task Shuffle Bytes Written
- Task Shuffle Read Time
- Task Shuffle Write Time
- Task Throughput (Sum Of Tasks Per Stage)
- Tasks Per Executor (Sum Of Tasks Per Executor)
- Tasks Per Stage
Write custom queries
You can also write your own queries in Kusto Query Language (KQL). Just select the top middle pane, which is editable, and customize the query to meet your needs.
The following two queries pull data from the Spark logging events:
SparkLoggingEvent_CL | where logger_name_s contains "com.microsoft.pnp"
SparkLoggingEvent_CL
| where TimeGenerated > ago(7d)
| project TimeGenerated, clusterName_s, logger_name_s
| summarize Count=count() by clusterName_s, logger_name_s, bin(TimeGenerated, 1h)
And these two examples are queries on the Spark metrics log:
SparkMetric_CL
| where name_s contains "executor.cpuTime"
| extend sname = split(name_s, ".")
| extend executor=strcat(sname[0], ".", sname[1])
| project TimeGenerated, cpuTime=count_d / 100000
SparkMetric_CL
| where name_s contains "driver.jvm.total."
| where executorId_s == "driver"
| extend memUsed_GB = value_d / 1000000000
| project TimeGenerated, name_s, memUsed_GB
| summarize max(memUsed_GB) by tostring(name_s), bin(TimeGenerated, 1m)
Query terminology
The following table explains some of the terms that are used when you construct a query of application logs and metrics.
| Term | ID | Remarks |
|---|---|---|
| Cluster_init | Application ID | |
| Queue | Run ID | One run ID equals multiple batches. |
| Batch | Batch ID | One batch equals two jobs. |
| Job | Job ID | One job equals two stages. |
| Stage | Stage ID | One stage has 100-200 task IDs depending on the task (read, shuffle, or write). |
| Tasks | Task ID | One task is assigned to one executor. One task is assigned to do a partitionBy for one partition. For about 200 customers, there should be 200 tasks. |
The following sections contain the typical metrics used in this scenario for monitoring system throughput, Spark job running status, and system resources usage.
System throughput
| Name | Measurement | Units |
|---|---|---|
| Stream throughput | Average input rate over average processed rate per minute | Rows per minute |
| Job duration | Average ended Spark job duration per minute | Durations per minute |
| Job count | Average number of ended Spark jobs per minute | Number of jobs per minute |
| Stage duration | Average completed stages duration per minute | Durations per minute |
| Stage count | Average number of completed stages per minute | Number of stages per minute |
| Task duration | Average finished tasks duration per minute | Durations per minute |
| Task count | Average number of finished tasks per minute | Number of tasks per minute |
Spark job running status
| Name | Measurement | Units |
|---|---|---|
| Scheduler pool count | Number of distinct count of scheduler pools per minute (number of queues operating) | Number of scheduler pools |
| Number of running executors | Number of running executors per minute | Number of running executors |
| Error trace | All error logs with Error level and the corresponding tasks/stage ID (shown in thread_name_s) |
System resources usage
| Name | Measurement | Units |
|---|---|---|
| Average CPU usage per executor/overall | Percent of CPU used per executor per minute | % per minute |
| Average used direct memory (MB) per host | Average used direct memory per executors per minute | MB per minute |
| Spilled memory per host | Average spilled memory per executor | MB per minute |
| Monitor data skew impact on duration | Measure range and difference of 70th-90th percentile and 90th-100th percentile in tasks duration | Net difference among 100%, 90%, and 70%; percentage difference among 100%, 90%, and 70% |
Decide how to relate the customer input, which was combined into a GZIP archive file, to a particular Azure Databricks output file, since Azure Databricks handles the whole batch operation as a unit. Here, you apply granularity to the tracing. You also use custom metrics to trace one output file to the original input file.
For more detailed definitions of each metric, see Visualizations in the dashboards on this website, or see the Metrics section in the Apache Spark documentation.
Assess performance tuning options
Baseline definition
You and your development team should establish a baseline, so that you can compare future states of the application.
Measure the performance of your application quantitatively. In this scenario, the key metric is job latency, which is typical of most data preprocessing and ingestion. Attempt to accelerate the data processing time and focus on measuring latency, as in the chart below:
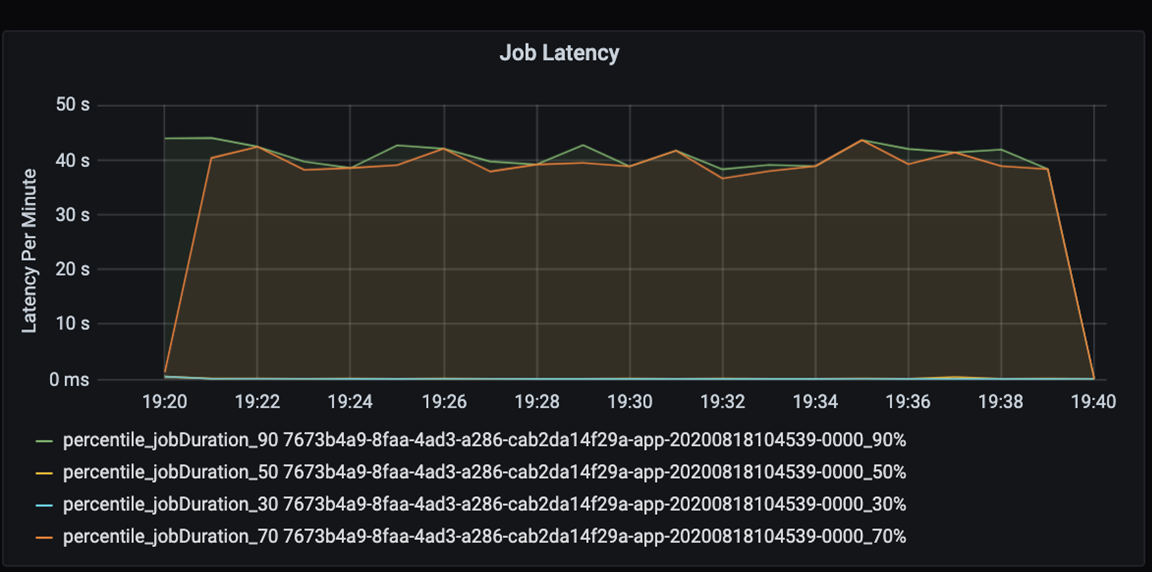
Measure the execution latency for a job: a coarse view on the overall job performance, and the job execution duration from start to completion (microbatch time). In the chart above, at the 19:30 mark, it takes about 40 seconds in duration to process the job.
If you look further into those 40 seconds, you see the data below for stages:
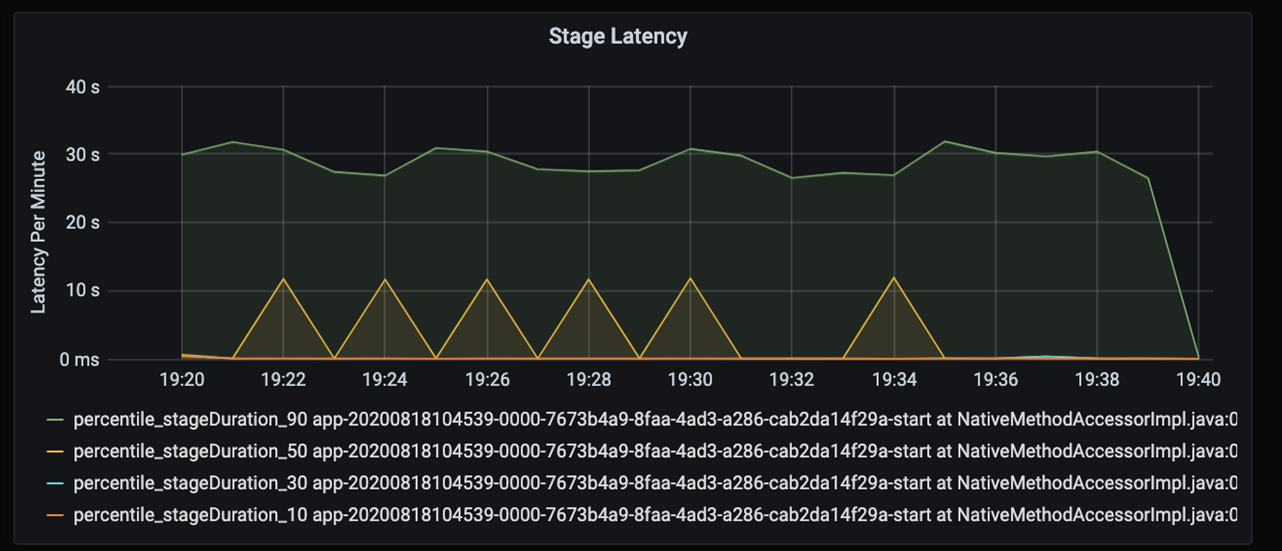
At the 19:30 mark, there are two stages: an orange stage of 10 seconds, and a green stage at 30 seconds. Monitor whether a stage spikes, because a spike indicates a delay in a stage.
Investigate when a certain stage is running slowly. In the partitioning scenario, there are typically at least two stages: one stage to read a file, and the other stage to shuffle, partition, and write the file. If you have high stage latency mostly in the writing stage, you might have a bottleneck problem during partitioning.
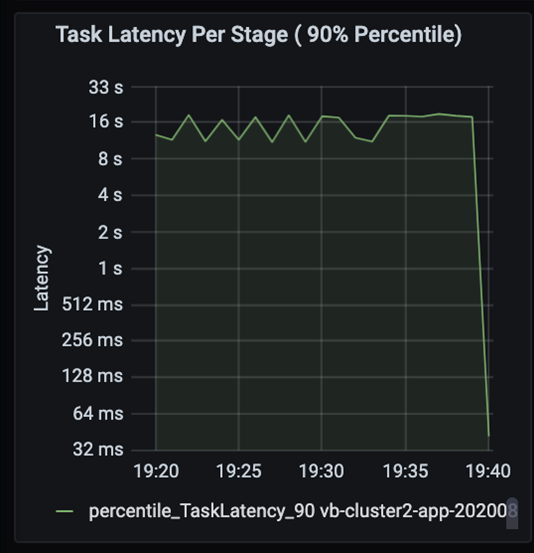
Observe the tasks as the stages in a job execute sequentially, with earlier stages blocking later stages. Within a stage, if one task executes a shuffle partition slower than other tasks, all tasks in the cluster must wait for the slower task to finish for the stage to complete. Tasks are then a way to monitor data skew and possible bottlenecks. In the chart above, you can see that all of the tasks are evenly distributed.
Now monitor the processing time. Because you have a streaming scenario, look at the streaming throughput.
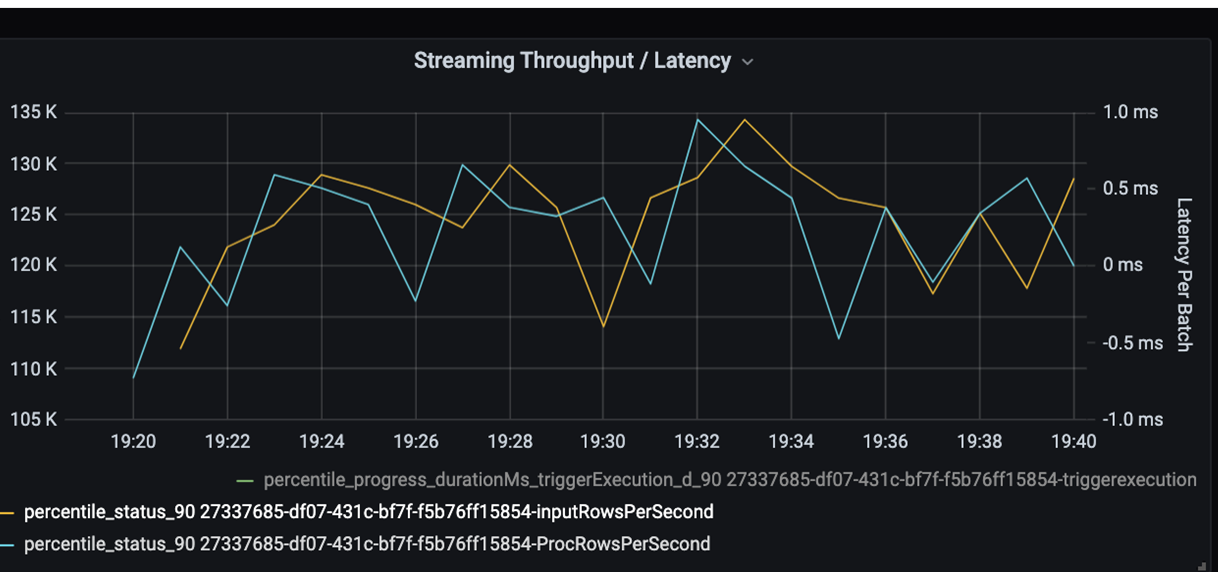
In the streaming throughput/batch latency chart above, the orange line represents input rate (input rows per second). The blue line represents the processing rate (processed rows per second). At some points, the processing rate doesn't catch the input rate. The potential issue is that input files are piling up in the queue.
Because the processing rate doesn't match the input rate in the graph, look to improve the process rate to cover the input rate fully. One possible reason might be the imbalance of customer data in each partition key that leads to a bottleneck. For a next step and potential solution, take advantage of the scalability of Azure Databricks.
Partitioning investigation
First, further identify the correct number of scaling executors that you need with Azure Databricks. Apply the rule of thumb of assigning each partition with a dedicated CPU in running executors. For instance, if you have 200 partition keys, the number of CPUs multiplied by the number of executors should equal 200. (For example, eight CPUs combined with 25 executors would be a good match.) With 200 partition keys, each executor can work only on one task, which reduces the chance of a bottleneck.
Because some slow partitions are in this scenario, investigate the high variance in tasks duration. Check for any spikes in task duration. One task handles one partition. If a task requires more time, the partition may be too large and cause a bottleneck.

Error tracing
Add a dashboard for error tracing so that you can spot customer-specific data failures. In data preprocessing, there are times when files are corrupted, and records within a file don't match the data schema. The following dashboard catches many bad files and bad records.
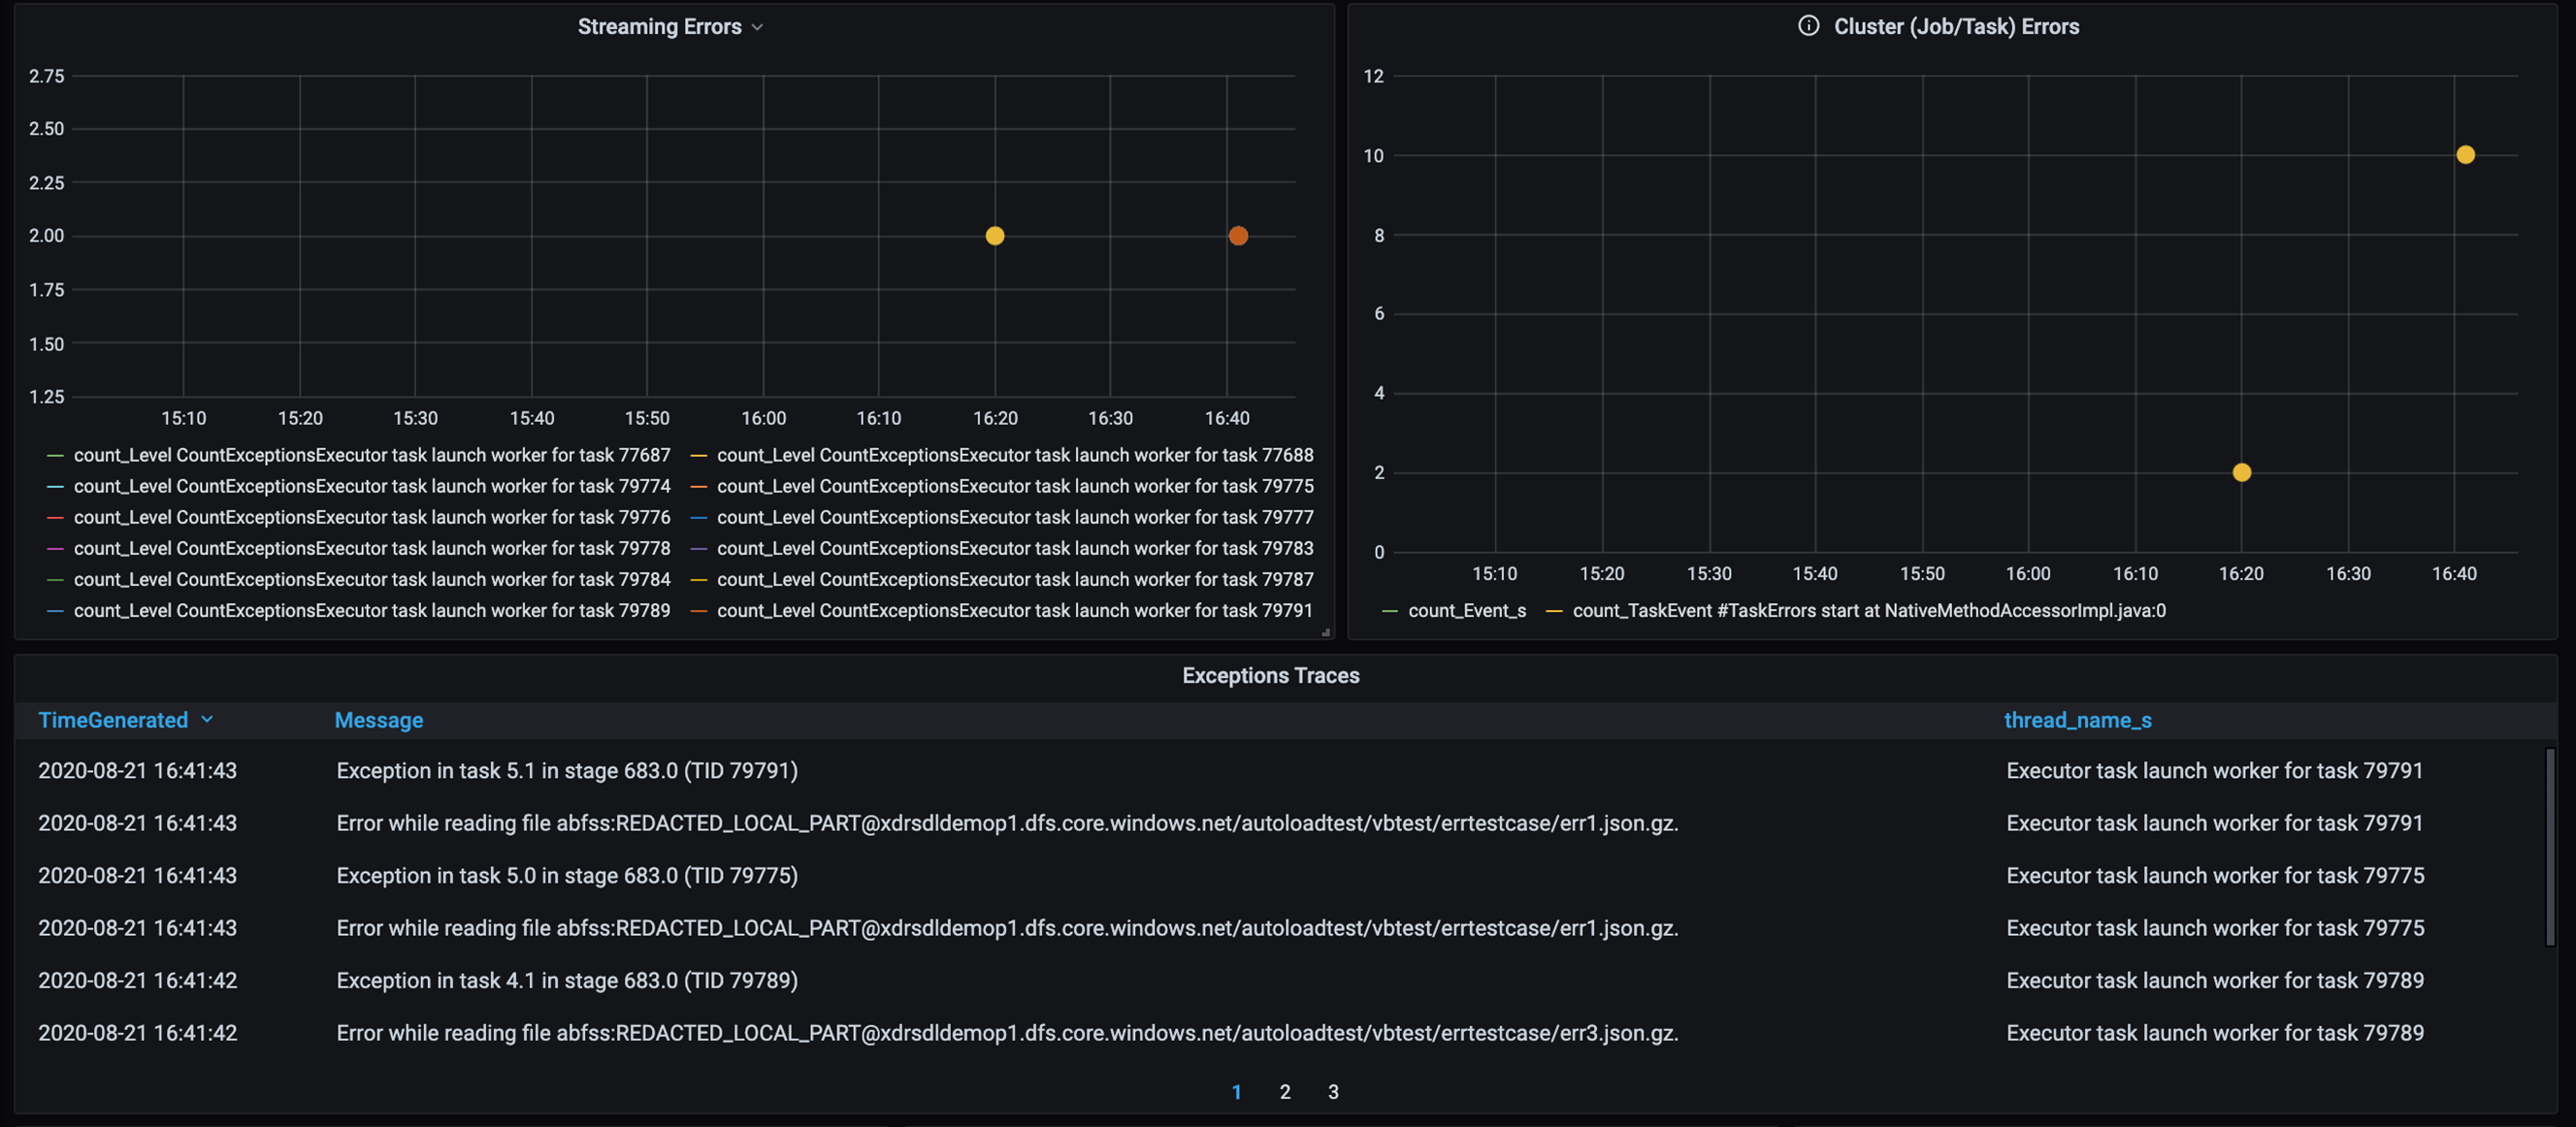
This dashboard displays the error count, error message, and task ID for debugging. In the message, you can easily trace the error back to the error file. There are several files in error while reading. You review the top timeline and investigate at the specific points in our graph (16:20 and 16:40).
Other bottlenecks
For more examples and guidance, see Troubleshoot performance bottlenecks in Azure Databricks.
Performance tuning assessment summary
For this scenario, these metrics identified the following observations:
- In the stage latency chart, writing stages take most of the processing time.
- In the task latency chart, task latency is stable.
- In the streaming throughput chart, the output rate is lower than the input rate at some points.
- In the task's duration table, there's task variance because of imbalance of customer data.
- To get optimized performance in the partitioning stage, the number of scaling executors should match the number of partitions.
- There are tracing errors, such as bad files and bad records.
To diagnose these issues, you used the following metrics:
- Job latency
- Stage latency
- Task latency
- Streaming throughput
- Task duration (max, mean, min) per stage
- Error trace (count, message, task ID)
Contributors
This article is maintained by Microsoft. It was originally written by the following contributors.
Principal author:
- David McGhee | Principal Program Manager
To see non-public LinkedIn profiles, sign in to LinkedIn.
Next steps
- Read the Log Analytics tutorial.
- Monitoring Azure Databricks in an Azure Log Analytics workspace
- Deployment of Azure Log Analytics with Spark metrics
- Observability patterns