Troubleshoot HTTP 502 and 503 errors in Azure App Service
HTTP "502 Bad Gateway" and "503 Service Unavailable" are common errors that you can get when you try to open your app that's hosted in Azure App Service. This article helps you troubleshoot these errors.
If you need more help at any point in this article, you can contact the Azure experts on the MSDN Azure and Stack Overflow forums. Alternatively, you can file an Azure support incident on the Azure Support site by selecting Get Support.
The cause of these errors is often an application-level problem, such as:
- Requests are taking a long time.
- The app is using high memory or CPU.
- An exception is preventing the app from responding.
Troubleshooting consists of three tasks, in sequential order:
- Observe and monitor application behavior.
- Collect data.
- Mitigate the problem.
App Service gives you options for each task.
Observe and monitor application behavior
Track service health
Azure publicizes service interruptions and performance degradations in App Service. You can track the health of the service in the Azure portal. For more information, see View service health notifications by using the Azure portal.
Monitor your app
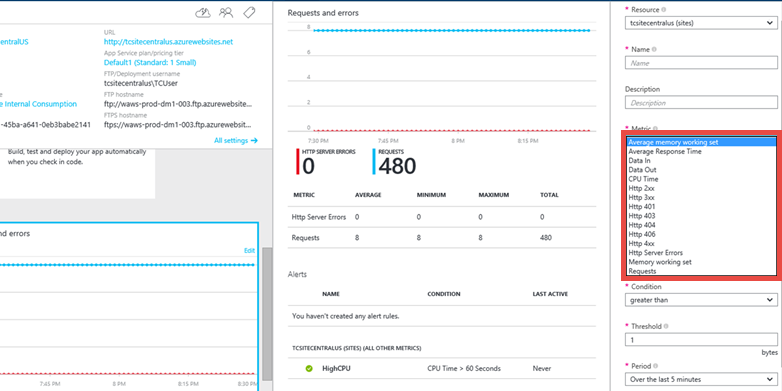
You can monitor your app to find out if it's having any problems. On the Azure portal page for your app, select the Requests and errors tile. The Metric box shows you all the metrics that you can add.
Some of the metrics that you might want to monitor for your app are:
- Average memory working set
- Average response time
- CPU time
- Memory working set
- Requests
For more information, see:
Collect data
Use the diagnostics feature
App Service provides an intelligent and interactive experience to help you troubleshoot your app, with no configuration required. The diagnostics feature can discover a problem and guide you to the right information for troubleshooting and resolution.
To access App Service diagnostics, go to your App Service app or App Service Environment in the Azure portal. On the left menu, select Diagnose and solve problems.
Use the Kudu debug console
App Service comes with a console that you can use for debugging, exploring, and uploading files. It also provides JSON endpoints that you can use to get information about your environment. This console is part of the Kudu dashboard for your app.
You can access the dashboard by going to the link https://<Your app name>.scm.azurewebsites.net/.
Kudu provides:
- Environment settings for your application.
- A log stream.
- A diagnostic dump.
- The debug console, in which you can run PowerShell cmdlets and basic DOS commands.
If your application is throwing first-chance exceptions, you can use Kudu and the Sysinternals tool ProcDump to create memory dumps. These memory dumps are snapshots of the process and can often help you troubleshoot more complicated problems with your app.
For more information on features available in Kudu, see the blog post Kudu Dashboard explained - WordPress on App Service.
Mitigate the problem
Scale the app
In Azure App Service, for increased performance and throughput, you can adjust the scale at which you run your application. Scaling up an app involves two related actions:
- Changing your App Service plan to a higher pricing tier
- Configuring certain settings after you switch to a higher pricing tier
For more information on scaling, see Scale an app in Azure App Service.
Additionally, you can choose to run your application on more than one instance. This choice not only provides you with more processing capability but also gives you some amount of fault tolerance. If the process goes down on one instance, the other instance continues to serve requests.
You can set the scaling to be manual or automatic.
Use auto-healing
Auto-healing recycles the worker process for your app based on settings that you choose. The settings include configuration changes, requests, memory-based limits, or the time needed to execute a request.
Most of the time, recycling the process is the fastest way to recover from a problem. Though you can always restart the app directly in the Azure portal, auto-healing can do it automatically for you. All you need to do is add some triggers in the root Web.config file for your app. These settings work in the same way even if your application is not a .NET one.
For more information, see Azure App Service diagnostics overview.
Restart the app
Restarting your app is often the simplest way to recover from one-time problems. On the Azure portal page for your app, you have the option to stop or restart your app.

You can also manage your app by using Azure PowerShell. For more information, see Manage Azure resources by using Azure PowerShell.