Monitor Azure OpenAI
This article describes:
- The types of monitoring data you can collect for this service.
- Ways to analyze that data.
Note
If you're already familiar with this service and/or Azure Monitor and just want to know how to analyze monitoring data, see the Analyze section near the end of this article.
When you have critical applications and business processes that rely on Azure resources, you need to monitor and get alerts for your system. The Azure Monitor service collects and aggregates metrics and logs from every component of your system. Azure Monitor provides you with a view of availability, performance, and resilience, and notifies you of issues. You can use the Azure portal, PowerShell, Azure CLI, REST API, or client libraries to set up and view monitoring data.
- For more information on Azure Monitor, see the Azure Monitor overview.
- For more information on how to monitor Azure resources in general, see Monitor Azure resources with Azure Monitor.
Dashboards
Azure OpenAI provides out-of-box dashboards for each of your Azure OpenAI resources. To access the monitoring dashboards sign-in to https://portal.azure.com and select the overview pane for one of your Azure OpenAI resources.

The dashboards are grouped into four categories: HTTP Requests, Tokens-Based Usage, PTU Utilization, and Fine-tuning.
Data collection and routing in Azure Monitor
Azure OpenAI collects the same kinds of monitoring data as other Azure resources. You can configure Azure Monitor to generate data in activity logs, resource logs, virtual machine logs, and platform metrics. For more information, see Monitoring data from Azure resources.
Platform metrics and the Azure Monitor activity log are collected and stored automatically. This data can be routed to other locations by using a diagnostic setting. Azure Monitor resource logs aren't collected and stored until you create a diagnostic setting and then route the logs to one or more locations.
When you create a diagnostic setting, you specify which categories of logs to collect. For more information about creating a diagnostic setting by using the Azure portal, the Azure CLI, or PowerShell, see Create diagnostic setting to collect platform logs and metrics in Azure.
Keep in mind that using diagnostic settings and sending data to Azure Monitor Logs has other costs associated with it. For more information, see Azure Monitor Logs cost calculations and options.
The metrics and logs that you can collect are described in the following sections.
Resource types
Azure uses the concept of resource types and IDs to identify everything in a subscription. Resource types are also part of the resource IDs for every resource running in Azure. For example, one resource type for a virtual machine is Microsoft.Compute/virtualMachines. For a list of services and their associated resource types, see Resource providers.
Azure Monitor similarly organizes core monitoring data into metrics and logs based on resource types, also called namespaces. Different metrics and logs are available for different resource types. Your service might be associated with more than one resource type.
For more information about the resource types for Azure OpenAI, see Azure OpenAI monitoring data reference.
Data storage
For Azure Monitor:
- Metrics data is stored in the Azure Monitor metrics database.
- Log data is stored in the Azure Monitor logs store. Log Analytics is a tool in the Azure portal that can query this store.
- The Azure activity log is a separate store with its own interface in the Azure portal.
You can optionally route metric and activity log data to the Azure Monitor logs store. You can then use Log Analytics to query the data and correlate it with other log data.
Many services can use diagnostic settings to send metric and log data to other storage locations outside Azure Monitor. Examples include Azure Storage, hosted partner systems, and non-Azure partner systems, by using Event Hubs.
For detailed information on how Azure Monitor stores data, see Azure Monitor data platform.
Azure Monitor platform metrics
Azure Monitor provides platform metrics for most services. These metrics are:
- Individually defined for each namespace.
- Stored in the Azure Monitor time-series metrics database.
- Lightweight and capable of supporting near real-time alerting.
- Used to track the performance of a resource over time.
Collection: Azure Monitor collects platform metrics automatically. No configuration is required.
Routing: You can also route some platform metrics to Azure Monitor Logs / Log Analytics so you can query them with other log data. Check the DS export setting for each metric to see if you can use a diagnostic setting to route the metric to Azure Monitor Logs / Log Analytics.
- For more information, see the Metrics diagnostic setting.
- To configure diagnostic settings for a service, see Create diagnostic settings in Azure Monitor.
For a list of all metrics it's possible to gather for all resources in Azure Monitor, see Supported metrics in Azure Monitor.
Azure OpenAI has commonality with a subset of Azure AI services. For a list of available metrics for Azure OpenAI, see Azure OpenAI monitoring data reference.
Azure Monitor resource logs
Resource logs provide insight into operations that were done by an Azure resource. Logs are generated automatically, but you must route them to Azure Monitor logs to save or query them. Logs are organized in categories. A given namespace might have multiple resource log categories.
Collection: Resource logs aren't collected and stored until you create a diagnostic setting and route the logs to one or more locations. When you create a diagnostic setting, you specify which categories of logs to collect. There are multiple ways to create and maintain diagnostic settings, including the Azure portal, programmatically, and though Azure Policy.
Routing: The suggested default is to route resource logs to Azure Monitor Logs so you can query them with other log data. Other locations such as Azure Storage, Azure Event Hubs, and certain Microsoft monitoring partners are also available. For more information, see Azure resource logs and Resource log destinations.
For detailed information about collecting, storing, and routing resource logs, see Diagnostic settings in Azure Monitor.
For a list of all available resource log categories in Azure Monitor, see Supported resource logs in Azure Monitor.
All resource logs in Azure Monitor have the same header fields, followed by service-specific fields. The common schema is outlined in Azure Monitor resource log schema.
For the available resource log categories, their associated Log Analytics tables, and the log schemas for Azure OpenAI, see Azure OpenAI monitoring data reference.
Azure activity log
The activity log contains subscription-level events that track operations for each Azure resource as seen from outside that resource; for example, creating a new resource or starting a virtual machine.
Collection: Activity log events are automatically generated and collected in a separate store for viewing in the Azure portal.
Routing: You can send activity log data to Azure Monitor Logs so you can analyze it alongside other log data. Other locations such as Azure Storage, Azure Event Hubs, and certain Microsoft monitoring partners are also available. For more information on how to route the activity log, see Overview of the Azure activity log.
Analyze monitoring data
There are many tools for analyzing monitoring data.
Azure Monitor tools
Azure Monitor supports the following basic tools:
Metrics explorer, a tool in the Azure portal that allows you to view and analyze metrics for Azure resources. For more information, see Analyze metrics with Azure Monitor metrics explorer.
Log Analytics, a tool in the Azure portal that allows you to query and analyze log data by using the Kusto query language (KQL). For more information, see Get started with log queries in Azure Monitor.
The activity log, which has a user interface in the Azure portal for viewing and basic searches. To do more in-depth analysis, you have to route the data to Azure Monitor logs and run more complex queries in Log Analytics.
Tools that allow more complex visualization include:
- Dashboards that let you combine different kinds of data into a single pane in the Azure portal.
- Workbooks, customizable reports that you can create in the Azure portal. Workbooks can include text, metrics, and log queries.
- Grafana, an open platform tool that excels in operational dashboards. You can use Grafana to create dashboards that include data from multiple sources other than Azure Monitor.
- Power BI, a business analytics service that provides interactive visualizations across various data sources. You can configure Power BI to automatically import log data from Azure Monitor to take advantage of these visualizations.
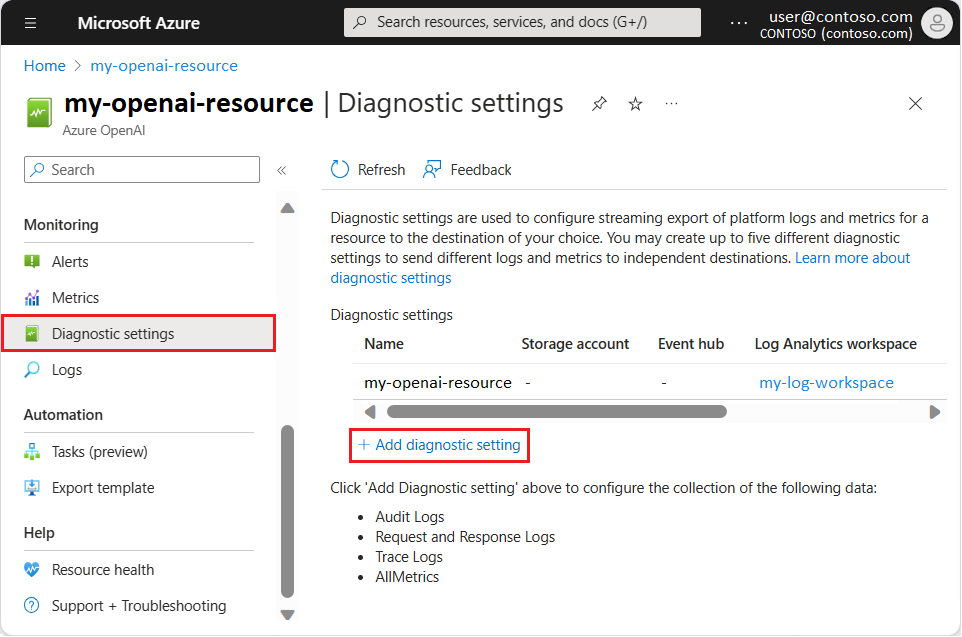
Configure diagnostic settings
All of the metrics are exportable with diagnostic settings in Azure Monitor. To analyze logs and metrics data with Azure Monitor Log Analytics queries, you need to configure diagnostic settings for your Azure OpenAI resource and your Log Analytics workspace.
After you configure the diagnostic settings, you can work with metrics and log data for your Azure OpenAI resource in your Log Analytics workspace.
Azure Monitor export tools
You can get data out of Azure Monitor into other tools by using the following methods:
Metrics: Use the REST API for metrics to extract metric data from the Azure Monitor metrics database. The API supports filter expressions to refine the data retrieved. For more information, see Azure Monitor REST API reference.
Logs: Use the REST API or the associated client libraries.
Another option is the workspace data export.
To get started with the REST API for Azure Monitor, see Azure monitoring REST API walkthrough.
Kusto queries
You can analyze monitoring data in the Azure Monitor Logs / Log Analytics store by using the Kusto query language (KQL).
Important
When you select Logs from the service's menu in the portal, Log Analytics opens with the query scope set to the current service. This scope means that log queries will only include data from that type of resource. If you want to run a query that includes data from other Azure services, select Logs from the Azure Monitor menu. See Log query scope and time range in Azure Monitor Log Analytics for details.
For a list of common queries for any service, see the Log Analytics queries interface.
After you deploy an Azure OpenAI model, you can send some completions calls by using the playground environment in Azure AI Foundry.
Any text that you enter in the Completions playground or the Chat completions playground generates metrics and log data for your Azure OpenAI resource. In the Log Analytics workspace for your resource, you can query the monitoring data by using the Kusto query language.
Important
The Open query option on the Azure OpenAI resource page browses to Azure Resource Graph, which isn't described in this article. The following queries use the query environment for Log Analytics. Be sure to follow the steps in Configure diagnostic settings to prepare your Log Analytics workspace.
From your Azure OpenAI resource page, under Monitoring on the left pane, select Logs.
Select the Log Analytics workspace that you configured with diagnostics for your Azure OpenAI resource.
From the Log Analytics workspace page, under Overview on the left pane, select Logs.
The Azure portal displays a Queries window with sample queries and suggestions by default. You can close this window.
For the following examples, enter the Kusto query into the edit region at the top of the Query window, and then select Run. The query results display below the query text.
The following Kusto query is useful for an initial analysis of Azure Diagnostics (AzureDiagnostics) data about your resource:
AzureDiagnostics
| take 100
| project TimeGenerated, _ResourceId, Category, OperationName, DurationMs, ResultSignature, properties_s
This query returns a sample of 100 entries and displays a subset of the available columns of data in the logs. In the query results, you can select the arrow next to the table name to view all available columns and associated data types.

To see all available columns of data, you can remove the scoping parameters line | project ... from the query:
AzureDiagnostics
| take 100
To examine the Azure Metrics (AzureMetrics) data for your resource, run the following query:
AzureMetrics
| take 100
| project TimeGenerated, MetricName, Total, Count, Maximum, Minimum, Average, TimeGrain, UnitName
The query returns a sample of 100 entries and displays a subset of the available columns of Azure Metrics data:

Note
When you select Monitoring > Logs in the Azure OpenAI menu for your resource, Log Analytics opens with the query scope set to the current resource. The visible log queries include data from that specific resource only. To run a query that includes data from other resources or data from other Azure services, select Logs from the Azure Monitor menu in the Azure portal. For more information, see Log query scope and time range in Azure Monitor Log Analytics for details.
Alerts
Azure Monitor alerts proactively notify you when specific conditions are found in your monitoring data. Alerts allow you to identify and address issues in your system before your customers notice them. For more information, see Azure Monitor alerts.
There are many sources of common alerts for Azure resources. For examples of common alerts for Azure resources, see Sample log alert queries. The Azure Monitor Baseline Alerts (AMBA) site provides a semi-automated method of implementing important platform metric alerts, dashboards, and guidelines. The site applies to a continually expanding subset of Azure services, including all services that are part of the Azure Landing Zone (ALZ).
The common alert schema standardizes the consumption of Azure Monitor alert notifications. For more information, see Common alert schema.
Types of alerts
You can alert on any metric or log data source in the Azure Monitor data platform. There are many different types of alerts depending on the services you're monitoring and the monitoring data you're collecting. Different types of alerts have various benefits and drawbacks. For more information, see Choose the right monitoring alert type.
The following list describes the types of Azure Monitor alerts you can create:
- Metric alerts evaluate resource metrics at regular intervals. Metrics can be platform metrics, custom metrics, logs from Azure Monitor converted to metrics, or Application Insights metrics. Metric alerts can also apply multiple conditions and dynamic thresholds.
- Log alerts allow users to use a Log Analytics query to evaluate resource logs at a predefined frequency.
- Activity log alerts trigger when a new activity log event occurs that matches defined conditions. Resource Health alerts and Service Health alerts are activity log alerts that report on your service and resource health.
Some Azure services also support smart detection alerts, Prometheus alerts, or recommended alert rules.
For some services, you can monitor at scale by applying the same metric alert rule to multiple resources of the same type that exist in the same Azure region. Individual notifications are sent for each monitored resource. For supported Azure services and clouds, see Monitor multiple resources with one alert rule.
Set up alerts
Every organization's alerting needs vary and can change over time. Generally, all alerts should be actionable and have a specific intended response if the alert occurs. If an alert doesn't require an immediate response, the condition can be captured in a report rather than an alert. Some use cases might require alerting anytime certain error conditions exist. In other cases, you might need alerts for errors that exceed a certain threshold for a designated time period.
Errors below certain thresholds can often be evaluated through regular analysis of data in Azure Monitor Logs. As you analyze your log data over time, you might discover that a certain condition doesn't occur for an expected period of time. You can track for this condition by using alerts. Sometimes the absence of an event in a log is just as important a signal as an error.
Depending on what type of application you're developing with your use of Azure OpenAI, Azure Monitor Application Insights might offer more monitoring benefits at the application layer.
Azure OpenAI alert rules
You can set alerts for any metric, log entry, or activity log entry listed in the Azure OpenAI monitoring data reference.
Advisor recommendations
For some services, if critical conditions or imminent changes occur during resource operations, an alert displays on the service Overview page in the portal. You can find more information and recommended fixes for the alert in Advisor recommendations under Monitoring in the left menu. During normal operations, no advisor recommendations display.
For more information on Azure Advisor, see Azure Advisor overview.
Related content
- See Azure OpenAI monitoring data reference for a reference of the metrics, logs, and other important values created for Azure OpenAI.
- See Monitoring Azure resources with Azure Monitor for general details on monitoring Azure resources.
- See Understand log searches in Azure Monitor logs about logs.