Using SignalR performance counters in an Azure Web Role
By Luke Latham
Warning
This documentation isn't for the latest version of SignalR. Take a look at ASP.NET Core SignalR.
SignalR performance counters are used to monitor your app's performance in an Azure Web Role. The counters are captured by Microsoft Azure Diagnostics. You install SignalR performance counters on Azure with signalr.exe, the same tool used for standalone or on-premises apps. Since Azure roles are transient, you configure an app to install and register SignalR performance counters upon startup.
Prerequisites
- Visual Studio 2015 or 2017
- Microsoft Azure SDK for Visual Studio Note: Restart your machine after installing the SDK.
- Microsoft Azure subscription: To sign up for a free Azure trial account, see Azure Free Trial.
Creating an Azure Web Role application that exposes SignalR performance counters
Open Visual Studio.
In Visual Studio, select File > New > Project.
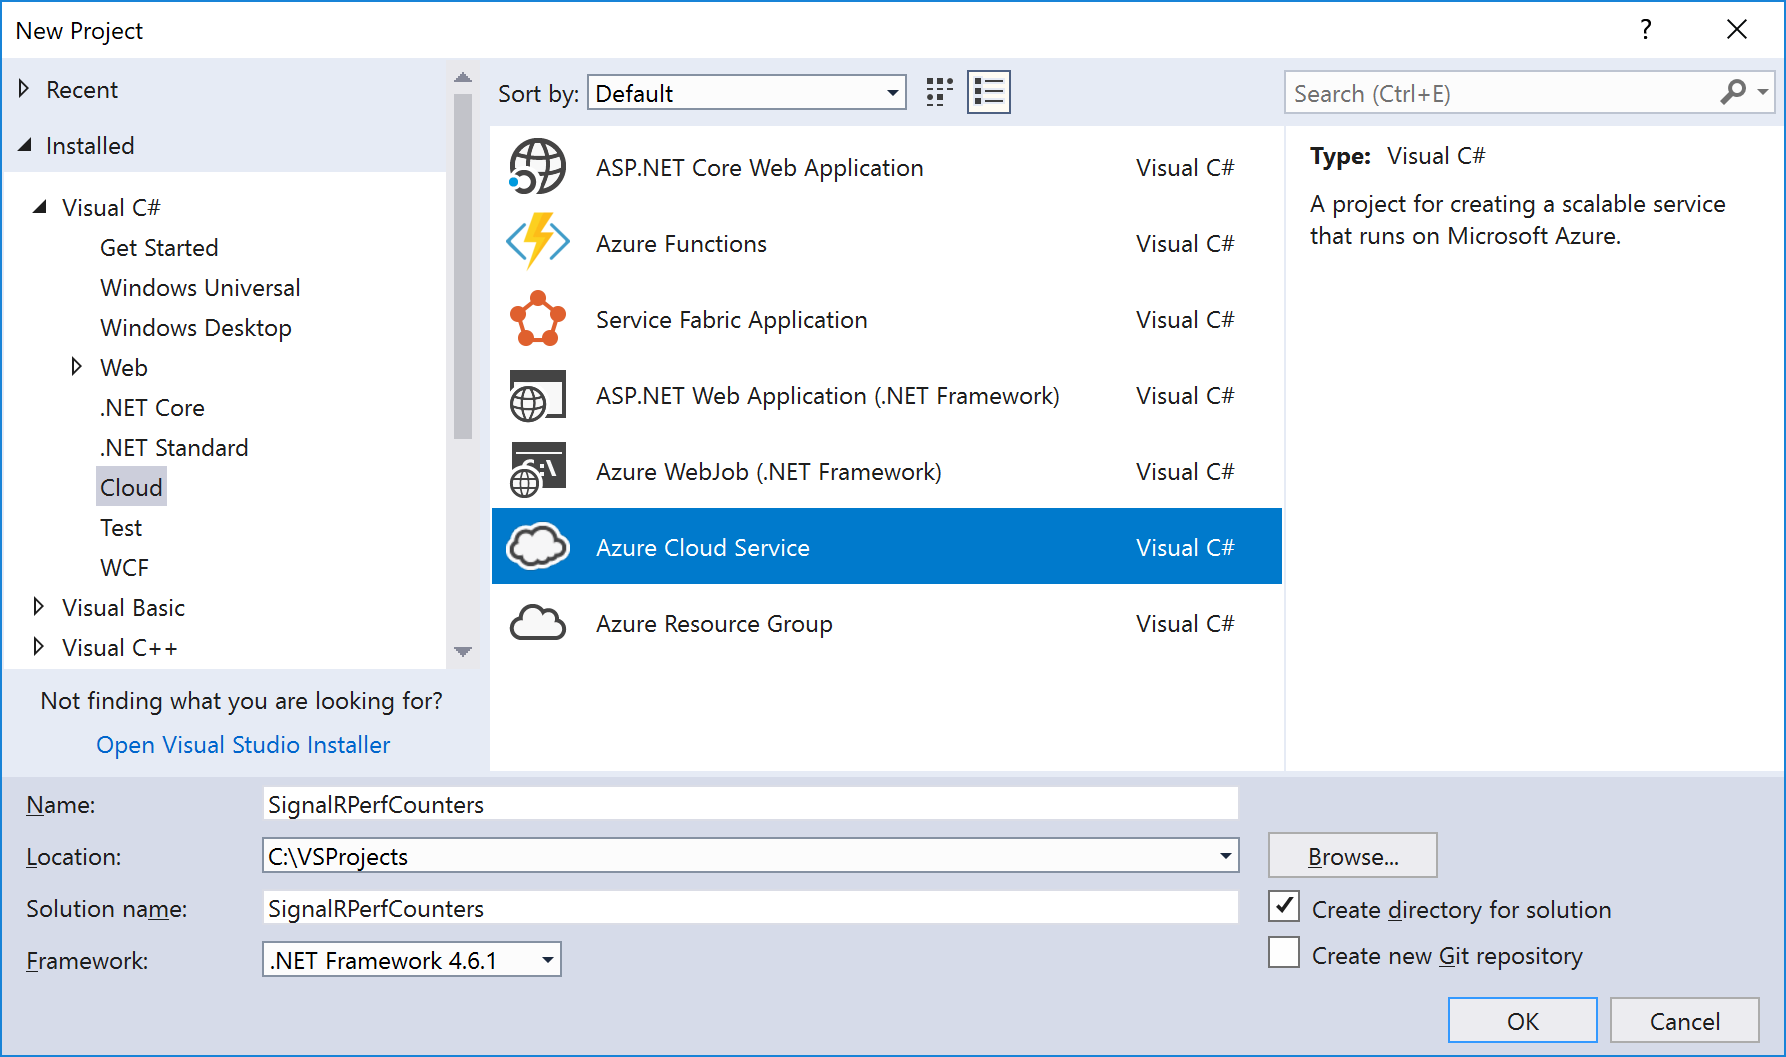
In the New Project dialog box, select the Visual C# > Cloud category on the left, and then select the Azure Cloud Service template. Name the app SignalRPerfCounters and select OK.
Note
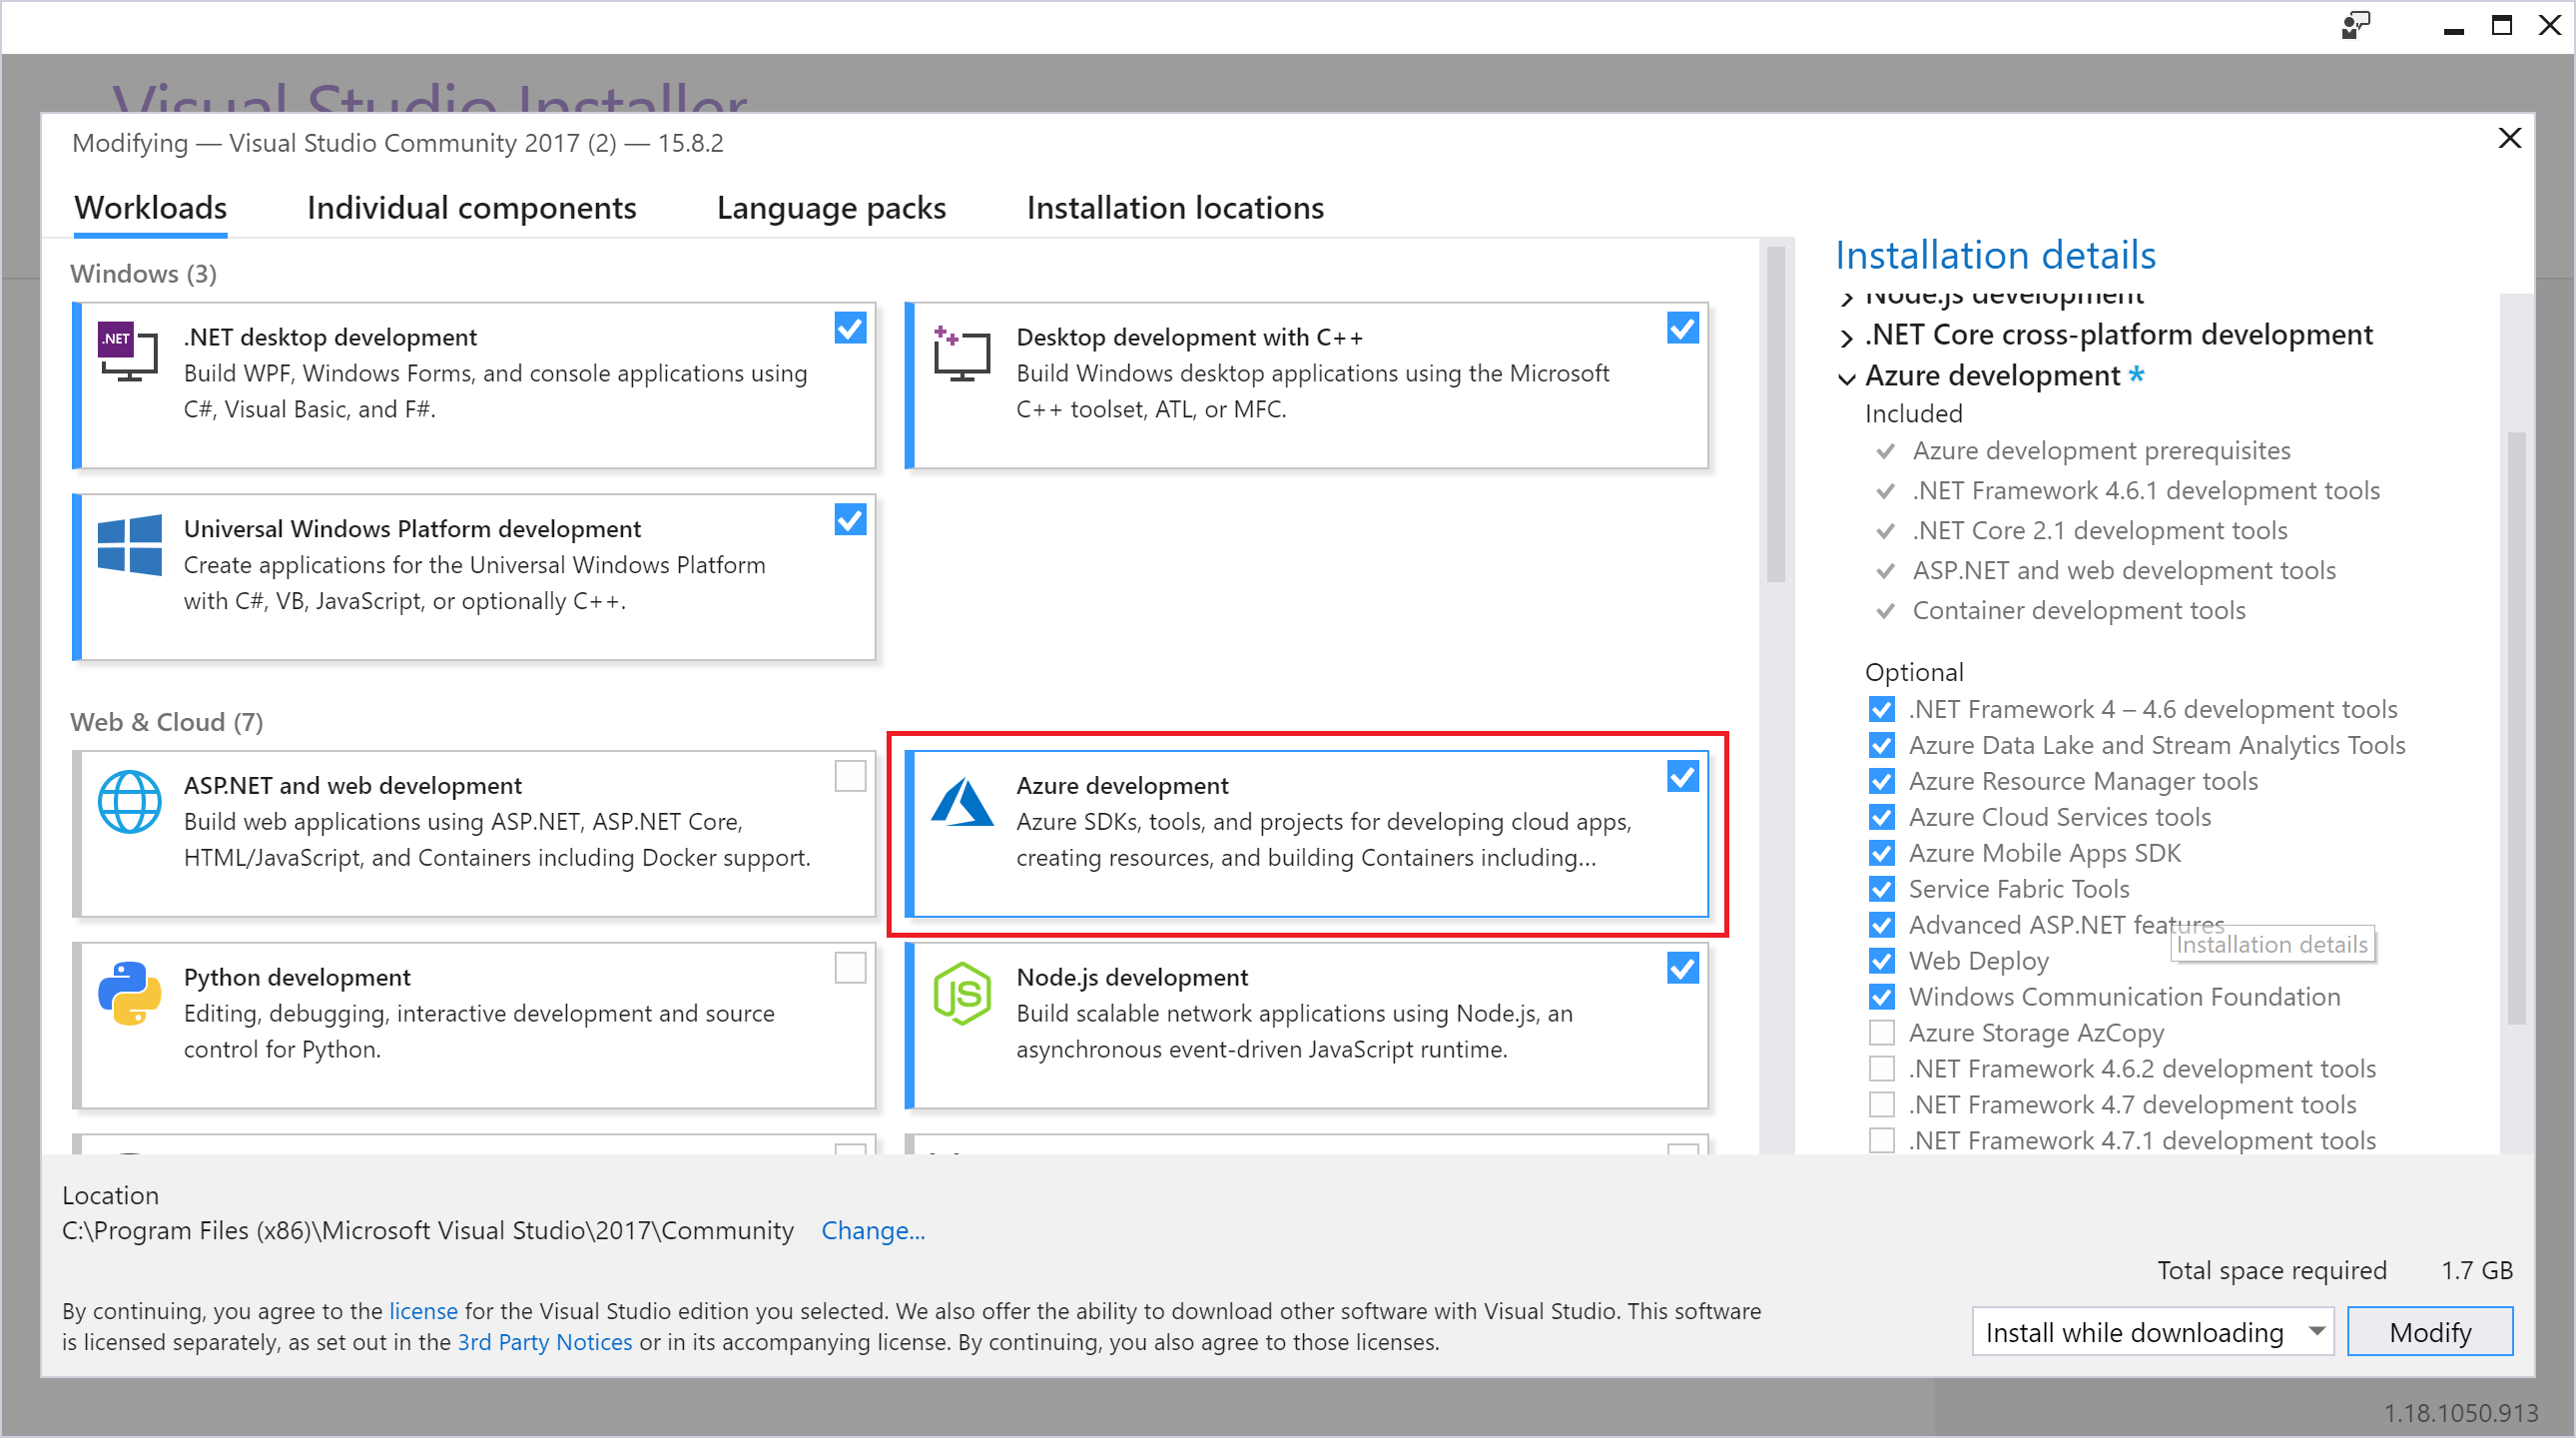
If you don't see the Cloud template category or the Azure Cloud Service template, you need to install the Azure development workload for Visual Studio 2017. Choose the Open Visual Studio Installer link on the bottom-left side of the New Project dialog to open Visual Studio Installer. Select the Azure development workload, and then choose Modify to start installing the workload.
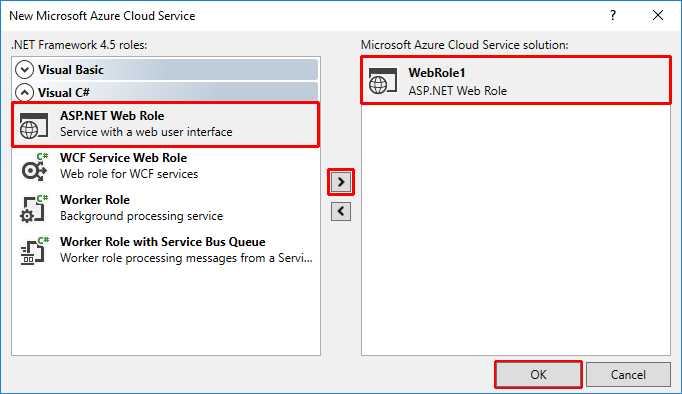
In the New Microsoft Azure Cloud Service dialog, select ASP.NET Web Role and select the > button to add the role to the project. Select OK.
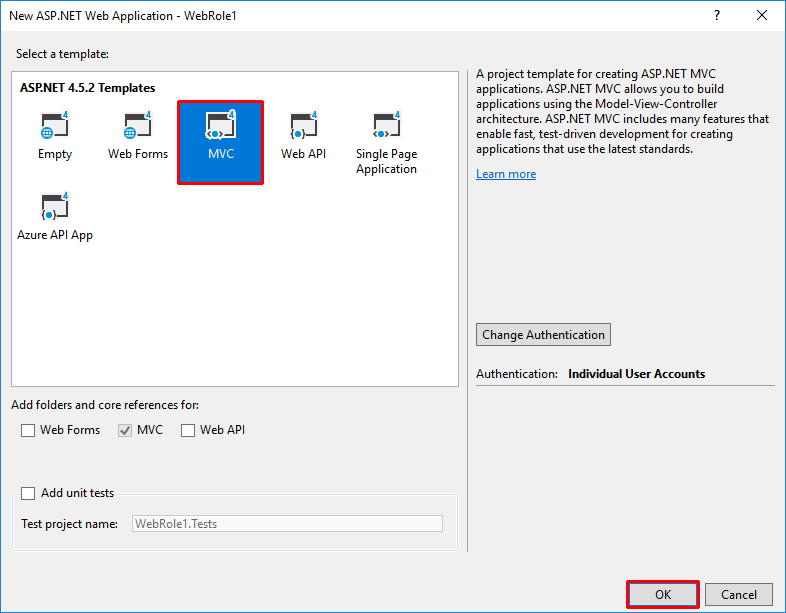
In the New ASP.NET Web Application - WebRole1 dialog, select the MVC template, and then select OK.
In Solution Explorer, open the diagnostics.wadcfgx file under WebRole1.
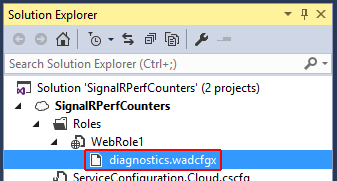
Replace the contents of the file with the following configuration and save the file:
<?xml version="1.0" encoding="utf-8"?>
<DiagnosticsConfiguration xmlns="http://schemas.microsoft.com/ServiceHosting/2010/10/DiagnosticsConfiguration">
  <PublicConfig>
    <WadCfg>
      <DiagnosticMonitorConfiguration overallQuotaInMB="4096">
        <DiagnosticInfrastructureLogs scheduledTransferLogLevelFilter="Error" />
        <Logs scheduledTransferPeriod="PT1M" scheduledTransferLogLevelFilter="Error" />
        <Directories scheduledTransferPeriod="PT1M">
          <IISLogs containerName ="wad-iis-logfiles" />
          <FailedRequestLogs containerName ="wad-failedrequestlogs" />
        </Directories>
        <WindowsEventLog scheduledTransferPeriod="PT1M">
          <DataSource name="Application!*[System[(Level=1 or Level=2 or Level=3)]]" />
          <DataSource name="Windows Azure!*[System[(Level=1 or Level=2 or Level=3 or Level=4)]]" />
        </WindowsEventLog>
        <CrashDumps containerName="wad-crashdumps" dumpType="Mini">
          <CrashDumpConfiguration processName="WaIISHost.exe" />
          <CrashDumpConfiguration processName="WaWorkerHost.exe" />
          <CrashDumpConfiguration processName="w3wp.exe" />
        </CrashDumps>
        <PerformanceCounters scheduledTransferPeriod="PT1M">
          <PerformanceCounterConfiguration counterSpecifier="\Memory\Available MBytes" sampleRate="PT3M" />
          <PerformanceCounterConfiguration counterSpecifier="\Web Service(_Total)\ISAPI Extension Requests/sec" sampleRate="PT3M" />
          <PerformanceCounterConfiguration counterSpecifier="\Web Service(_Total)\Bytes Total/Sec" sampleRate="PT3M" />
          <PerformanceCounterConfiguration counterSpecifier="\ASP.NET Applications(__Total__)\Requests/Sec" sampleRate="PT3M" />
          <PerformanceCounterConfiguration counterSpecifier="\ASP.NET Applications(__Total__)\Errors Total/Sec" sampleRate="PT3M" />
          <PerformanceCounterConfiguration counterSpecifier="\ASP.NET\Requests Queued" sampleRate="PT3M" />
          <PerformanceCounterConfiguration counterSpecifier="\ASP.NET\Requests Rejected" sampleRate="PT3M" />
          <PerformanceCounterConfiguration counterSpecifier="\Processor(_Total)\% Processor Time" sampleRate="PT3M" />
          <PerformanceCounterConfiguration counterSpecifier="\.NET CLR Memory(w3wp)\% Time in GC" sampleRate="PT10S" />
          <PerformanceCounterConfiguration counterSpecifier="\.NET CLR Exceptions(w3wp)\# of Exceps Thrown / sec" sampleRate="PT10S" />
          <PerformanceCounterConfiguration counterSpecifier="\.NET CLR LocksAndThreads(w3wp)\# of current logical Threads" sampleRate="PT10S" />
          <PerformanceCounterConfiguration counterSpecifier="\.NET CLR LocksAndThreads(w3wp)\# of current physical Threads" sampleRate="PT10S" />
          <PerformanceCounterConfiguration counterSpecifier="\.NET CLR LocksAndThreads(w3wp)\Current Queue Length" sampleRate="PT10S" />
          <PerformanceCounterConfiguration counterSpecifier="\.NET CLR LocksAndThreads(w3wp)\Contention Rate / sec" sampleRate="PT10S" />
          <PerformanceCounterConfiguration counterSpecifier="\.NET CLR Memory(w3wp)\# Bytes in all Heaps" sampleRate="PT10S" />
          <PerformanceCounterConfiguration counterSpecifier="\.NET CLR Memory(w3wp)\# GC Handles" sampleRate="PT10S" />
          <PerformanceCounterConfiguration counterSpecifier="\.NET CLR Memory(w3wp)\# of Pinned Objects" sampleRate="PT10S" />

          <PerformanceCounterConfiguration counterSpecifier="\SignalR(*)\Connections Connected" sampleRate="PT10S" />
          <PerformanceCounterConfiguration counterSpecifier="\SignalR(*)\Connections Reconnected" sampleRate="PT10S" />
          <PerformanceCounterConfiguration counterSpecifier="\SignalR(*)\Connections Disconnected" sampleRate="PT10S" />
          <PerformanceCounterConfiguration counterSpecifier="\SignalR(*)\Connections Current" sampleRate="PT10S" />
          <PerformanceCounterConfiguration counterSpecifier="\SignalR(*)\Connection Messages Received Total" sampleRate="PT10S" />
          <PerformanceCounterConfiguration counterSpecifier="\SignalR(*)\Connection Messages Sent Total" sampleRate="PT10S" />
          <PerformanceCounterConfiguration counterSpecifier="\SignalR(*)\Connection Messages Received/Sec" sampleRate="PT10S" />
          <PerformanceCounterConfiguration counterSpecifier="\SignalR(*)\Connection Messages Sent/Sec" sampleRate="PT10S" />
          <PerformanceCounterConfiguration counterSpecifier="\SignalR(*)\Message Bus Messages Received Total" sampleRate="PT10S" />
          <PerformanceCounterConfiguration counterSpecifier="\SignalR(*)\Message Bus Messages Received/Sec" sampleRate="PT10S" />
          <PerformanceCounterConfiguration counterSpecifier="\SignalR(*)\Scaleout Message Bus Messages Received/Sec" sampleRate="PT10S" />
          <PerformanceCounterConfiguration counterSpecifier="\SignalR(*)\Message Bus Messages Published Total" sampleRate="PT10S" />
          <PerformanceCounterConfiguration counterSpecifier="\SignalR(*)\Message Bus Messages Published/Sec" sampleRate="PT10S" />
          <PerformanceCounterConfiguration counterSpecifier="\SignalR(*)\Message Bus Subscribers Current" sampleRate="PT10S" />
          <PerformanceCounterConfiguration counterSpecifier="\SignalR(*)\Message Bus Subscribers Total" sampleRate="PT10S" />
          <PerformanceCounterConfiguration counterSpecifier="\SignalR(*)\Message Bus Subscribers/Sec" sampleRate="PT10S" />
          <PerformanceCounterConfiguration counterSpecifier="\SignalR(*)\Message Bus Allocated Workers" sampleRate="PT10S" />
          <PerformanceCounterConfiguration counterSpecifier="\SignalR(*)\Message Bus Busy Workers" sampleRate="PT10S" />
          <PerformanceCounterConfiguration counterSpecifier="\SignalR(*)\Message Bus Topics Current" sampleRate="PT10S" />
          <PerformanceCounterConfiguration counterSpecifier="\SignalR(*)\Errors: All Total" sampleRate="PT10S" />
          <PerformanceCounterConfiguration counterSpecifier="\SignalR(*)\Errors: All/Sec" sampleRate="PT10S" />
          <PerformanceCounterConfiguration counterSpecifier="\SignalR(*)\Errors: Hub Resolution Total" sampleRate="PT10S" />
          <PerformanceCounterConfiguration counterSpecifier="\SignalR(*)\Errors: Hub Resolution/Sec" sampleRate="PT10S" />
          <PerformanceCounterConfiguration counterSpecifier="\SignalR(*)\Errors: Hub Invocation Total" sampleRate="PT10S" />
          <PerformanceCounterConfiguration counterSpecifier="\SignalR(*)\Errors: Hub Invocation/Sec" sampleRate="PT10S" />
          <PerformanceCounterConfiguration counterSpecifier="\SignalR(*)\Errors: Tranport Total" sampleRate="PT10S" />
          <PerformanceCounterConfiguration counterSpecifier="\SignalR(*)\Errors: Transport/Sec" sampleRate="PT10S" />
          <PerformanceCounterConfiguration counterSpecifier="\SignalR(*)\Scaleout Streams Total" sampleRate="PT10S" />
          <PerformanceCounterConfiguration counterSpecifier="\SignalR(*)\Scaleout Streams Open" sampleRate="PT10S" />
          <PerformanceCounterConfiguration counterSpecifier="\SignalR(*)\Scaleout Streams Buffering" sampleRate="PT10S" />
          <PerformanceCounterConfiguration counterSpecifier="\SignalR(*)\Scaleout Errors Total" sampleRate="PT10S" />
          <PerformanceCounterConfiguration counterSpecifier="\SignalR(*)\Scaleout Errors/Sec" sampleRate="PT10S" />
          <PerformanceCounterConfiguration counterSpecifier="\SignalR(*)\Scaleout Send Queue Length" sampleRate="PT10S" />
        </PerformanceCounters>
      </DiagnosticMonitorConfiguration>
    </WadCfg>
    <StorageAccount></StorageAccount>
  </PublicConfig>
  <PrivateConfig>
    <StorageAccount name="" key="" endpoint="" />
  </PrivateConfig>
  <IsEnabled>true</IsEnabled>
</DiagnosticsConfiguration>
Open the Package Manager Console from Tools > NuGet Package Manager. Enter the following commands to install the latest version of SignalR and the SignalR utilities package:
install-package microsoft.aspnet.signalr
install-package microsoft.aspnet.signalr.utils
Configure the app to install the SignalR performance counters into the role instance when it starts up or recycles. In Solution Explorer, right-click on the WebRole1 project and select Add > New Folder. Name the new folder Startup.
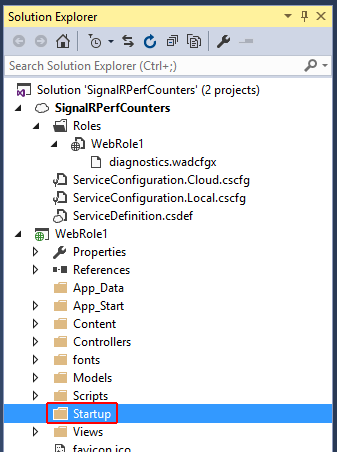
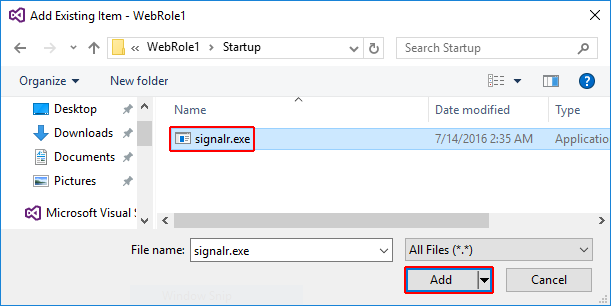
Copy the signalr.exe file (added with the Microsoft.AspNet.SignalR.Utils package) from <project folder>/SignalRPerfCounters/packages/Microsoft.AspNet.SignalR.Utils.<version>/tools to the Startup folder you created in the previous step.
In Solution Explorer, right-click the Startup folder and select Add > Existing Item. In the dialog that appears, select signalr.exe and select Add.
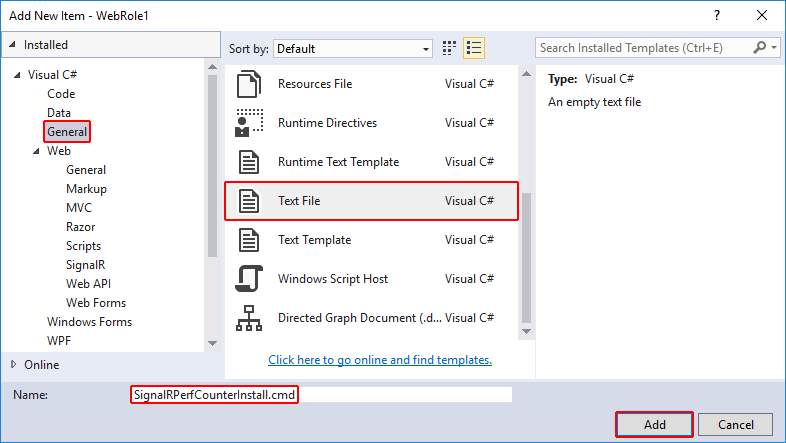
Right-click on the Startup folder you created. Select Add > New Item. Select the General node, select Text File, and name the new item SignalRPerfCounterInstall.cmd. This command file will install the SignalR performance counters into the web role.
When Visual Studio creates the SignalRPerfCounterInstall.cmd file, it will automatically open in the main window. Replace the contents of the file with the following script, then save and close the file. This script executes signalr.exe, which adds the SignalR performance counters to the role instance.
SET SignalR_LogDir=%~dp0Log\
MKDIR "%SignalR_LogDir%"
cd %~dp0
signalr.exe ipc >> "%SignalR_LogDir%SignalR_Log.txt" 2>&1
net localgroup "Performance Monitor Users" "Network Service" /ADD >> "%SignalR_LogDir%NetworkAdd.txt" 2>&1
Select the signalr.exe file in Solution Explorer. In the file's Properties, set Copy to Output Directory to Copy Always.
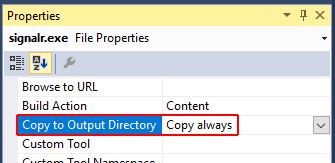
Repeat the previous step for the SignalRPerfCounterInstall.cmd file.
Right-click on the SignalRPerfCounterInstall.cmd file and select Open With. In the dialog that appears, select Binary Editor and select OK.
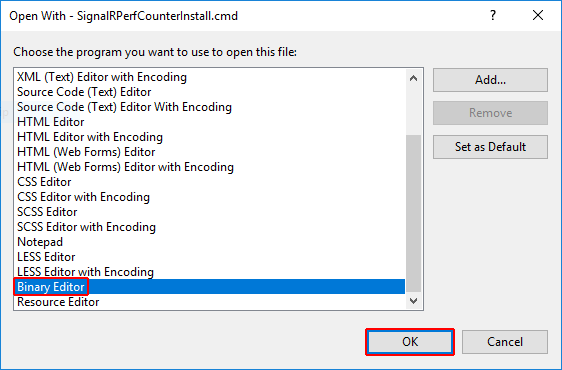
In the binary editor, select any leading bytes in the file and delete them. Save and close the file.
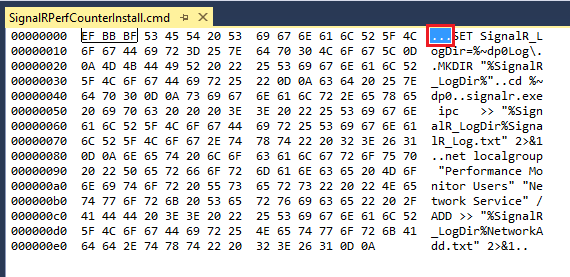
Open ServiceDefinition.csdef and add a startup task that executes the SignalrPerfCounterInstall.cmd file when the service starts up:
<?xml version="1.0" encoding="utf-8"?>
<ServiceDefinition name="SignalRPerfCounters" xmlns="http://schemas.microsoft.com/ServiceHosting/2008/10/ServiceDefinition" schemaVersion="2015-04.2.6">
  <WebRole name="WebRole1" vmsize="Small">
    <Startup>
      <Task commandLine="Startup\SignalRPerfCounterInstall.cmd" executionContext="elevated" taskType="background" />
    </Startup>
    <Sites>
      <Site name="Web">
        <Bindings>
          <Binding name="Endpoint1" endpointName="Endpoint1" />
        </Bindings>
      </Site>
    </Sites>
    <Endpoints>
      <InputEndpoint name="Endpoint1" protocol="http" port="80" />
    </Endpoints>
  </WebRole>
</ServiceDefinition>
Open
Views/Shared/_Layout.cshtmland remove the jQuery bundle script from the end of the file.<div class="container body-content"> @RenderBody() <hr /> <footer> <p>© @DateTime.Now.Year - My ASP.NET Application</p> </footer> </div> @Scripts.Render("~/bundles/jquery") @Scripts.Render("~/bundles/bootstrap") @RenderSection("scripts", required: false) </body> </html>Add a JavaScript client that continuously calls the
incrementmethod on the server. OpenViews/Home/Index.cshtmland replace the contents with the following code:@{ ViewBag.Title = "Home Page"; } <script src="~/Scripts/jquery-1.10.2.min.js"></script> <script src="~/Scripts/jquery.signalR-2.2.1.min.js"></script> <script src="~/signalr/hubs" type="text/javascript"></script> <div id="body"> <section class="featured"> <div class="content-wrapper"> <p> Hello World! </p> <div style="font-size:large;"> My Counter: <span id="counter"></span> </div> </div> </section> <section class="content-wrapper main-content clear-fix"></section> </div> <script type="text/javascript"> $(document).ready(function () { var hub = $.connection.myHub; hub.client.sendResult = function (x) { console.log('sendResult(' + x + ')'); $("#counter").text(x); window.setTimeout(function () { hub.server.increment(x); }, 1000); }; $.connection.hub.connected = function () {}; $.connection.hub.disconnected = function () {}; $.connection.hub.stateChanged(function (change) { console.log('new State' + change.newState); if (change.newState === $.signalR.connectionState.disconnected) { $.connection.hub.start(); } if (change.newState === $.signalR.connectionState.reconnecting) { console.log('Re-connecting'); } else if (change.newState === $.signalR.connectionState.connected) { console.log('The server is online'); } }); $.connection.hub.error(function (error) { console.log('error ' + error); }); $.connection.hub.logging = true; $.connection.hub.reconnected(function () { console.log('Reconnected'); hub.server.increment(0); }); $.connection.hub.start().done(function () { console.log('hub started'); hub.server.increment(0); }); }); </script>Create a new folder in the WebRole1 project named Hubs. Right-click the Hubs folder in Solution Explorer and select Add > New Item. In the Add New Item dialog box, select the Web > SignalR category, and then select the SignalR Hub Class (v2) item template. Name the new hub MyHub.cs and select Add.
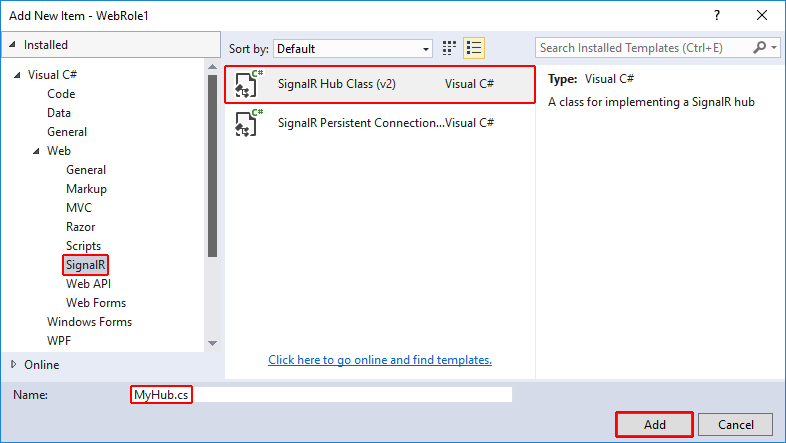
MyHub.cs will automatically open in the main window. Replace the contents with the following code, then save and close the file:
using System.Threading.Tasks;
using Microsoft.AspNet.SignalR;

namespace WebRole1.Hubs
{
    public class MyHub : Hub
    {
        public async Task Increment(int x)
        {
            await this.Clients.Caller.sendResult(x + 1);
        }
    }
}
Crank.exe is a connection density testing tool provided with the SignalR codebase. Since Crank requires a persistent connection, you add one to your site for use when testing. Add a new folder to the WebRole1 project called PersistentConnections. Right-click this folder and select Add > Class. Name the new class file MyPersistentConnections.cs and select Add.
Visual Studio will open the MyPersistentConnections.cs file in the main window. Replace the contents with the following code, then save and close the file:
using System.Threading.Tasks;
using Microsoft.AspNet.SignalR;
using Microsoft.AspNet.SignalR.Infrastructure;

namespace WebRole1.PersistentConnections
{
    public class MyPersistentConnection : PersistentConnection
    {
        protected override Task OnReceived(IRequest request, string connectionId, string data)
        {
            //Return data to calling user
            return Connection.Send(connectionId, data);
        }
    }
}
Using the
Startupclass, the SignalR objects start when OWIN starts up. Open or create Startup.cs and replace the contents with the following code:using Microsoft.Owin; using Owin; using WebRole1.PersistentConnections; // Marks this class for automatic OWIN startup [assembly: OwinStartup(typeof(WebRole1.Startup))] namespace WebRole1 { public partial class Startup { public void Configuration(IAppBuilder app) { ConfigureAuth(app); // Only needed if "No Authentication" was not selected for the project app.MapSignalR(); app.MapSignalR<MyPersistentConnection>("/echo"); } } }In the code above, the
OwinStartupattribute marks this class to start OWIN. TheConfigurationmethod starts SignalR.Test your application in the Microsoft Azure Emulator by pressing F5.
Note
If you encounter a FileLoadException at MapSignalR, change the binding redirects in web.config to the following:
<dependentAssembly>
  <assemblyIdentity name="Microsoft.Owin" publicKeyToken="31bf3856ad364e35" culture="neutral" />
  <bindingRedirect oldVersion="0.0.0.0-2.0.2.0" newVersion="2.0.0.0" />
</dependentAssembly>
<dependentAssembly>
  <assemblyIdentity name="Microsoft.Owin.Security" publicKeyToken="31bf3856ad364e35" culture="neutral" />
  <bindingRedirect oldVersion="0.0.0.0-2.0.2.0" newVersion="2.0.0.0" />
</dependentAssembly>
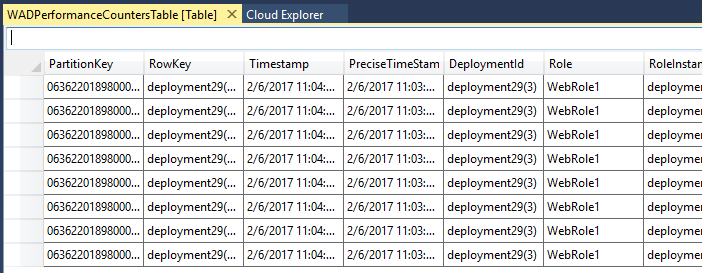
Wait about one minute. Open the Cloud Explorer tool window in Visual Studio (View > Cloud Explorer) and expand the path
(Local)/Storage Accounts/(Development)/Tables. Double-click WADPerformanceCountersTable. You should see SignalR counters in the table data. If you don't see the table, you may need to re-enter your Azure Storage credentials. You may need to select the Refresh button to see the table in Cloud Explorer or select the Refresh button in the open table window to see data in the table.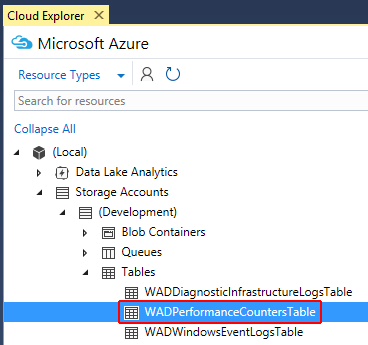
To test your application in the cloud, update the ServiceConfiguration.Cloud.cscfg file and set the
Microsoft.WindowsAzure.Plugins.Diagnostics.ConnectionStringto a valid Azure Storage account connection string.<?xml version="1.0" encoding="utf-8"?> <ServiceConfiguration serviceName="SignalRPerfCounters" xmlns="http://schemas.microsoft.com/ServiceHosting/2008/10/ServiceConfiguration" osFamily="4" osVersion="*" schemaVersion="2015-04.2.6"> <Role name="WebRole1"> <Instances count="1" /> <ConfigurationSettings> <Setting name="Microsoft.WindowsAzure.Plugins.Diagnostics.ConnectionString" value="DefaultEndpointsProtocol=https;AccountName=<account-name>;AccountKey=<account-key>" /> </ConfigurationSettings> </Role> </ServiceConfiguration>Deploy the application to your Azure subscription. For details on how to deploy an application to Azure, see How to Create and Deploy a Cloud Service.
Wait a few minutes. In Cloud Explorer, locate the storage account you configured above and find the
WADPerformanceCountersTabletable in it. You should see SignalR counters in the table data. If you don't see the table, you may need to re-enter your Azure Storage credentials. You may need to select the Refresh button to see the table in Cloud Explorer or select the Refresh button in the open table window to see data in the table.
Special thanks to Martin Richard for the original content used in this tutorial.