Troubleshoot VMM: Analyzing the Trace
If there is a trace available, the first thing to do is identify the task failure in the ‘Job’ view of the VMM console. This represents the actual job failure and is your starting point. Begin at the bottom of the trace and search up for the hex error code (0x80041005 for example). It will be there if you are in fact looking at the right trace. Although both keywords below can be found in a trace, here’s a tip on determining what is being called:
- If the keyword ‘ServerConnection’ is found, this is a Host making reference to an attempt to contact the VMM Server.
- If the keyword ‘ClientConnection’ is found, this is a Server making reference to an attempt to contact a VMM Host.
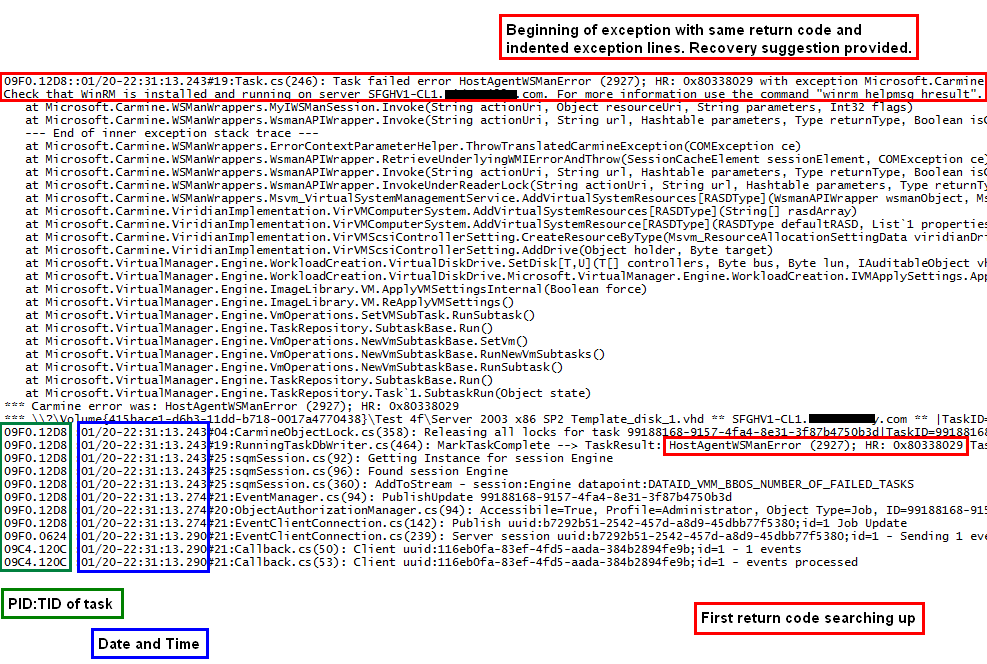
Once you have found the hex return code in the trace you need to understand the structure of the trace. First, keep in mind that traces are asynchronous. Simply meaning that there are many jobs running at once, all being recording by the trace, and that the line right above the one you find of interest may be from an entirely unrelated task. Pay attention to the PID (Process ID) and TID (Thread ID) of the line you are on… and if there is a TaskID, write it down as this represents the job itself. As you move up through the trace beginning with the hex code you will likely run into an exception. An exception represents a job failure and probably has the answer to the issue at hand. Exceptions are also easy to identify as they are indented and many lines begin with ‘at Microsoft.’. In the example below work your way up searching for ‘0x80338029’. The ‘TaskID’ is also visible. Finally, notice that the bottom three lines are not related to the exception as the PID and TID do not match that of the exception lines.

Figure 8: Trace example
Tip: |
Even though the word ‘exception’ will allow you to locate failures in a trace easily, not all exceptions are related to real issues. Exceptions involving ‘NPIV’ for example are numerous and can usually be ignored. |
Walking up through the trace it is possible to isolate the exact function or operation being performed at the time the exception occurred. Often there is a corresponding remote WMI call being made that fails. These remote WMI calls are delivered as the payload of a WS-Man request, and then ran on the remote machine. Take note of these operations and attempt to reproduce outside of VMM. More information on this is below in the WinRM and WMI sections.
Isolating specific tasks in a trace
Each VMM task and subtask is identified by a task ID. The task ID is a GUID assigned to a task when the task is built. If any subtasks are required to complete a primary task, then a separate subtask ID is assigned to the subtask. Background tasks, such as refresh operations, capacity management also have specific task IDs assigned to them. When troubleshooting problems that are not related to a specific user-initiated task, it is important to determine the task ID for the background task.
Every task performed by VMM is tracked and stored via the following three key tables in the VMM database:
- Audit Task Trail database
- Task trail database
- Subtask trail database
There are separate databases for storing individual task types, such as refresh operations, but these three databases can typically be used to identify all task operations. These tables are part of the Task Repository functionality of the VMM server engine. It is possible to view an organized report of each task, including its task ID, in the Microsoft SQL Server Management Studio Express application.
To view the Task Trail database, perform the following steps:
- Open Microsoft SQL Server Management Studio Express.
- In the left pane, go to: VirtualMachineManagerDB\Tables\dbo.tbl.TR_TaskTrail.
- Right-click on the dbo.tbl.TR_TaskTrail database and select Open Table.
The TaskTrail database records both user initiated tasks and background scheduled tasks such as refresh operations. The entries in this table are tombstoned at 90 day intervals by default.
Note: |
It is possible to modify the tombstoning frequency by changing the TaskGC value, defined in days, in the following registry key: HKEY_LOCAL_MACHINE\Software\Microsoft\Microsoft System Center Virtual Machine Manager Server\Settings\Sql This information is also contained in a KB: The Virtual Machine Manager service may consume high memory or CPU utilization |
Some of the key entries in the Task Trail database include:
- Task ID: Guid
- Task State: Success/Failed
- (Task) Description
- Any error codes encountered
- Start and End date time
- PowerShell Commandlet name
- Owner: User account which initiated the task
- Was the user notified of the task success or failure via a message or error?
After locating the Task ID of the task which failed, there are a number of methods for isolating that specific task within a trace.
Method 1: .CAR file and FIND
After converting the ETL trace to a CAR file, run the following command at a Command Prompt to pipe all of the lines in the trace relating to the specific Task ID (obtained from the Task Trail database) to the taskid.txt text file:
find /i /n “(Task ID)” path_to_car_file.car >taskid.txt
This method is also very useful when using the PID and TID of a Task.
Method 2: TextAnalysisTool.net
After converting the ETL trace to a CAR file, open the file in TextAnalysisTool.net.
- Click on Filter > Add filter.
- Enter the Task ID obtained from the Task Trail database and click OK.
- Click View and select Show Only Filtered Lines.
See Also
More VMM Troubleshooting topics:
System Center 2012 – Virtual Machine Manager (VMM) General Troubleshooting Guide