WCF End to End Tracing Simplified
Overview
This article will show you how to implement End to End tracing, in its simplest form, using WCF. The components of the example consist of a WCF Service and Console application. The WCF service exposes one operation, GetData, which takes an integer as a parameter, formats that integer as a string and then returns that formatted string to the calling application. The Console application consists of one method called Main that contains a For loop. The For loop iterates three times and on each subsequent iteration makes a call to the WCF service.
End to End tracing in WCF can be grouped in the form of an Activity. An Activity in WCF can be described as a unit of work. This unit of work can be identified using the ActivityId which is located in the Trace.CorrelationManager. Setting the ActivityId on the calling application is not enough to have our ActivityId transferred to the WCF Service. Fortunately for us, WCF provides us with a mechanism to do just that through the process of activity propagation. This will become clear as we move through the example.
Creating the Service
First of all we will create a WCF Service:
1. Open Visual Studio 2010
2. File->New Project or select New Project from the Start page
3. From the project Templates Window select WCF->WCF Service Library
4. Name the WCF Solution ActivityTracing and click OK
Now that we have our WCF Service created, navigate to the configuration file. Here, we will replace the service configuration and also add some diagnostics configuration.
In the configuration file add the following code to the <configuration> element
<system.diagnostics>
<sources>
<source name="System.ServiceModel"
switchValue="Error"
propagateActivity="true">
<listeners>
<add name="log"/>
</listeners>
</source>
<source name="TraceService"
switchValue="Information,ActivityTracing">
<listeners>
<add name="log"/>
</listeners>
</source>
</sources>
<sharedListeners>
<add name="log"
type="System.Diagnostics.XmlWriterTraceListener"
initializeData="c:\TraceService.svclog"/>
</sharedListeners>
<trace autoflush="true"/>
</system.diagnostics>
Let’s take a closer look at what we have just added. We have two sources which are configured differently and that is for good reason. The first source named System.ServiceModel is the source that will perform the propagation of our ActivityId with attribute propagateActivity set to true. Even though we are not concerned with what comes out of System.ServiceModel this source is required for activity propagation. The switch value has been set to Error so we only see trace information from System.ServiceModel if an error has occurred.
The second source, named TraceService, is the source that we will instantiate through our code using the TraceSource Class. We will send our trace information to this source. Notice that the switch value is set to “Information,ActivityTracing”. This will ensure that our ActivityId will be sent across to the service for Information Trace Events.
Both of the sources output information is sent to a sharedListener named “log”. The sharedListener is of type XMLWriterTraceListener and on the service side outputs to a file called TraceService.svclog. The svclog file extension associates the log file with the ServiceTraceViewer.
One last thing, it is a good idea to add the <trace> element to the diagnostics section and set the autoFlush attribute to true. This will ensure that all trace information is written to the log file.
Now that we have added our diagnostic section to the configuration file we will also add our service configuration. This is not a requirement although it does make this example a little easier to work through if we are all on the same page. Add the following code to the <configuration> section of the configuration file.
<system.serviceModel>
<services>
<service name="ActivityTracing.TraceService">
<endpoint address ="http://localhost:8732/ActivityTracing/TraceService/"
binding="wsHttpBinding" contract="ActivityTracing.ITraceService"/>
<endpoint address="mex" binding="mexHttpBinding"contract="IMetadataExchange"/>
</service>
</services>
<behaviors>
<serviceBehaviors>
<behavior>
<serviceMetadata httpGetEnabled="True"/>
</behavior>
</serviceBehaviors>
</behaviors>
</system.serviceModel>
Now that we have updated our configuration file let’s focus on our Service Contract and Service implementation. Open the IService1 file in Solution Explorer and replace the existing code.
<ServiceContract()>
Public Interface ITraceService
<OperationContract()>
Function GetData(ByVal value As Integer) As String
End Interface
This defines the Service Contract and exposes one operation called GetData.
For the Service implementation, navigate to the Service1 file in Solution Explorer and replace the existing code with the following.
Public Class TraceService
Implements ITraceService
Public Function GetData(ByVal value As Integer) As String Implements ITraceService.GetData
Dim ts As New TraceSource("TraceService")
ts.TraceEvent(TraceEventType.Information, 0, "Getdata recieved message")
ts.TraceEvent(TraceEventType.Information, 0, "Formatting string")
Dim r As String = String.Format("You entered: {0}", value)
ts.TraceEvent(TraceEventType.Information, 0, "String formatted")
ts.TraceEvent(TraceEventType.Information, 0, "Getdata reponse message")
Return r
End Function
End Class
The function GetData shown above doesn’t really perform much work. Firstly, the TraceSource is created using the TraceService source in our configuration file. We then trace out a bunch of information events using the TraceEvent method while also formatting the integer parameter as a string and assigning it to a string variable. Lastly, we return the formatted string to the calling application. Click Save to ensure that you have saved all the changes made to the WCF Service. This is the end of our WCF service configuration. All that is left now is to create the Console application which will consume the WCF Service.
Creating the Console Application
To create the Console application, do the following.
1. Select File->Add->New Project
2. From the project Templates Window select Windows->Console Application
3. Name the Console Application TraceClient and click OK
** 4. Set the Console Application as the Startup Project**
After the Console application has been added to the Solution, navigate to the Console application and add a service reference to the Console application.
1. Right click on the Console application in Solution Explorer
2. Select Add Service Reference. The Add Service Reference Dialog will appear
3. Click the Discover button on the Dialog
4. One service should appear. Set the namespace to TraceService and click OK
5. The service reference will be added to the Console application
The Client configuration file also needs to be modified so the ActivityId can be propagated to the service. Navigate to the configuration. Remove the boiler plate code for the <system.diagnostics> element and add the following to the <configuration> element.
<system.diagnostics>
<sources>
<source name="System.ServiceModel"
switchValue="Error"
propagateActivity="true">
<listeners>
<add name="log"/>
</listeners>
</source>
<source name="TraceClient"
switchValue="Information,ActivityTracing">
<listeners>
<add name="log"/>
</listeners>
</source>
</sources>
<sharedListeners>
<add name="log"
type="System.Diagnostics.XmlWriterTraceListener"
initializeData="c:\TraceClient.svclog"/>
</sharedListeners>
<trace autoflush="true"/>
</system.diagnostics>
You will notice that the diagnostics section of the client configuration file is exactly the same as the service diagnostics section. The only difference between the two is that the initalizeData attribute in the sharedListeners has a different file name. The file name used here is TraceClient.svclog. This will simulate the client and service being on different machines where they will log information to their own log files.
To complete the project, navigate to the Module1 file in Solution Explorer. Replace the code in the file with the following.
Module Module1
Sub Main()
For i = 1 To 3
Dim ts As New TraceSource("TraceClient")
Trace.CorrelationManager.ActivityId = Guid.NewGuid
ts.TraceEvent(TraceEventType.Information, 0, "Starting TraceClient...")
Dim proxy As New TraceService.TraceServiceClient
ts.TraceEvent(TraceEventType.Information, 0, "TraceClient Started")
ts.TraceEvent(TraceEventType.Information, 0, "Calling GetData")
Dim returnString As String = proxy.GetData(10)
ts.TraceEvent(TraceEventType.Information, 0, "GetData returned")
ts.TraceEvent(TraceEventType.Information, 0, "Closing TraceClient...")
proxy.Close()
ts.TraceEvent(TraceEventType.Information, 0, "TraceClient Closed")
Next
End Sub
End Module
All we do now is run the Console application. Again, ensure that the console application is the startup project for the solution. After running, the Console application will close. My log files were generated on the c drive as specified in the configuration file.
Viewing the log files in ServiceTraceViewer
We can now view the Trace logs by opening both the TraceService.svclog and TraceClient.svclog using the ServiceTraceViewer. To open the ServiceTraceViewer
1. Click Start
2. Microsoft Visual Studio 2010->Microsoft Windows SDK Tools->ServiceTraceViewer
When the ServiceTraceViewer window appears you can open the Trace logs that were generated by the WCF Service and Console Application. To do this:
1. Select File->Open
2. When the Open File Dialog appears, select the TraceClient.svclog
3. After the TraceClient has opened we need to add the TraceService.svclog
4. Select File->Add
5. When the Open File Dialog appears, select the TraceService.svclog
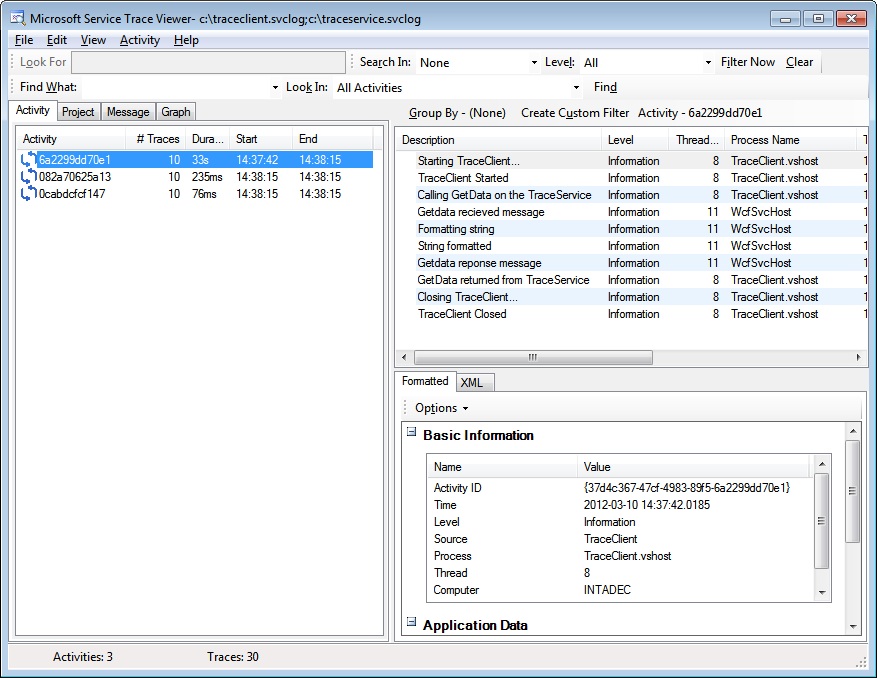
After both of the log files have been opened in the ServiceTraceViewer you will see the following:
On the left side in the Activity panel we can see that three activities were created. These activities correspond to each iteration of our For loop in the Console application. On the right, we can see detailed information contained in each activity. If we look closely at the values in the Process Name column, we can see that the traces that were generated by the Console application (TraceClient.vshost) and the traces that were generated by the WCF Service (WcfSvcHost)
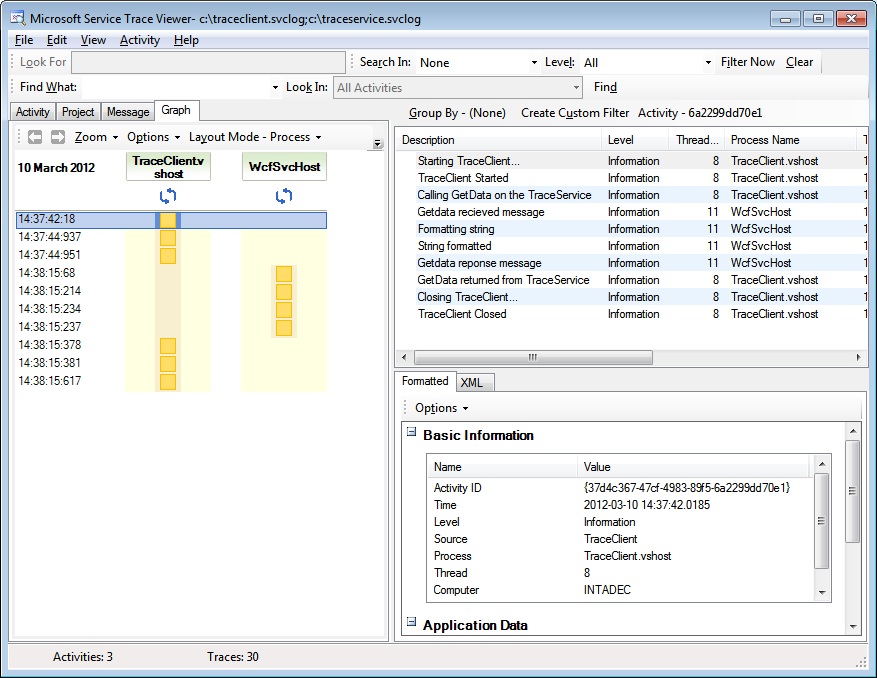
If we select the Graph Tab located on the left of the dialog we can obtain a visual representation of our call in to the WCF Service as shown below
Conclusion
In conclusion, we have seen a very simple End to End Trace. What is show here only scratches the surface of tracing in WCF. For more information on tracing, follow the links to some great tracing articles.
More Information
End to End Tracing Senarios
http://msdn.microsoft.com/en-us/library/aa738752.aspx
Activity Tracing
http://msdn.microsoft.com/en-us/library/aa738618.aspx
Transfer
http://msdn.microsoft.com/en-us/library/aa702792.aspx
Propagation
http://msdn.microsoft.com/en-us/library/aa738751.aspx


