Remote Kernel Debugging Using Namepipe
Remote Kernel Debugging Using Namepipe
Feb 8th 2012
Summary
How to use debugging tools to perform remote kernel debug?. This document explains the debuggers used and the steps needed to attach and perform live debugging. Windows Operating system consists of 2 modes User mode and Kernel mode. User mode applications such as Wordpad , Notepad , managed applications , unmanaged applications executes at User mode and Operating system core components such as File system drivers, Network stack , Interrupt controllers , Memory management, Graphics , GDI are managed at kernel level.
There are many instances where an Engineer has to perform live debugging on a non-responsive operating system or debug an application remotely to understand the interaction between user application and kernel mode subsystem or driver. This article will help Engineers to perform live debugging from Host to the Target using Namepipe
Scenarios
Scenario A:
Organization is running virtual infrastructure with SCVMM managing virtual machines hosted on Microsoft Hyper-v server. Users connect to the virtual machines via Thin client and launch their applications to perform day-to-day task and in the event of Blue screen, Client OS hang, Application hang, there is always a need to understand the root cause of the problem. With the help of Microsoft Debuggers in place, engineers can hook the debugger to the session and perform the debugging.
Scenario B:
In a VDI infrastructure which spans across multiple regions , Users are connected to either Static Desktops or Pooled desktops via Citrix and these clients are managed by SCVMM hosted on Hyper-v server. There would be need to debug the Static desktops which might exhibit Blue Screen, OS hang or Application hang respectively. Installing debugging tools on non-responsive systems might not be the valid choice and the hang is always unpredictable.
During the above situations, Engineers can make use of Windows Debugger KD or Windbg to perform Remote kernel debugging using Namepipes.
System Requirements
In my setup, I have the below system configuration used for Remote debugging.
Role |
Description |
Windows Server 2008 R2 w/ Sp1 |
Host computer installed with Debugger |
Hyper-v |
Used to manage Virtual machines |
Windows 7 Operating System |
Target computer |
|
|
Tools Used
a) Windows Debugger / Windbg
* You can install and configure the debugging tools using the below link*
http://msdn.microsoft.com/en-us/windows/hardware/gg463009
* *
b) Process Explorer
* You can install and configure Process explorer from the below link
http://technet.microsoft.com/en-us/sysinternals/bb842062*
* *
** **
**Procedure
**
Preparing Host Computer:
Step1: Once you install and configure Windbg tool, make sure you download the relevant symbol files and point Windbg to correct symbol path. The symbol packages for different operating system can be find from the below link.
http://msdn.microsoft.com/en-us/windows/hardware/gg463028
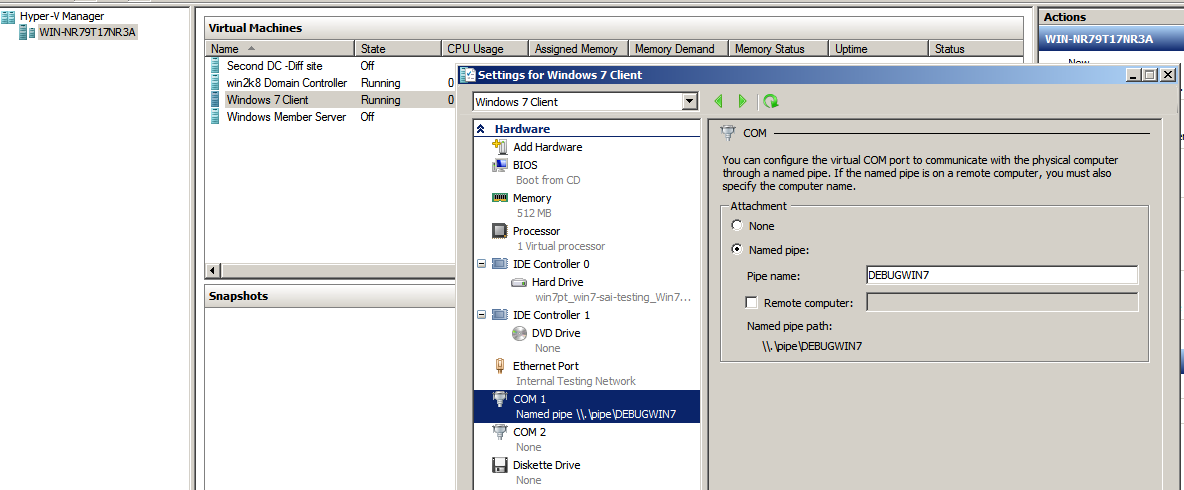
Step2: On the Windows Server 2008 R2 Sp1l, with Hyper-v installed, navigate to Hyper-v Manager and right click on the Windows 7 client, configure the Namepipe as shown below. Notice that when you enter the pipe name , the Name Pipe Path would automatically get populated.
Example: In my below example, I have used DEBUGWIN7 as pipe name and the path would look like \.\pipe\DEBUGWIN7
Figure1 : Hyper-V Client COM settings
Preparing Target Computer:
Step1: Logon to Windows 7 operating system with administrative privileges to modify the BCDEdit configuration. In an Enterprise infrastructure, appropriate worker segmentations would be made to distinguish between Administrator and Standard User along with the User Access Control rights configured on the virtual machine. Hence it is required to logon with the proper administrative account which has permission to modify system level settings.
Step2: Open the command prompt in an elevated mode and enter the below command
To verify the setting, run the following command bcdedit /enum
**
**
From the output we can see that Debug option under windows Boot loader is set to Yes.
**
**
Step3: Next run the below command which will enable the debugger to use COM port
Step4: Restart the Target / Windows 7 operating system.
Remote Debugging:
The below procedure explains the steps involved to initiate windows debugger and perform break into the Target operating system.
Step1: Launch Windbg and navigate to File à Kernel Debugging and set the following as shown in the diagram
You should make sure the following settings are in place
a) Check Pipe option
b) Populate the setting under Port: , this is the namepipe being configured at the virtual machine
c) Check Reconnect option
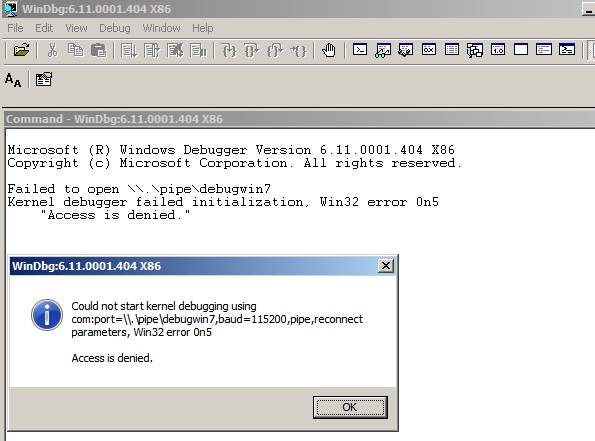
Save the workspace and you might see the below error message
To resolve the problem, you should open the windows debugger in elevated mode / Run as Administrator. And perform the kernel debugging
**
**
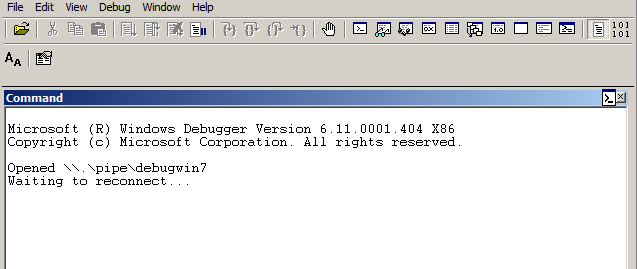
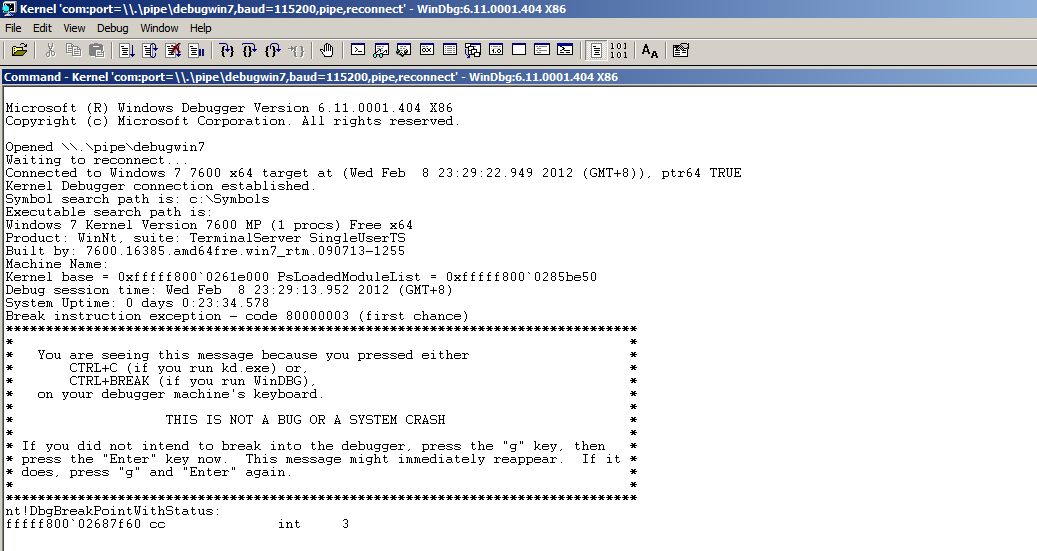
Step2: After successfully starting kernel debugging, you should see the below screen
Step3: Navigate to Debug tab and hit Break or Ctrl+Break which would cause server to break into the debugger. Please note that during this state the Target operating system will not be responding and at the KD> prompt, please enter g and hit enter.
The Go command will resume the Target OS from halt state and user can perform further tasks.
Fixing Symbols:
There has been always a challenge to manage the symbol files , the below commands will simply the process and ensure that windbg is able to load the symbols appropriately.
Once the debugger is in KD mode, enter the below commands to validate the symbol path
Step1: Use Symfix command with the following syntax .Symfix < location of the symbol file >
**
**
Step2: .reload this would reload User symbols and Kernel symbols
Testing:
To Test, you can enter !process 0 0 which should give the running processes on the Target operating system. Note that the above command only gets executed at the Kernel mode. Once you have verified the running processes you can perform various tasks depending on the issue or behavior of Operating system / driver / application.
To debug custom applications, make sure you get the .PDB files of the application and ensure the symbol folder is populated with the same, if not you will not be able to read the functions defined for the executable or the DLL.
Conclusion:
This article shows the procedure to setup remote debugging using NamePipe which is equivalent to perform remote debugging using Null Model cable. As we are performing debugging on virtual machines, it is impossible to use the Null model cable connecting to serial ports.
**About the Original Author: **
Sainath is a MVP for Directory Services and works for Avanade Asia Pte Ltd, Singapore. He is an active Speaker at Microsoft Singapore Windows User Group and blogs about Directory services , Winternals and Virtualization. He is the Reviewer of Microsoft Operations Framework for Active Directory , Windows Server, Hyper-v and Certificate Services and beta tester for Windows Server 2008 R2 , SCVMM.** **


