Visio Management Pack Designer Example
1/14/2014 - Visio Management Pack Designer has been deprecated and is no longer available.
The Visio Management Pack Designer comes with a variety of patterns that will allow you to effectively model a number of different application setups, but you can also create your own management pack drawing from scratch, using the shapes provided.
In this example, you have a standard two-tier application, with a Microsoft SQL Server database on the back end, and a front-end web site hosted on Microsoft IIS providing the front end. What makes this situation different from the two-tier pattern that comes with the VMPD is that this scenario involves physical stores at multiple locations, each with its own local server. The local servers can access the central web server, and the web server accesses the back-end database.
The first step in designing a management pack for a custom application is to consider what monitoring you already have in your environment, as a result of running Operations Manager with the standard management packs. In this case, you can assume that you’re running the SQL Server management pack and the IIS management pack, so you don’t need to add reporting for the database server itself, or the web servers. If your application were running a custom service, or had a custom component that isn’t covered by the standard management packs, you would need to add monitoring for those, but that’s not the case here. What you do need to know, though, is whether the central web server can successfully access the database running on the SQL server. Therefore, you’ll need to apply the database monitoring not on the SQL server, but on the central server. This isn’t immediately obvious, but you’ll see how it works in this demonstration.
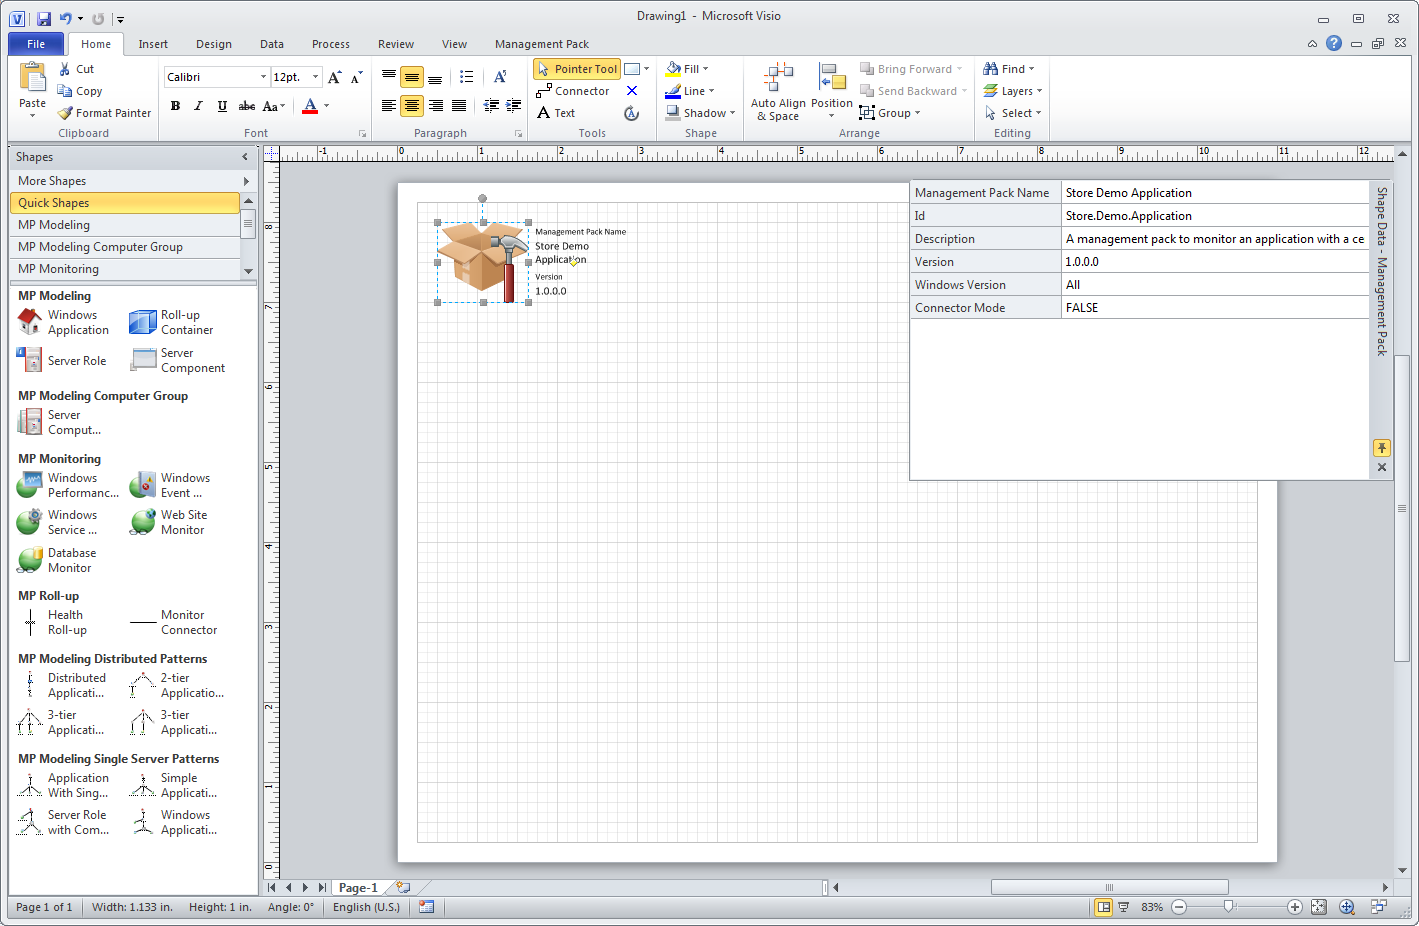
Create a new management pack drawing. Set the name to “Store Demo Application.” The ID will be filled in for you. Add a description if you like. Set the Windows version to “All,” and leave the Connector mode set to FALSE.

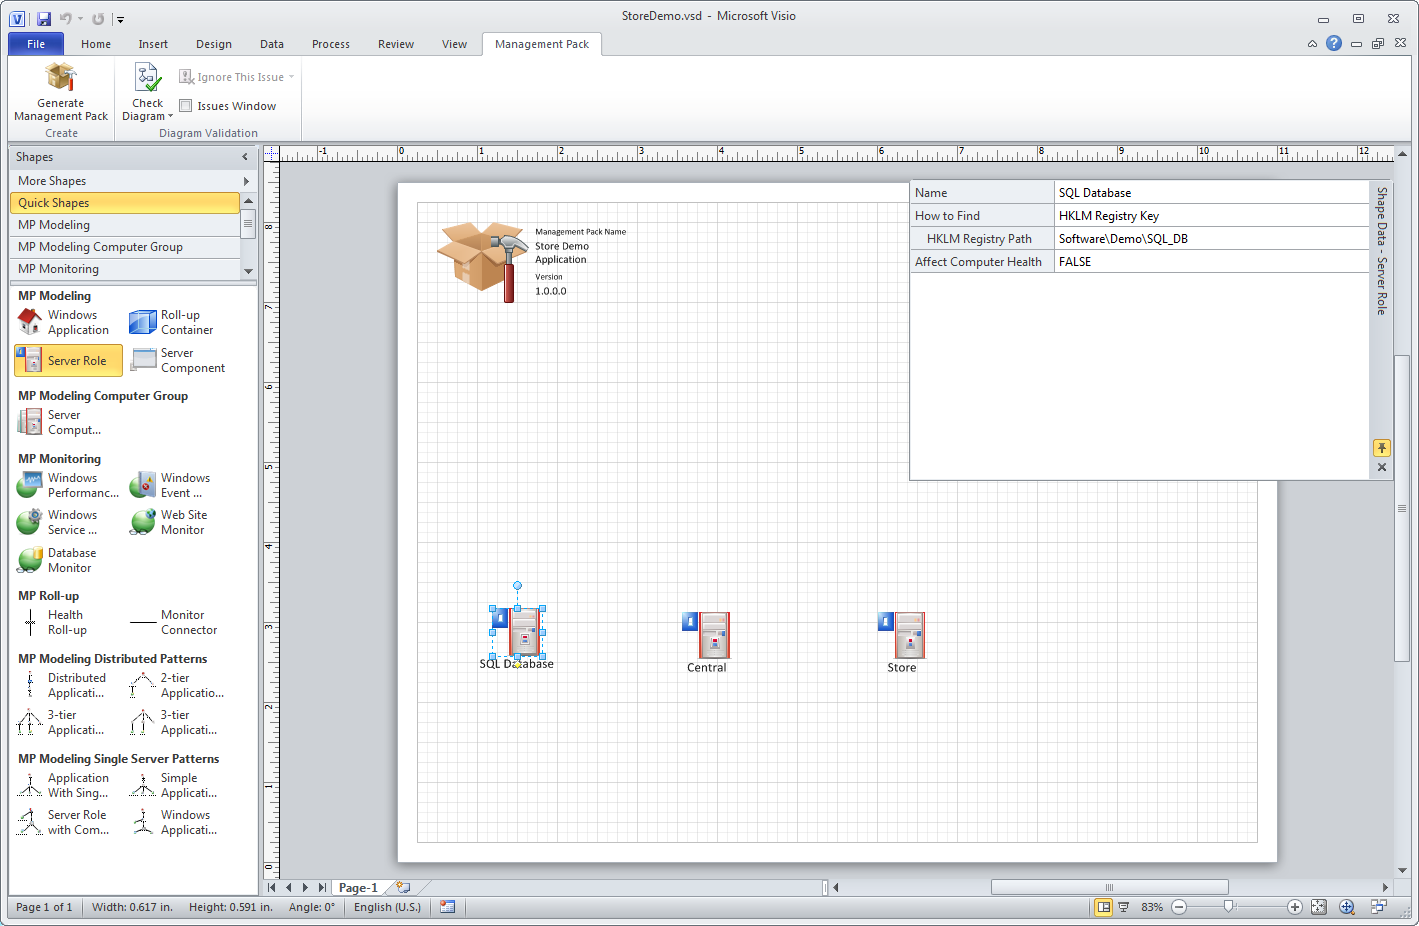
Rather than starting the drawing from the top down, you’ll first place the components that you already know exist in the application, and then define the connections between them. Add three Server Role shapes to the drawing, and assign their properties like this:
Name |
How to Find |
HKLM Registry Path |
SQL Database |
HKLM Registry Key |
Software\Demo\SQL_DB |
Central |
HKLM Registry Key |
Software\Demo\Central |
Store |
HKLM Registry Key |
Software\Demo\Store |
Leave “Affect Computer Health” set to FALSE.
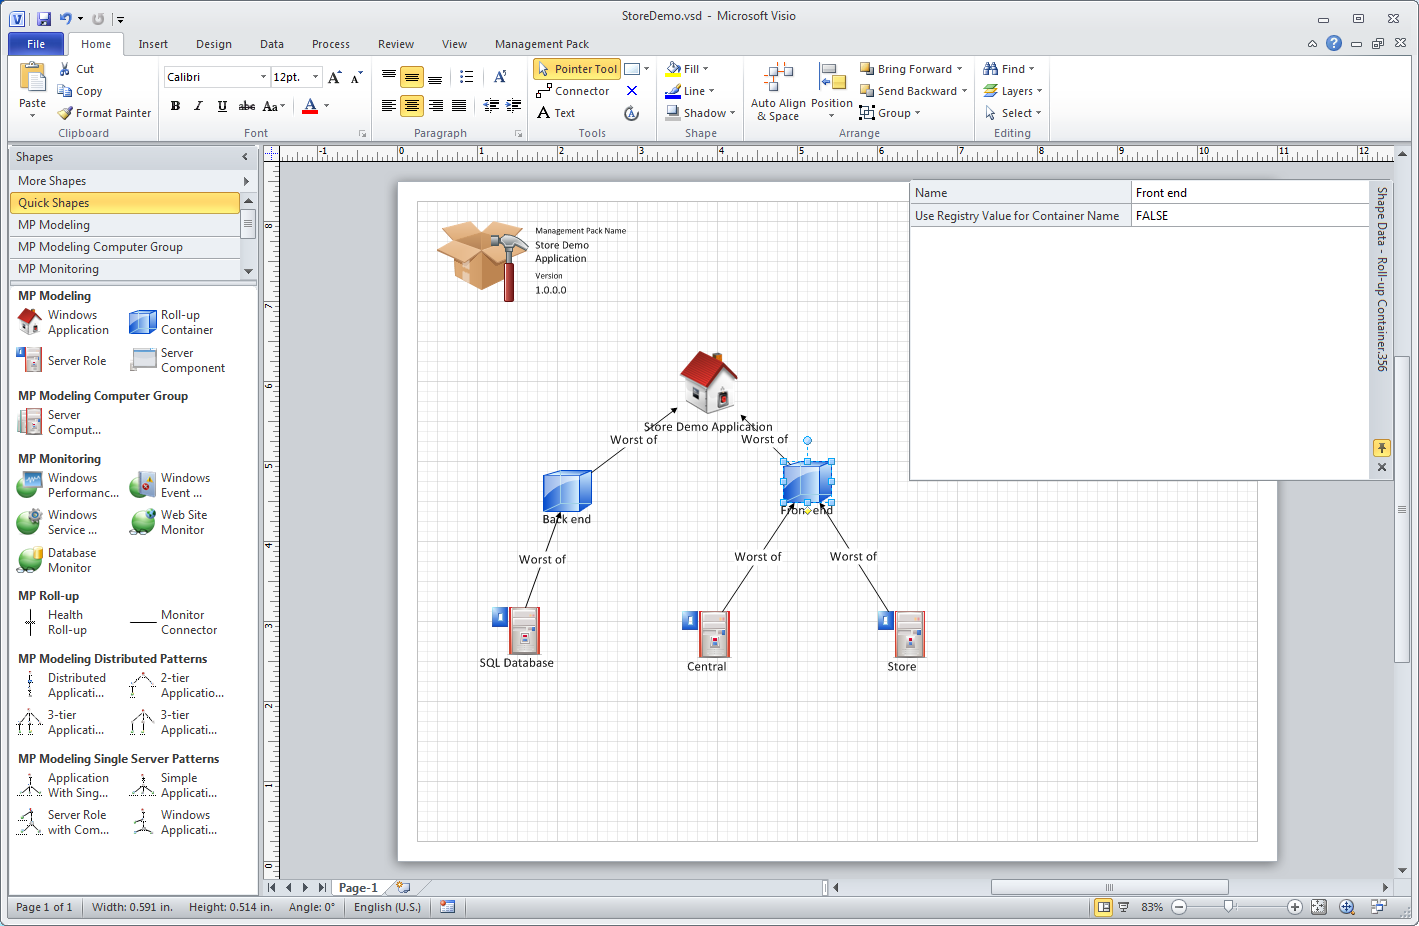
Now that the physical components are on the drawing, you can add the conceptual components that represent how the servers relate to one another within the application. In this case, the SQL Database server represents the back end, and the Central and Store servers represent the front end. You want to be able to monitor the health of the back end and front end separately, so that means two roll-up containers.
Add a Windows Application to the drawing, and name it Store Demo Application. Drop one Roll-up Container onto the Store Demo Application, to establish the connection. Name this Roll-up container Back end. Drag a Health Roll-up shape onto the drawing, and connect one end to the Back end roll-up, and the other to the SQL Database role.
Now drag another Roll-up container onto the Store Demo Application, and name it Front end. Add two Health Roll-up shapes, and use them to connect the Central and Store server roles to the Front end roll-up. At this point, your drawing should look like this:
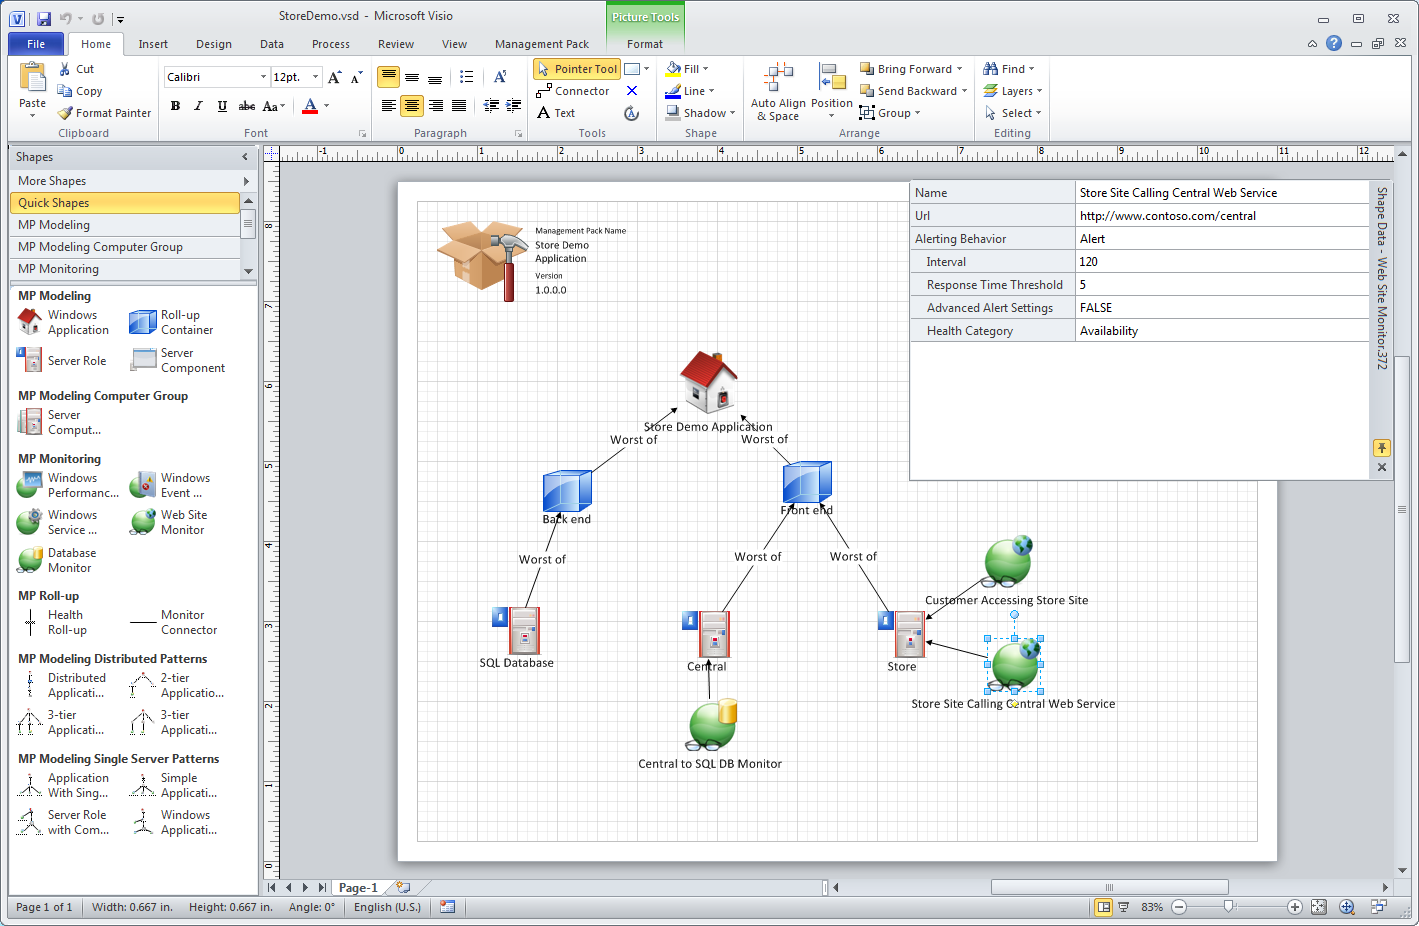
The structure of the application is set up in the drawing, so it’s time to add the monitors. The element of perspective is critical to understanding this drawing. The website monitors will be attached not to the web server role, but to the store role, because we care about the ability of the store server to access the web site. Likewise, the database monitor needs to be attached to the web server role, because what’s important here is the web server’s ability to access the database.
Add a Web Site Monitor shape to the Store shape. Name it “Customer Accessing Store Site,” because that’s the perspective you’re looking for here – a customer connecting directly to the application on the store server. Change the URL to http://www.contoso.com/store. Change the Alerting behavior to “Alert and Collect,” because you’ll want to report on this site’s availability later on.
Add another Web Site Monitor shape to the Store shape. Name this one “Store Site Calling Central Web Server.” Change the URL to http://www.contoso.com/central. This monitor will keep track of the store server’s ability to reach the central server, which is more valuable than measuring the availability from the central server itself. You have the IIS management pack installed already, so you’re already monitoring the web site’s health from a local perspective. Again, change the Alerting behavior to “Alert and Collect,” but leave the rest of the settings alone.
Next, add a Database monitor shape to the Central shape. Again, you’re not checking on the availability of the database from the local perspective (you have the SQL Server management pack to handle that), but from the perspective of the Central server. Provide a database server name of contoso.demo.store, and a database name of DemoStore. Set the Alerting behavior to Alert and Collect, and leave the rest alone.
The drawing is now complete. You can click the Generate Management Pack button and create the management pack as discussed in [[Validating a Drawing and Generating a Management Pack in Visio Management Pack Designer]].


