Windows Bugcheck Analysis
Why Windows Crashes?
Windows crashes (i.e.: stops executions and displays the blue screen) for many different reasons: a reference to a memory address that causes an access violation, an unexpected exception or trap, a faulting kernel mode driver and so on. It's important to understand that Windows could go on even in presence of serious problems during its execution, isolating the error and trying to recover someway: but the detected problem could be caused by a more deep and serious error that could result in more exceptions raised during the operating system processing that could finally lead to RAM and/or disk data corruption. This is unacceptable, of course, so Windows adopts a sort of "fail, fast and safe policy" that consists in stopping the execution, switching the display in a low-resolution VGA mode, painting a blue background, writing memory status and crash informations to a file (the memory dump file) and displaying a stop code containing a message and some indications to the user. "Blue Screen Of Death", "Bugcheck" and "Stop errors" are different words that represent the same class of unhandled exception that occurs in kernel mode execution and causes the system to shut down (and possibly reboot). The source of the issue can be anything from a power fluctuation in the system to a damaged component or a software/hardware bug.
In Windows 7 and previous versions, the BSOD looks like the following
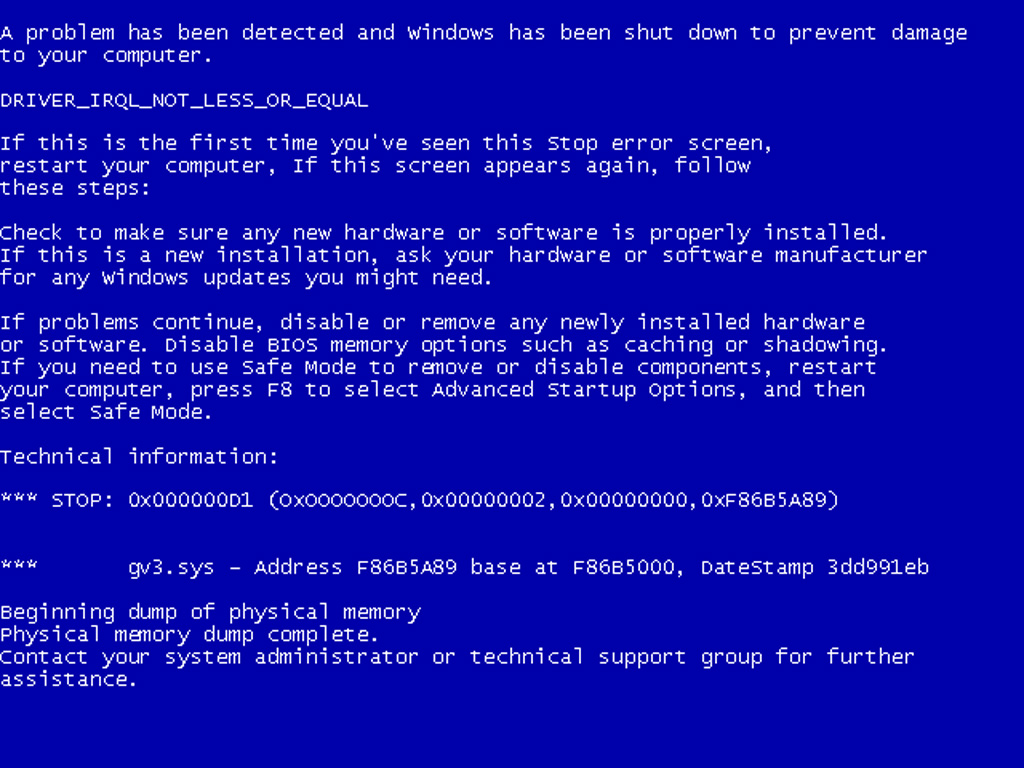 |
| Figure 1: the "actual" BSOD. |
whereas in Windows 8 it actually looks like the following (a little less "scary" than the previous one)
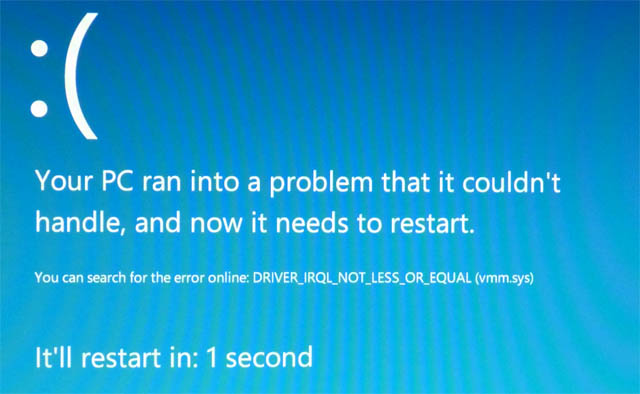 |
| Figure 2: BSOD. |
It's interesting to observe the distribution of the bugcheck according to their causes: the book "Windows Internals, 5th Edition" provides the following chart displaying the distribution of error categories for Windows Vista SP1 in September 2008.
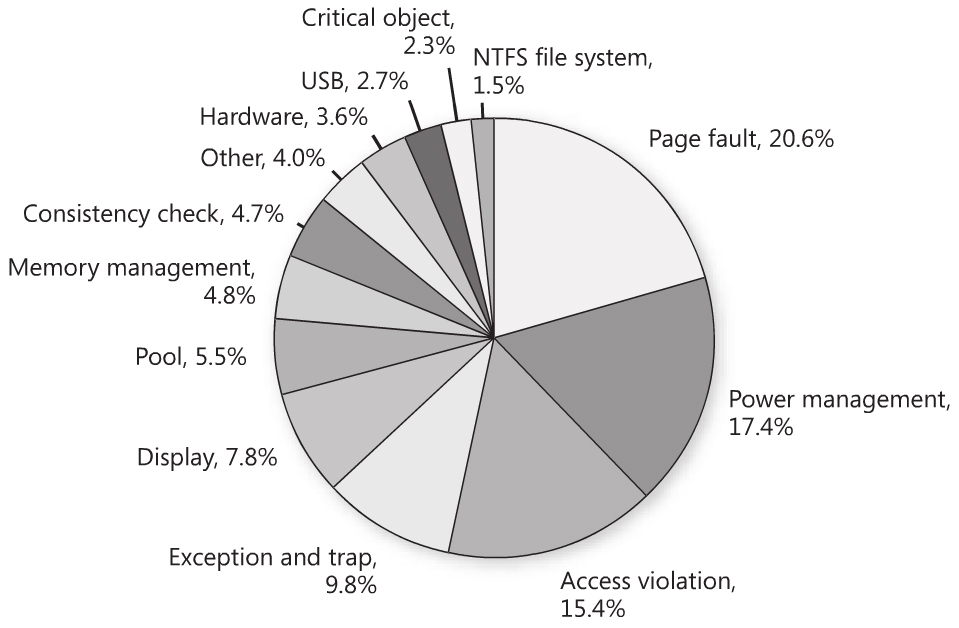 |
| Figure 3: distribution of error categories. |
Some Terminology
Blue screen: when the system encounters a hardware problem, data inconsistency, or similar error, it may display a blue screen containing information that can be used to determine the cause of the error. This information includes the STOP code and whether a crash dump file was created. It may also include a list of loaded drivers and a stack trace.
Crash dump file: you can configure the system to write information to a crash dump file on your hard disk whenever a STOP code is generated. The file (memory.dmp) contains information the debugger can use to analyze the error. This file can be as big as the physical memory contained in the computer. By default, it's located in the Windows\Minidump folder.
Debugger: a program designed to help detect, locate, and correct errors in another program. It allows the user to step through the execution of the process and its threads, monitoring memory, variables, and other elements of process and thread context.
Kernel mode: the processor mode in which system services and device drivers run. All interfaces and CPU instructions are available, and all memory is accessible.
Minidump file: a minidump is a smaller version of a complete, or kernel memory dump. Usually Microsoft will want a kernel memory dump. But the debugger will analyze a mini-dump and quite possibly give information needed to resolve. If it's all you have, then debug it, rather than waiting for the machine to crash again. Open the file in the debugger (see below) just as opening memory.dmp in the demonstration.
STOP code: the error code that identifies the error that stopped the system kernel from continuing to run. It is the first set of hexadecimal values displayed on the blue screen. At a minimum, frontline Admins should be required to note this code, and the four other codes displayed in parenthesis and any drivers identified on the screen. Often, this is all you really need.
Symbol files: all system applications, drivers, and DLLs are built such that their debugging information resides in separate files known as symbol files. Therefore, the system is smaller and faster, yet it can still be debugged if the symbol files are available. You don't need the Symbol files to debug: the debugger will automatically access the ones it needs from Microsoft's public site.
The Blue Screen
Regardless of the reason for a system crash, the function that actually performs the crash is KeBugCheckEx, documented in the Windows Driver Kit (WDK). This function takes a stop code (also called a bugcheck code) and four parameters that must be interpreted on a per–stop code basis. After KeBugCheckEx masks out all interrupts on all processors of the system, it switches the display into a low-resolution VGA graphics mode (one implemented by all Windows-supported video cards), paints a blue background and displays the stop code, followed by some text suggesting what the user can do. Finally, KeBugCheckEx calls any registered device driver bugcheck callbacks (registered by calling the KeRegisterBugCheckCallback function), allowing drivers an opportunity to stop their devices. It then calls registered reason callbacks (registered by calling the KeRegisterBugCheckReasonCallback function), which allow drivers to append data to the crash dump or write crash dump information to alternate devices. KeBugCheckEx displays the textual representation of the stop code near the top of the blue screen as well as the numeric stop code and the four parameters at the bottom of the blue screen: the first line in the Technical Information section lists the stop code and the four additional parameters passed to KeBugCheckEx; a text line near the top of the screen provides the text equivalent of the stop code’s numeric identifier (sometimes it's even possible that system data structures have been so seriously corrupted that the blue screen isn’t displayed).
Identifying the Stop Error
Many different types of Stop errors occur: each has its own possible causes and requires a unique troubleshooting process; therefore, the first step in troubleshooting a Stop error is to identify the Stop error. You need the following information about the Stop error to begin troubleshooting:
- stop error number: this number uniquely identifies the Stop error;
- stop error parameters: these parameters provide additional information about the Stop error. Their meaning is specific to the Stop error number;
- driver information: when available, the driver information identifies the most likely source of the problem. Not all Stop errors are caused by drivers, however.
This information is often displayed as part of the Stop message: if possible, write it down to use as a reference during the troubleshooting process. If the operating system restarts before you can write down the information, you can often retrieve the information from the "System" Event Log in Event Viewer. If you are unable to gather the Stop error number from the Stop message and the System Log, you can retrieve it from a memory dump file. By default, Windows is configured to create a memory dump whenever a Stop error occurs. If no memory dump file was created, configure the system to create a memory dump file. Then, if the Stop error reoccurs, you will be able to extract the necessary information from the memory dump file.
Understanding the Stop Message
The Stop message reports informations about the Stop error and assists the system administrator (who understands how to interpret the information) in isolating and eventually resolving the problem that caused the Stop error. The Stop message provides a great deal of useful information, including the Stop error number, or bugcheck code. The Stop message uses a full-screen character mode format and consists of several major sections, as shown in Figure 1, which display the following informations:
- Bugcheck Information: this section lists the Stop error descriptive name. Descriptive names are directly related to the Stop error number listed in the Technical Information section.
- Recommended User Action: this section informs the user that a problem has occurred and that Windows was shut down. It also provides the symbolic name of the Stop error (in Figure 1, the symbolic name is DRIVER_IRQL_NOT_LESS_OR_EQUAL). It also attempts to describe the problem and lists suggestions for recovery.
- Technical Information: this section lists the Stop error number, also known as the bugcheck code, followed by up to four Stop error–specific codes (displayed as hexadecimal numbers beginning with a "0x" prefix and enclosed in parentheses), which identify related parameters. In Figure 1, the Stop error number is 0x000000D1 (often written as 0xD1).
- Driver Information: this section identifies the driver associated with the Stop error.
- Debug Port and Dump Status Information: this section lists Component Object Model (COM) port parameters that a kernel debugger uses, if enabled. If you have enabled memory dump file saves, this section also indicates whether one was successfully written.
Collecting a Kernel-Mode Crash Dump
Most modern desktop installations of Windows are configured to collect small memory dumps automatically. The file dump generation settings can be configured in the "Advanced" tab of the "System Properties" window, as you can see in the Figure 4.
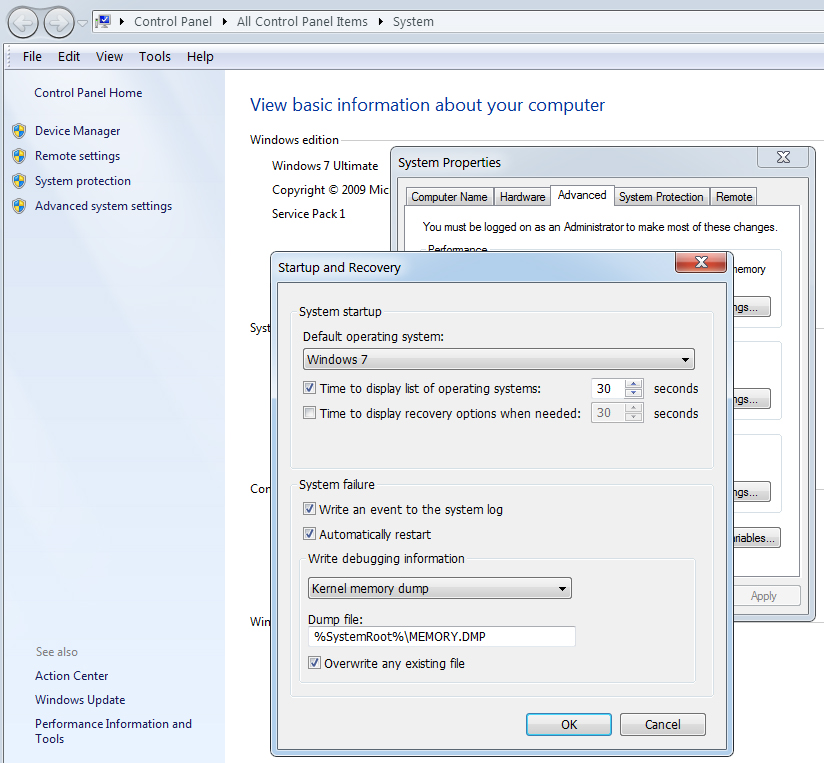 |
| Figure 4: setting the dump generation options. |
Table 1 summarizes the different locations that Windows uses to store the memory dump files (also read the Microsoft Knowledge Base article KB254649 "Overview of memory dump file options for Windows 2000, Windows XP, Windows Server 2003, Windows Vista, Windows Server 2008, Windows 7 and Windows Server 2008 R2").
|
Memory Dump Type |
Default Location (variable) |
Default Location (typical) |
Paging File Requirements |
|---|---|---|---|
| Small memory dump | %systemroot%\Minidump\ | c:\Windows\Minidump | >2 MB |
| Kernel memory dump | %systemroot%\Memory.dmp | c:\Windows\Memory.dmp | Large enough for kernel memory |
| Complete memory dump | %systemroot%\Memory.dmp | c:\Windows\Memory.dmp | All physical RAM + 1 MB |
Table 1: memory dump file location and size.
You can verify that the system correctly creates a dump file whenever a Stop error occurs by manually forcing a system crash: read the "How To Manually Initiate a Windows Stop Error and Create a Dump File (en-US)" page for further informations.
Preparing the Environment
The first step is getting the Debugging Tools you need to analyze the crash dump files produced after a system crash.
Older versione of the Debugging Tools were provided as standalone installers, that you can download from the Microsoft Windows Hardware Dev Center, paying attention to download and install the appropriate version according to your system's architecture (32 bit or 64 bit); modern versions are included with the Microsoft Windows SDK and the Windows Driver Kit.
If you decide to install the Windows SDK, be sure to check the check box to include the Debugging Tools in the installation process, as you can see in Figure 5.
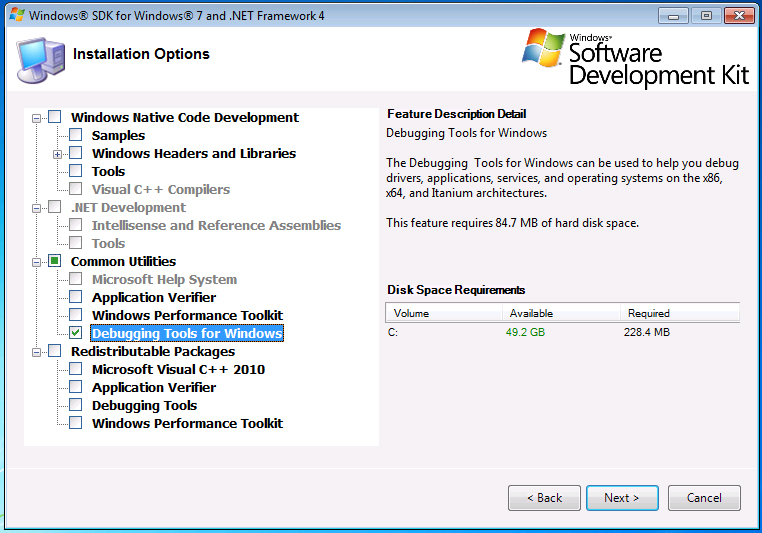 |
| Figure 5: installing the Windows SDK. |
After installation, the symbols path needs to be set to ensure that there are enough symbols for the debugger to determine what actually occurred and what was loaded. The entire symbol collection offered to the public can be downloaded and placed on a local drive, or an Internet location can be specified to pull the symbols on demand. I suggest you to pull them from the Internet: the correct version of the symbols will be downloaded on demand and will not become outdated by installation of hotfixes and service packs. The Microsoft Knowledge Base article "Use the Microsoft Symbol Server to obtain debug symbol files" (KB311503) provides you with the instructions to follow to use the Microsoft Symbol Server to obtain debug symbol files: basically, you can create a folder (for example, C:\Symbols) and set the environment variable
_NT_SYMBOL_PATH = srv*c:\Symbols*http://msdl.microsoft.com/download/symbols
as you can see in Figure 6.
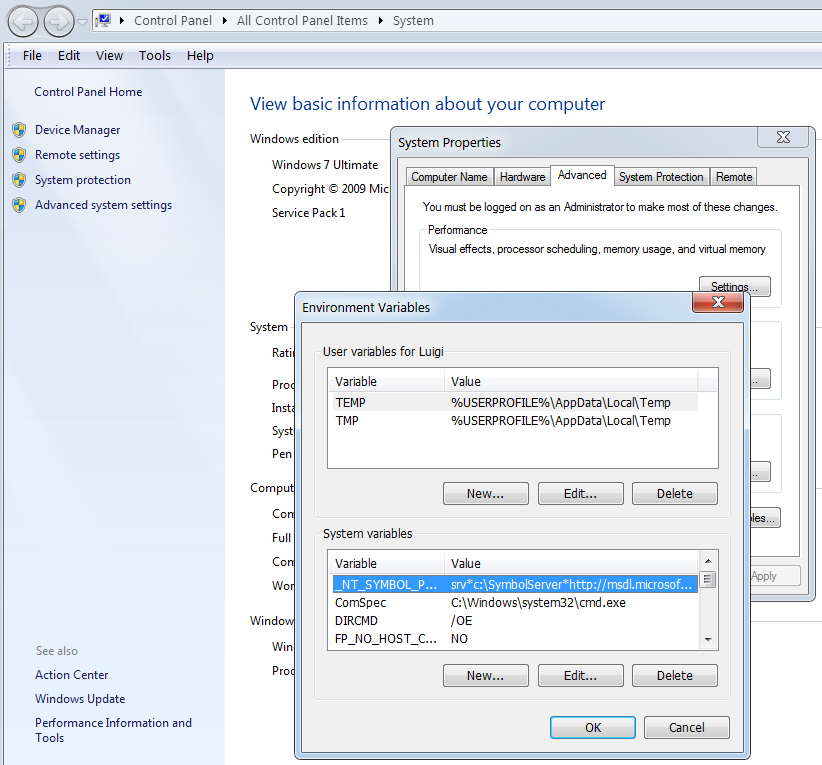 |
| Figure 6: setting the _NT_SYMBOL_PATH variable. |
Analyzing the Crash Dump File
Start WinDbg from the Start menu (the exact position of WinDbg will vary according to your Windows version) and select File -> Open Crash Dump... (or press CTRL+D): select the appropriate .DMP file and let the debugger perform its initial operations: the kernel symbols are loaded and the debugger displays some basic informations about the analyzed system and the reported bugcheck, along with the indication of the module that probably made the system crash.
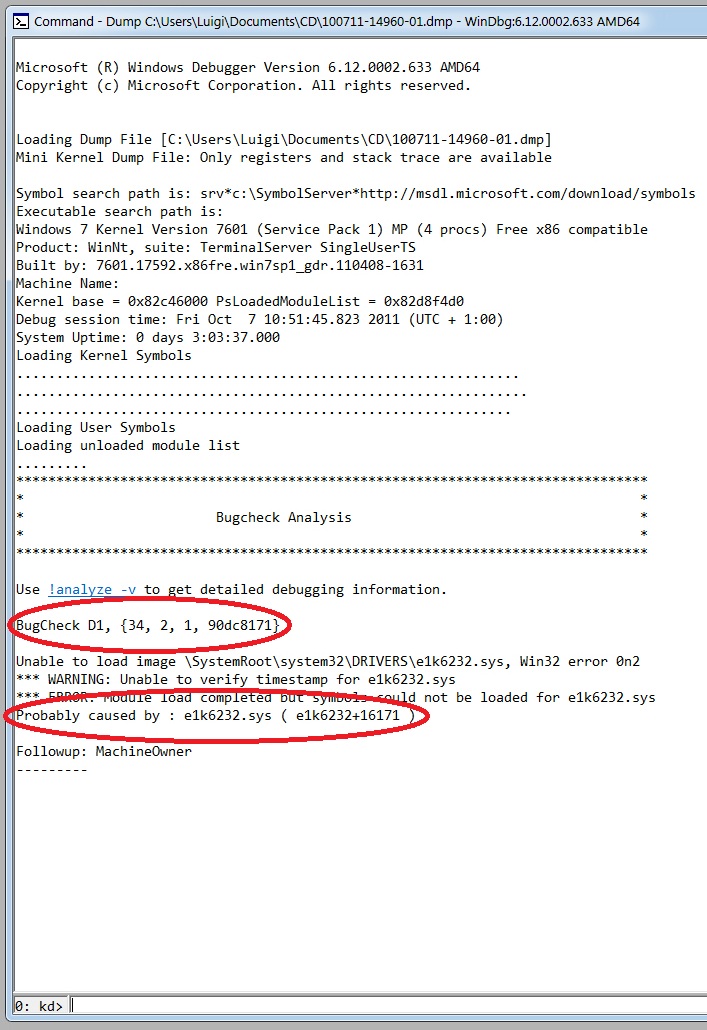 |
| Figure 7: starting the debugging process. |
After that, you need to get detailed informations about the current exception or bug check: in the lower pane of the Command windows, type the command "!analyze -v" and hit ENTER (the "-v" option displays verbose output).
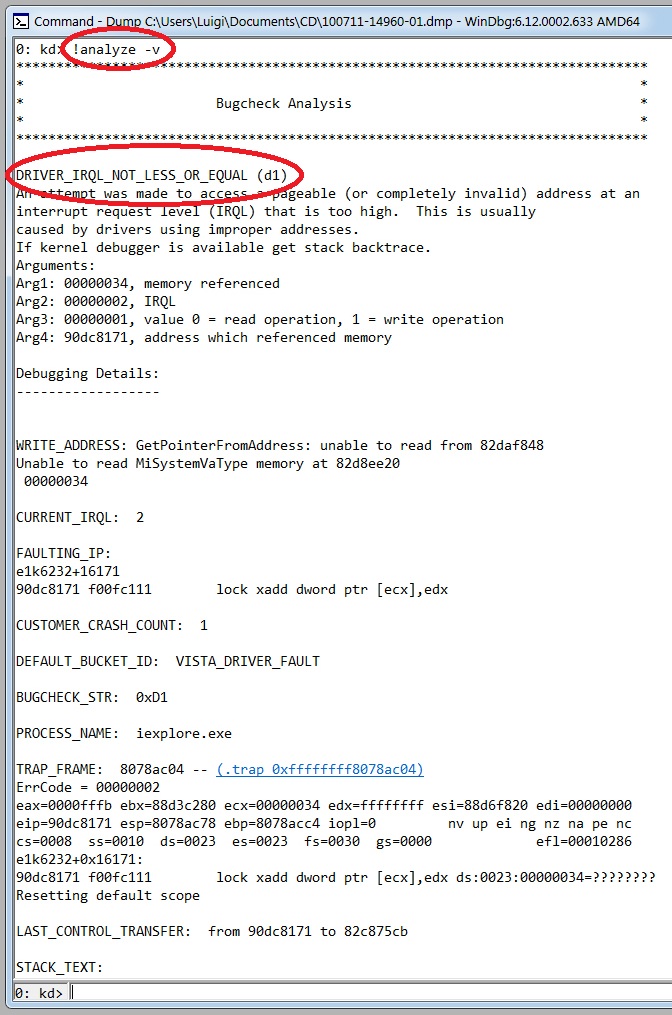 |
| Figure 8-a: analyzing the dump file (part 1). |
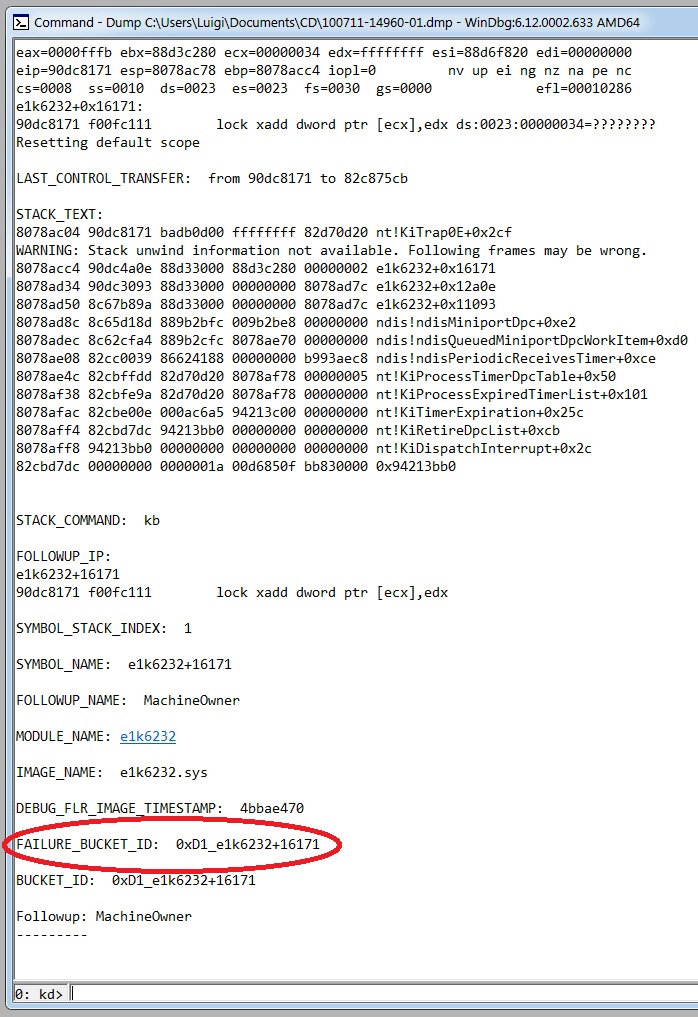 |
| Figure 8-b: analyzing the dump file (part 2). |
As you can see, the system crashed because of a DRIVER_IRQL_NOT_LESS_OR_EQUAL bugcheck, whose Stop code is 0x000000D1. The faulting module seems to be "e1k6232" (the image file is e1k6232.sys): we enter the "lm" command with some options ("v" causes the display to be verbose, including the symbol file name, the image file name, checksum information, version information, date stamps, time stamps, and information about whether the module is managed code; "m" specifies a pattern that the module name must match) as in the following
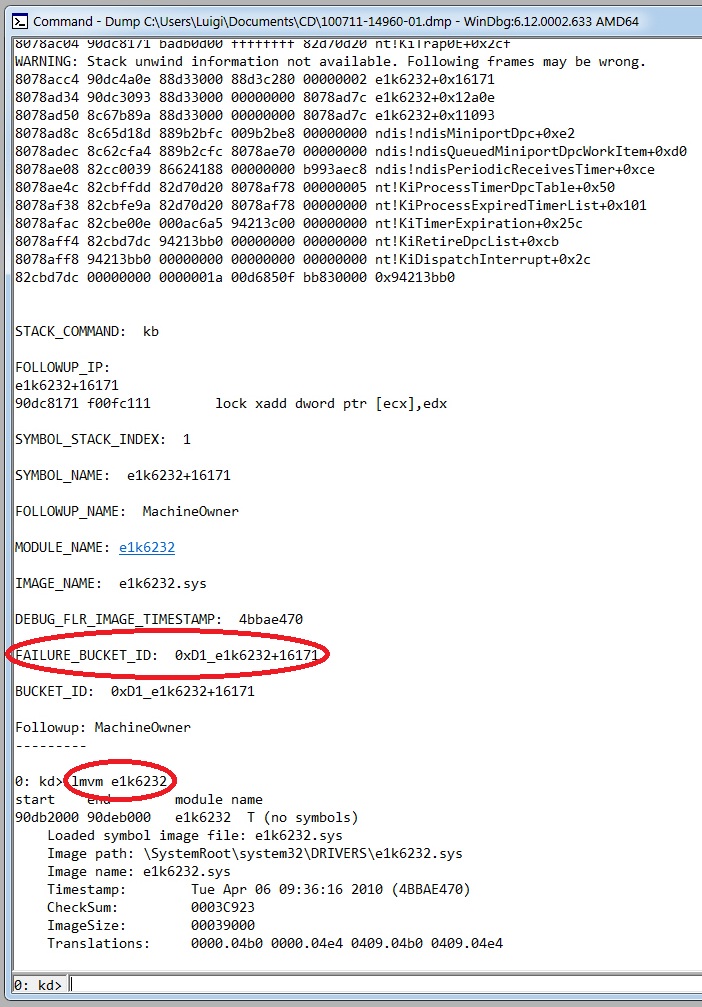 |
| Figure 9: displaying module informations. |
and we can get more informations about that module.
Then we perform a quich search on the web (http://systemexplorer.net/db/e1k6232.sys.html) and discover that "e1k6232.sys" is a driver belonging to the Intel Gigabit Adapter developed by Intel Corporation: in this case, we could fix the issue by downloading and installing an updated version of this driver (this DMP file comes from a PC really affected by this problem and updating the driver effectively solved the issue). Further troubleshooting is dependent on the specific error. Some errors may require the driver verifier to be enabled to determine a root cause: this tool verifies that drivers are not making illegal function calls or causing system corruption and it can identify conditions such as memory corruption, mishandled I/O request packets (IRPs), invalid direct memory access (DMA) buffer usage and possible deadlocks. The !verifier extension in the kernel debugger can be used to monitor and report on statistics related to Driver Verifier in context of a debugging session.
Common Stop Messages
The following Stop error descriptions can help you to troubleshoot problems that cause Stop errors.
Stop 0xA (IRQL_NOT_LESS_OR_EQUAL)
The Stop 0xA message indicates that a kernel-mode process or driver attempted to access a memory location to which it did not have permission or at a kernel IRQL that was too high. A kernel-mode process can access only other processes that have an IRQL lower than or equal to its own. This Stop message is typically the result of faulty or incompatible hardware or software. This Stop message has four parameters:
- memory address that was improperly referenced
- IRQL that was required to access the memory
- type of access
- 0x00 = read operation
- 0x01 = write operation
- address of the instruction that attempted to reference memory specified in parameter 1
If the last parameter is within the address range of a device driver used by the system, the driver itself can be determined by reading the line that begins with
**Address 0xZZZZZZZZ has base at <address>- <driver name>
If the third parameter is the same as the first parameter, a special condition exists in which a system worker routine—carried out by a worker thread to handle background tasks known as work items—returned at a higher IRQL. In that case, some of the four parameters take on new meanings
- address of the worker routine
- kernel IRQL
- address of the worker routine
- address of the work item
To resolve an error caused by a faulty device driver, system service or basic input/output system (BIOS), follow these steps
- restart the system;
- press F8 at the character-based menu that displays the operating system choices;
- select the Last Known Good Configuration option from the Windows Advanced Options menu; this option is most effective when only one driver or service is added at a time.
To resolve an error caused by an incompatible device driver, system service, virus scanner or backup tool, follow these steps
- check the System Log in Event Viewer for error messages that might identify the device or driver that caused the error;
- try disabling memory caching of the BIOS;
- run the hardware diagnostics supplied by the system manufacturer, especially the memory scanner;
- make sure the latest Service Pack and Windows updates are installed;
- if the system has small computer system interface (SCSI) adapters, contact the adapter manufacturer to obtain updated Windows drivers. Try disabling sync negotiation in the SCSI BIOS, checking the cabling and the SCSI IDs of each device and confirming proper termination;
- for integrated device electronics (IDE) devices, define the onboard IDE port as Primary only. Also, check each IDE device for the proper master/subordinate/stand-alone setting. Try removing all IDE devices except for hard disks.
If the Stop 0xA message is encountered while upgrading to a newer Windows version, the problem might be due to an incompatible driver, system service, virus scanner or backup. To avoid problems while upgrading, simplify hardware configuration and remove all third-party device drivers and system services (including virus scanners) prior to running setup. After successfully installing Windows, contact the hardware manufacturer to obtain compatible updates.
If the Stop error occurs when resuming from hibernation or suspend, read the Microsoft Knowledge Base articles 941492 and 945577.
If the Stop error occurs when starting a mobile computer that has the lid closed, refer to the Microsoft Knowledge Base article 941507.
Stop 0xD1 (IRQL_NOT_LESS_OR_EQUAL)
The Stop 0xD1 message indicates that the system attempted to access pageable memory using a kernel process IRQL that was too high. Drivers that have used improper addresses typically cause this error. This Stop message has four parameters:
- memory referenced
- IRQL at time of reference
- type of access
- 0x00 = read operation
- 0x01 = write operation
- address that referenced memory
Stop 0xD1 messages can occur after you install faulty drivers or system services. If a driver is listed by name, disable, remove, or roll back that driver to resolve the error. If disabling or removing drivers resolves the error, contact the manufacturer about a possible update. Using updated software is especially important for backup programs, multimedia applications, antivirus scanners, DVD playback, and CD mastering tools.
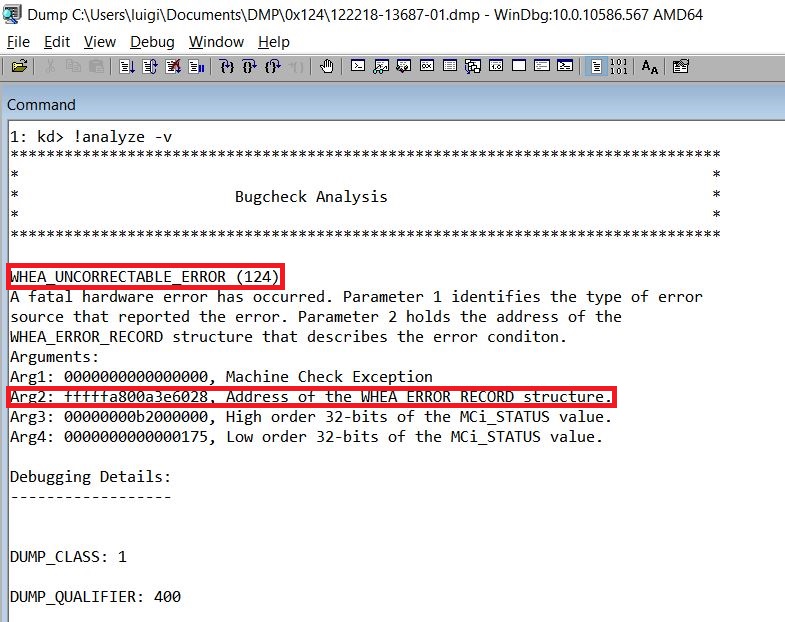
Stop 0x00000124 (WHEA_UNCORRECTABLE_ERROR)
The Stop 0x00000124 message occurs when Windows has a problem handling a PCI-Express device. Most often, this occurs when adding or removing a hot-pluggable PCI-Express card; however, it can occur with driver- or hardware-related problems for PCI-Express cards.
To troubleshoot 0x00000124 stop errors, first make sure you have applied all Windows updates and driver updates. If you recently updated a driver, roll back the change. If the stop error continues to occur, remove PCI-Express cards one by one to identify the problematic hardware. When you have identified the card causing the problem, contact the hardware manufacturer for further troubleshooting assistance. The driver might need to be updated, or the card itself could be faulty.
The meanings of the parameters are described in Table 2.
|
Parameter 1 |
Parameter 2 |
Parameter 3 |
Parameter 4 |
Cause of error |
|---|---|---|---|---|
0x0 |
Address of WHEA_ERROR_RECORD structure. |
High 32 bits of MCi_STATUS MSR for the MCA bank that had the error. |
Low 32 bits of MCi_STATUS MSR for the MCA bank that had the error. |
A machine check exception occurred. These parameter descriptions apply if the processor is based on the x64 architecture, or the x86 architecture that has the MCA feature available (for example, Intel Pentium Pro, Pentium IV, or Xeon). |
0x1 |
Address of WHEA_ERROR_RECORD structure. |
Reserved. |
Reserved. |
A corrected machine check exception occurred. |
0x2 |
Address of WHEA_ERROR_RECORD structure. |
Reserved. |
Reserved. |
A corrected platform error occurred. |
0x3 |
Address of WHEA_ERROR_RECORD structure. |
Reserved. |
Reserved. |
A nonmaskable Interrupt (NMI) error occurred. |
0x4 |
Address of WHEA_ERROR_RECORD structure. |
Reserved |
Reserved. |
An uncorrectable PCI Express error occurred. |
0x5 |
Address of WHEA_ERROR_RECORD structure. |
Reserved. |
Reserved. |
A generic hardware error occurred. |
0x6 |
Address of WHEA_ERROR_RECORD structure |
Reserved. |
Reserved. |
An initialization error occurred. |
0x7 |
Address of WHEA_ERROR_RECORD structure. |
Reserved. |
Reserved. |
A BOOT error occurred. |
0x8 |
Address of WHEA_ERROR_RECORD structure |
Reserved. |
Reserved. |
A Scalable Coherent Interface (SCI) generic error occurred. |
0x9 |
Address of WHEA_ERROR_RECORD structure. |
Length, in bytes, of the SAL log. |
Address of the SAL log. |
An uncorrectable Itanium-based machine check abort error occurred. |
0xA |
Address of WHEA_ERROR_RECORD structure |
Reserved. |
Reserved. |
A corrected Itanium-based machine check error occurred. |
0xB |
Address of WHEA_ERROR_RECORD structure. |
Reserved. |
Reserved. |
A corrected Itanium platform error occurred. |
Table 2: meanings of the parameters.
This kind of bugcheck requires a little more analysis to understand the reason of the problem.
As always, start by executing the !analyze -v extension on the memory dump file to get more detailed information about the error.
Pay special attention to the value of the second argument of the bug check: it is the address of the WHEA_ERROR_RECORD structure that describes an error record that contains error information about a hardware error condition that occurred.
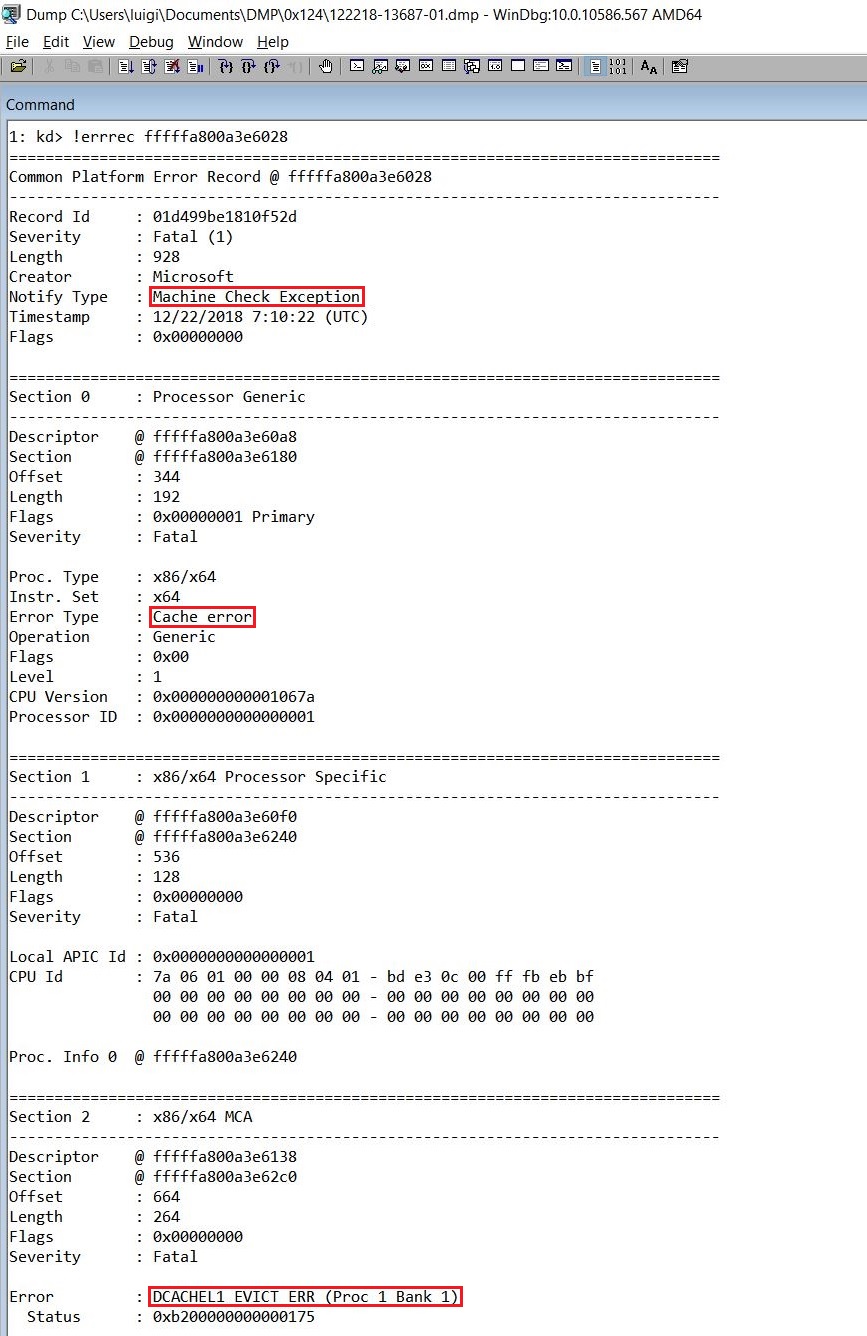
In order to understand which hardware component could have been caused the error, execute the !errrec extension to display the contents of the Windows Hardware Error Architecture (WHEA) error record created at the bug check time and recorded in the dump file: the value of the second argument of the bug check must be passed to this extension.
In this case, the analysis revelead an error in L1 cache of the CPU.
Community Resources
MSDN Web Pages
- How to Debug Kernel Mode Blue Screen Crashes (for beginners)
- Blue Screen Data
- General Troubleshooting Tips
- Bug Check Code Reference - Descriptions of the common bug checks, including the parameters passed to the blue screen. It also describes how you can diagnose the fault which led to the bug check and possible ways to deal with the error.
- Using Driver Verifier
- Interpreting a Bug Check Code (Windows Drivers)
Blogs Posts
- Ntdebugging Blog
- Ask the Core Team Blog
- "The Case of the Crashed Phone Call" - Another example of a bugcheck analysis by Mark Russinovich.
- Troubleshoot a Windows bluescreen, a.k.a bugcheck, a.k.a blue screen of death - An example of bugcheck analysis from the NDIS MSDN Blog.
- What causes a bug check 0xD1 (IRQL_NOT_LESS_OR_EQUAL) - Suggestions about troubleshooting a very common bugcheck from the NDIS MSDN Blog.
- You got a B.S.O.D. (Blue Screen of Death, known as Bug Checks), now what?
- Understanding Bugchecks
- Understanding Crash Dump Files
Microsoft Knowledge Base Articles
- Checking Crashdump File for Corruption (KB119490)
- Blue Screen Preparation Before Contacting Microsoft (KB129845)
- How to Verify Windows Debug Symbols (KB148660)
- Using Driver Verifier to identify issues with Windows drivers for advanced users (KB244617)
- How to read the small memory dump files that Windows creates for debugging (KB315263)
Videos
- Windows Crash Dump Analysis (TechEd 2009 Videos) - Daniel Pearson of David Solomon Expert Seminars wades into crash dumps using Microsoft Debugging Tools in real-life cases of hung and crashing systems at Tech•Ed Europe.
See Also
Books
- Windows Internals, 4th Edition (Chapter 14, "Crash Dump Analysis") by David A. Solomon and Mark E. Russinovich (Microsoft Press, December 2004)
- Windows Internals, 5th Edition (Chapter 14, "Crash Dump Analysis") by David A. Solomon, Mark E. Russinovich and Alex Ionescu (Microsoft Press, June 2009)
- Windows 7 Resource Kit (Chapter 32, "Troubleshooting Stop Messages") by Mitch Tulloch, Tony Northrup, Jerry Honeycutt, Ed Wilson, and the Windows 7 Team at Microsoft (Microsoft Press, October 2009)
- Inside Windows Debugging (Chapter 4, "Postmortem Debugging") by Tarik Soulami (Microsoft Press, May 2012)
Technical Articles
- Analyzing Windows Crash Dump Files (The Code Project, 31 October 2008)
- How to Use Microsoft's Driver Verifier to Interpret Unanalyzable Crash Dump Files (The Code Project, 19 November 2008)
Web Sites
- Dumpanalysis.org - Memory Dump, Software Trace, Debugging, Malware and Intelligence Analysis Portal.
Other Languages
This article is also available in the following languages:
