SharePoint: Generate and report AD account metrics in SharePoint Part 5: present AD metrics in a SharePoint 2010 dashboard
Article Series
- Part 1: How to get basic AD Metrics
- Part 2: Getting more complex AD metrics
- Part 3: Getting still more complex AD metrics
- Part 4: How to store AD metrics in SharePoint 2010
- Part 5: How to present AD metrics in a SharePoint 2010 dashboard < you are here
Introduction
In the previous posting in this series, we explored how to harvest basic Active Directory account metrics, using a PowerShell script running on the server hosting the SharePoint Server 2010 instance, and then writing those metrics to a list in the SharePoint Server 2010 instance. In this last and final posting in the series, we'll explore methods for presenting those metrics in a SharePoint 2010 dashboard using the Data View and Chart web parts. This will involve the following steps:
- Step 1: create a new page
- Step 2: customize the page
- Step 3: add data view web part and configure
- Step 4: add a chart web part and configure.
- Step 5: test
As noted at the beginning of this series, while this project was originally developed for SharePoint 2010, the concepts presented here remain applicable to SharePoint 2013 and SharePoint 2016. The one thing different is that you will not be able to use the WYSIWYG editor for configuring the Dataview Webpart, as SharePoint Designer 2013 no longer features this.
Step 1: create page
- Open a browser and connect to the site
- Navigate to the Site Pages folder
- Add a new page to this folder, naming it dashboard.
Step 2: customize page
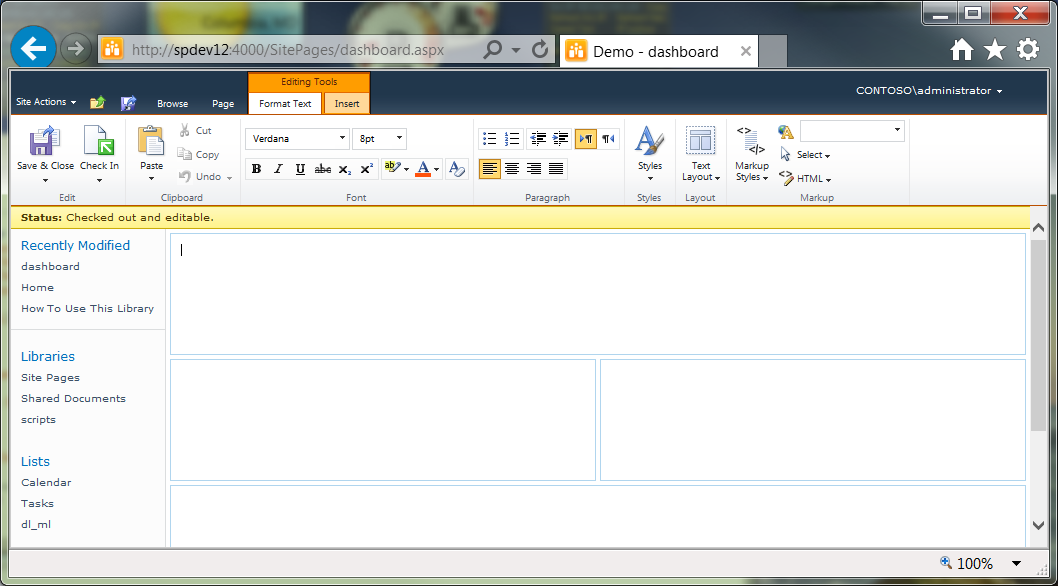
With the page open for editing, select a Text Layout
Save and close the page.
Launch Designer, and then open the page for editing.
In the bottom most web part zone, insert a Content Editor web part.
Link this web part to a text file containing CSS that hides the Recently Modified group in the Quick Launch navigation section of the page.
Save the page and continue to the next step.
Step 3: Add Data View web part
Launch SharePoint Designer 2010, and then connect to the site.
Open dashboard.aspx for editing.
Carefully insert the cursor into a cell, making sure it goes into the DIV container within that cell -
On the Insert ribbon, click Data View, and then click Empty Data View. An empty Data View web part is added and the Data Source Details task view appears.
On the Data Source Details task pane, select the fields to be inserted (these will be the ones displaying integer values), and then select Multiple item View: -
In Design view, on the Data View web part, select any column header, and then click the Bold button on the Home -
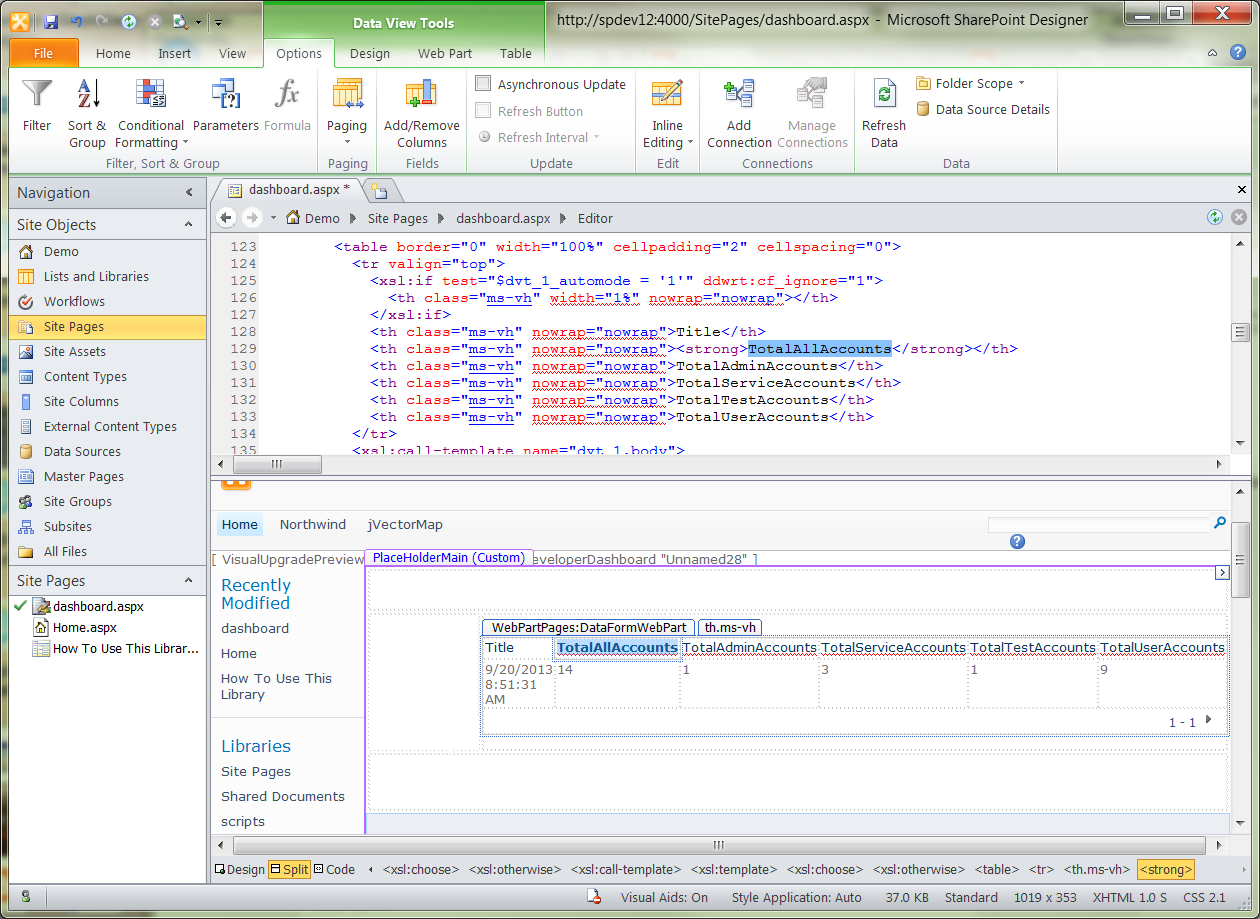
Select the Split view tab to see both design and code simultaneously.
In Code view, edit the column headers -
Other possible customizations:
Configure the data view:
- Web part title: Total Accounts by Type.
- Chrome Type: Title Only.
- Chrome State: Normal.
Save the page, and then close the page in Designer. If this page was checked out, check it back in.
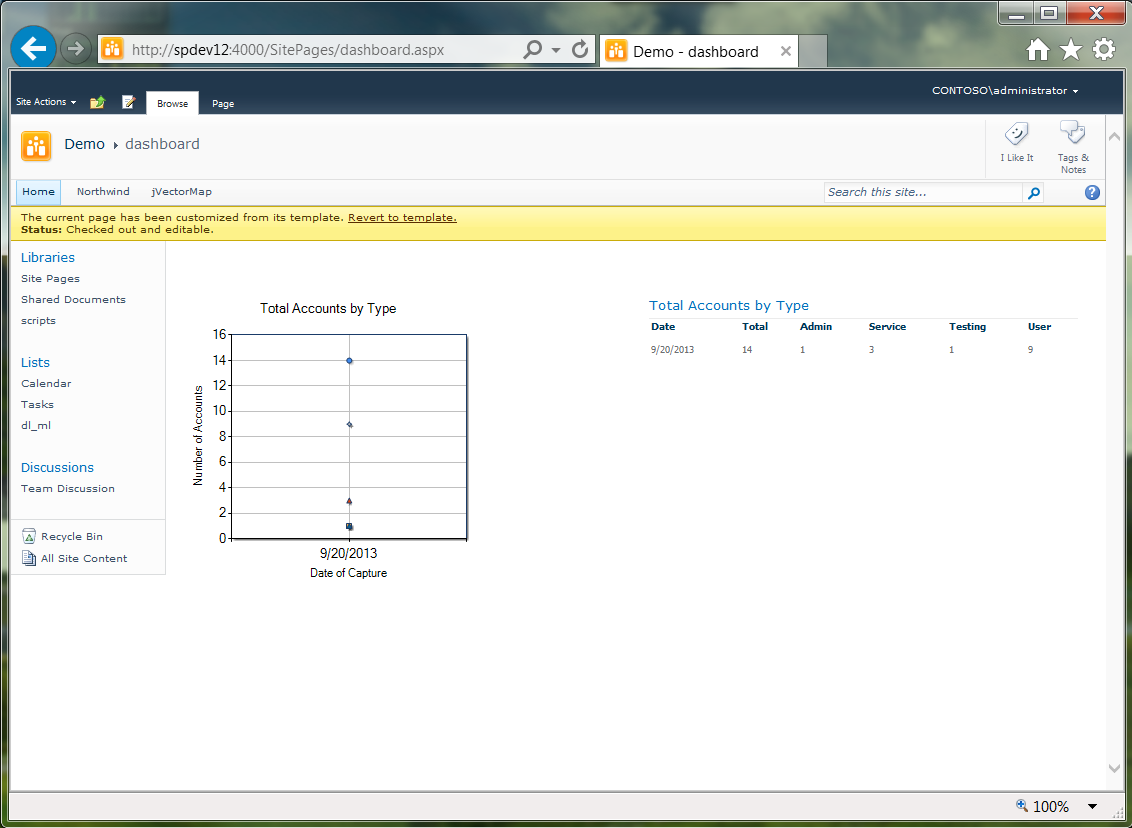
Open a browser and navigate to dashboard.aspx to see the results thus far: -
Step 4: Add Chart web part
In the browser, check out and open the page for editing.
From the Insert tab, click Web Part; from the Categories pane, select Business Data; and then from the Web Parts pane, select Chart Web Part.
Click Add -
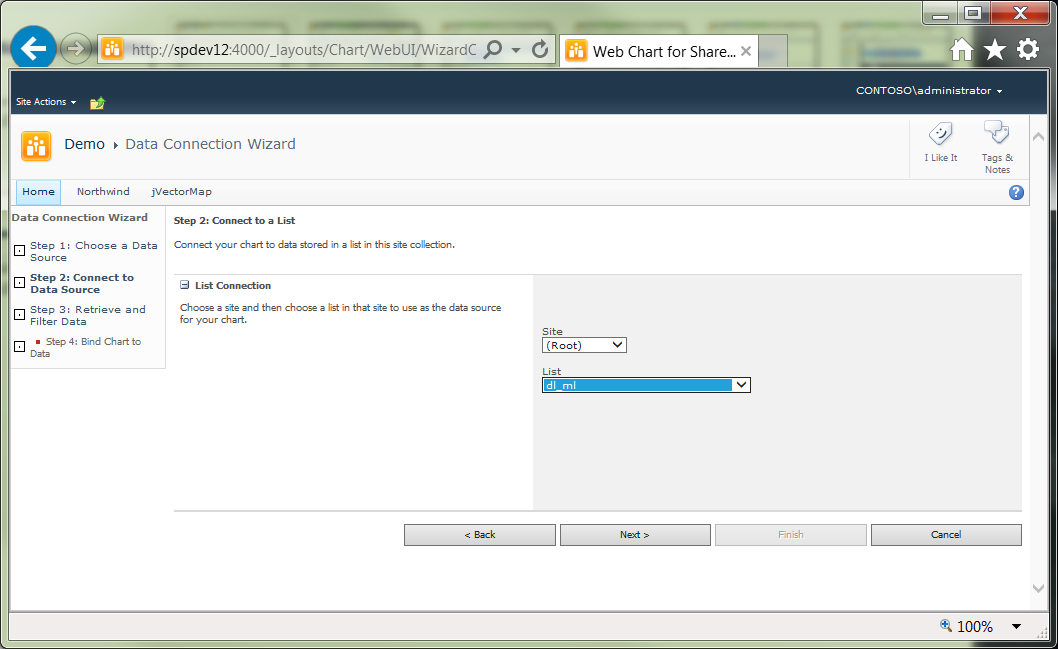
On the Chart web part, click Data & Appearance, click Connect Chart to Data, and then select Connect to a List.
Click Next. From the List dropdown, select the data list -
Click Next, and then click Next again.
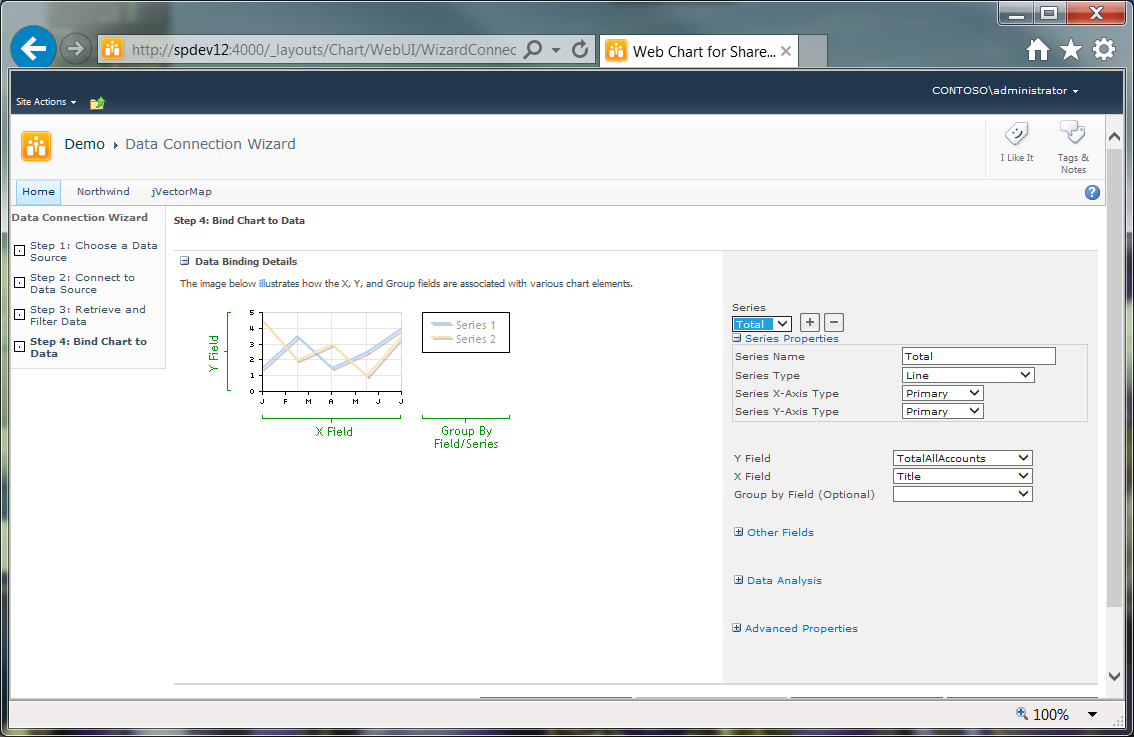
Configure the Default series as so:
Click the "+" icon next to the Series dropdown.
Configure the second series as so:
Repeat this process for each of the other totals: Service, Test, User.
Click Finish -
On the Chart web part, click Advanced Properties.
At left, in the Select an Element link group, click Series.
Above, from the Series Menu dropdown, select Total.
In the list of properties, scroll down to MarkerStyle; click it to open the dropdown and then select a value -
Pause for a few seconds to allow the Chart Preview image at right to refresh, before proceeding to make the next change. Otherwise, any changes will be lost.
Above, from the Series Menu dropdown, select Admin, and repeat.
Repeat these steps for each of the other series (Service, Test, User) -
At left, in the Select an Element link group, click Titles.
Click the "+" sign next to the Titles Menu dropdown.
Below, in the list of properties, scroll down to Text (near the bottom), enter a title, and then press Enter -
Pause to allow the Chart Preview to refresh.
Change other title properties as desired (e.g., font).
At left, in the Select an Element link group, click Chart Areas.
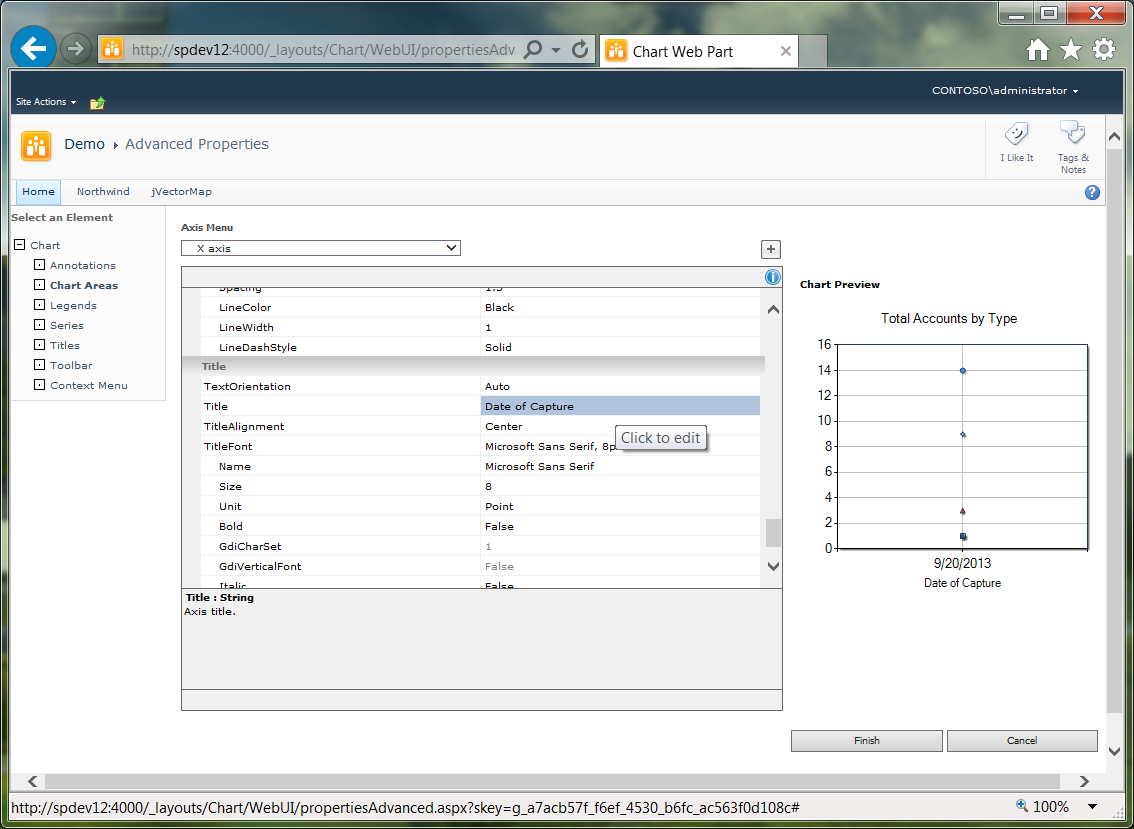
Above, from the Axis Menu dropdown, select X axis.
Below, scroll down the list of properties to Title (near the bottom), enter text, and then press Enter -
Pause to allow the Chart Preview to refresh.
Repeat this for y axis.
Click Finish
Open the page in Designer.
On the Format ribbon, click Chrome Type, and then select None.
Select the Split view.
On the Home ribbon, click Advanced Mode.
Press CTRL+V, enter the search keyword ShowToolbar, and then click Find Next
In Code view, change the ShowToolbar Chart web part property to False.
Close the Find and Replace dialog.
Save the page.
Refresh the browser to see the changes
Step 5: Test
To see the results of several days data capture, enter some sample data into the list, and then refresh the browser
Summary
In this posting of the PowerShell Metrics series, we have explored how to present the Active Directory metrics discussed previously in both list and chart formats.
References
- Microsoft Office: Create data views in SharePoint Designer
- ShareTheLearning: The LCID and FormatFlag in the ddwrt:FormatDate method
- Microsoft Developer Network: Standard Date and Time Format Strings
- Microsoft Developer Network: Chart Controls
- MSDN Archive: Samples Environment for .NET Framework 4 Chart Controls Released!
- Microsoft Office: Introduction to the Chart Web Part
- Jack Moore: jQuery Tabs Tutorial
Notes
After inserting the Data View onto the page, the specific XML generating each of the headers will not be exposed. In Split view, if the you select the column header while in the Design view, you will see a group of markup selected in Code view but not specific reference to markup associated with the item selected:
To expose this XML, use the trick of selecting a header in design view and then bolding it. This cause Designer to rewrite the XML to specifically script the generation of each header. Once exposed, you can edit the headers individually as needed
SharePoint Server 2010 Standard or Enterprise? It isn't necessary to expend resources to upgrade SharePoint Server 2010 Standard, as the methods presented here work for either.
SharePoint Server 2010 Chart web part: this web part is based upon the standard .NET chart control. The SharePoint version has limited documentation, and the vast majority of its properties are not documented per se. These can, however, be discovered for the most part by reviewing documentation for the .NET chart control.
