SharePoint 2013: Case Study on Optimizing the Search Crawl Interval
Introduction
This posting captures the steps performed with regard to optimizing the search crawl interval for a small production SharePoint 2013 farm. Content size included approximately 100,000 items in two content databases, totaling approximately 60 GB. The customer farm was approximately 320 users, of which about 30% engaged the farm on any given workday. Working hours were from 7 AM to 7 PM. Query usage was minimal. However, a number of new search-driven web parts had been implemented and other, content query web parts were being migrated to search-driven implementations. The move to search-driven web parts was precipitated by an earlier upgrade to SharePoint 2013.
Originally, a crawl interval of 2 hours had been adequate. However, after the migration to 2013, the customer-implemented search-driven web parts required a more a current index. Before implementing a shorter crawl interval, the relative impacts of decreasing the crawl interval and even using the continuous crawl interval, were explored so as to identify what the best crawl interval in fact was.
Much more data was collected then is presented here, which presents just the most salient charts and data that were collected. The study found that a crawl interval of 30 minutes was optimal for the customer content. Further decreases in the crawl interval did not yield any significant gains in crawl freshness - neither did the use of continuous crawling, which was an unexpected result.
Method
Two tools were used to obtain the data for this analysis, SharePoint Search Crawl Health Reports and Windows Server Performance Monitor.
Data
The first step in this study was to obtain relevant baseline configuration data and performance data associated with the existing crawl intervals. Baseline configuration data was for a single local content source.
Baseline Configuration
Search Component Topology
| Server Name | Admin | Crawler | Content Processing | Analytics Processing | Query Processing | Index Partition |
|---|---|---|---|---|---|---|
| APP1 | ✓ | ✓ | ✓ | ✓ | ||
| WFE1 | ✓ | ✓ | ||||
| WFE2 | ✓ | ✓ |
Crawling Intervals
| Type | Schedule |
|---|---|
| Full | 10 PM Sundays |
| Incremental | 7 AM - 7 PM, every two hours, Monday - Friday |
Baseline Performance
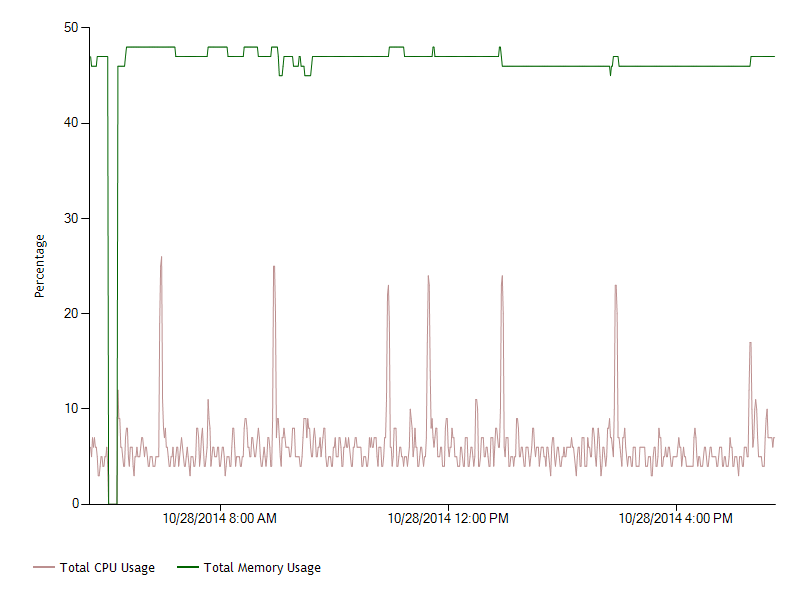
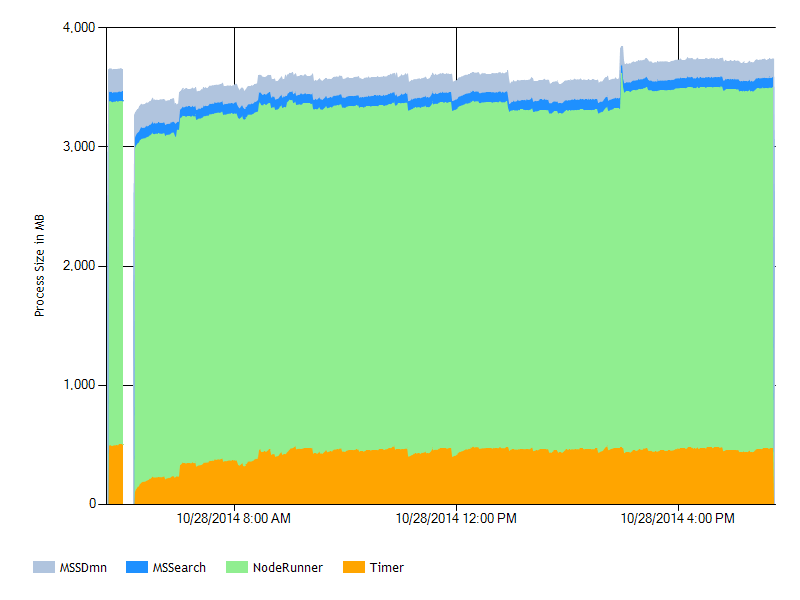
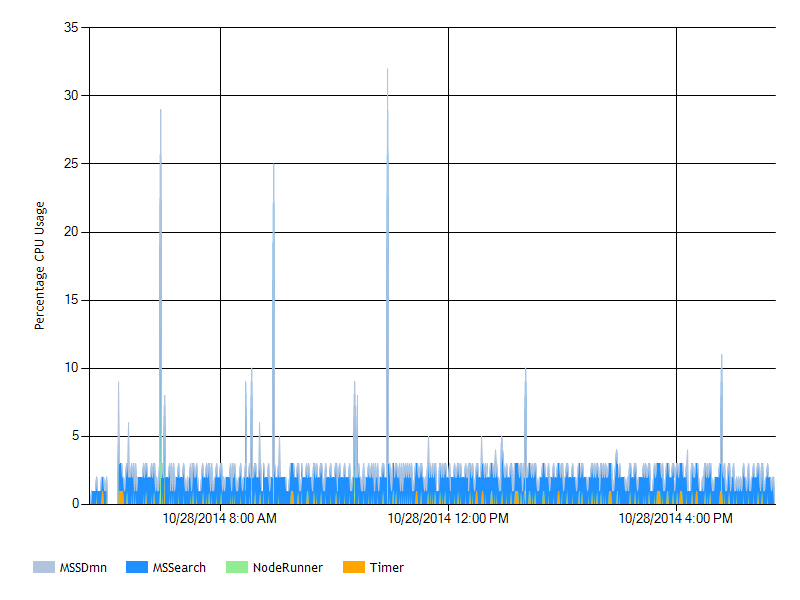
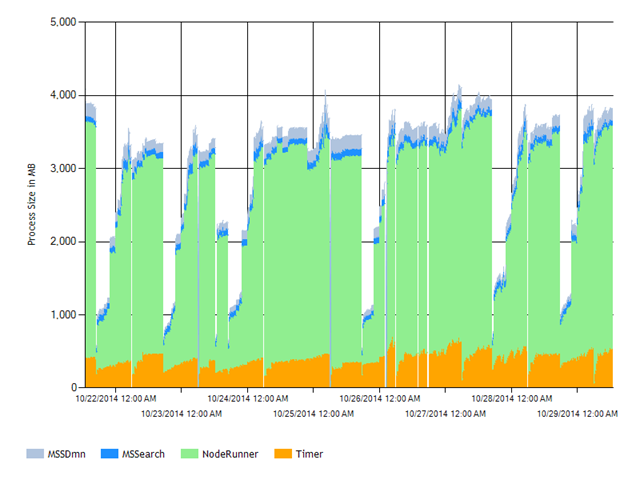
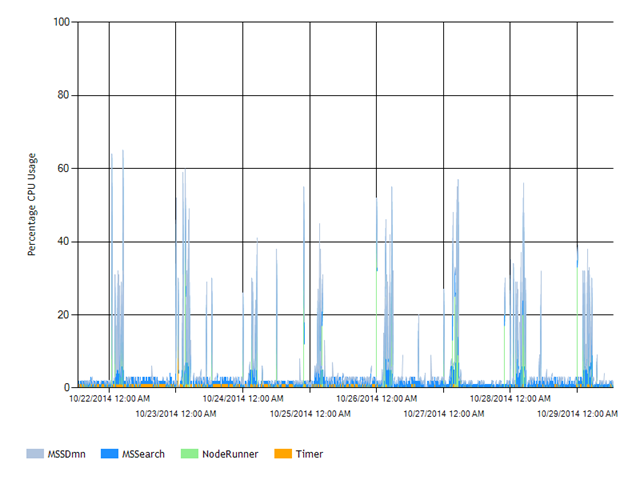
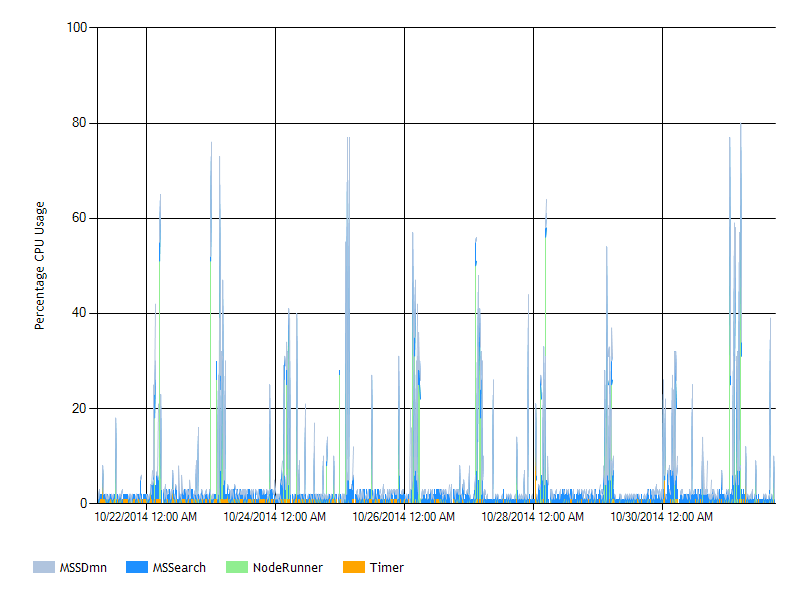
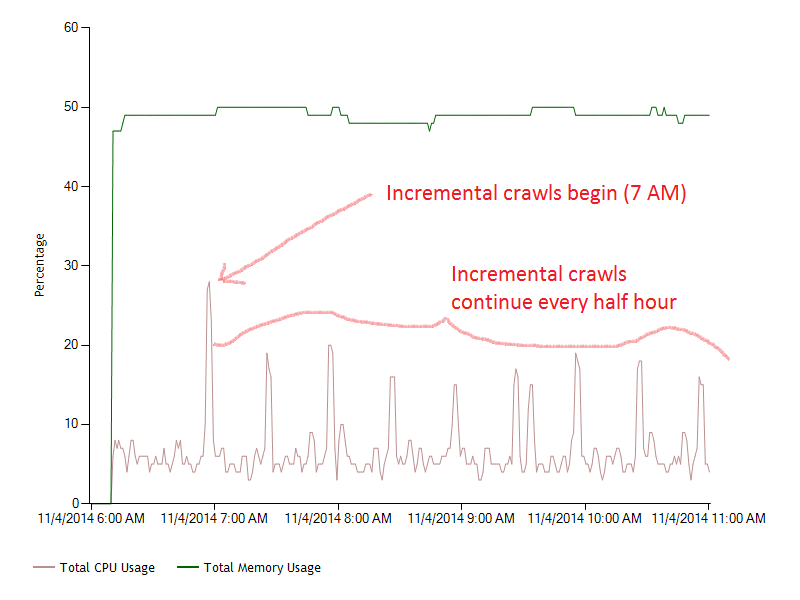
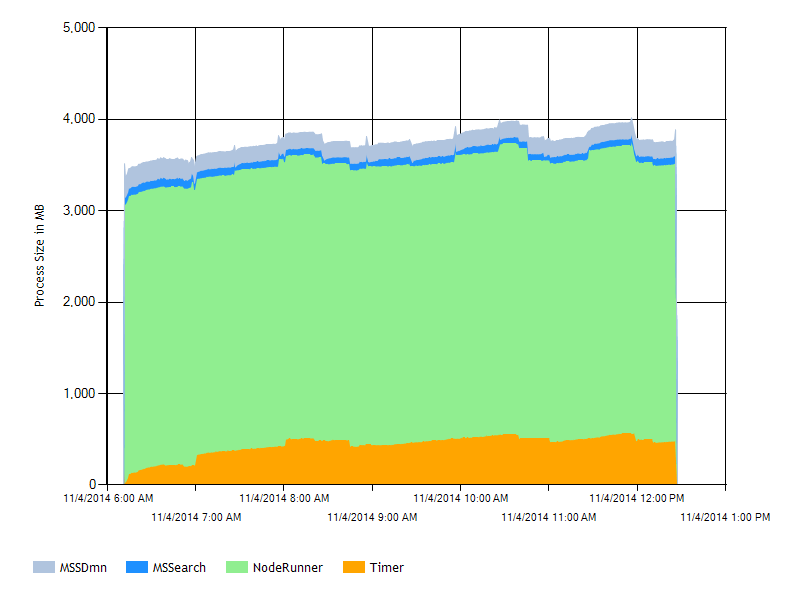
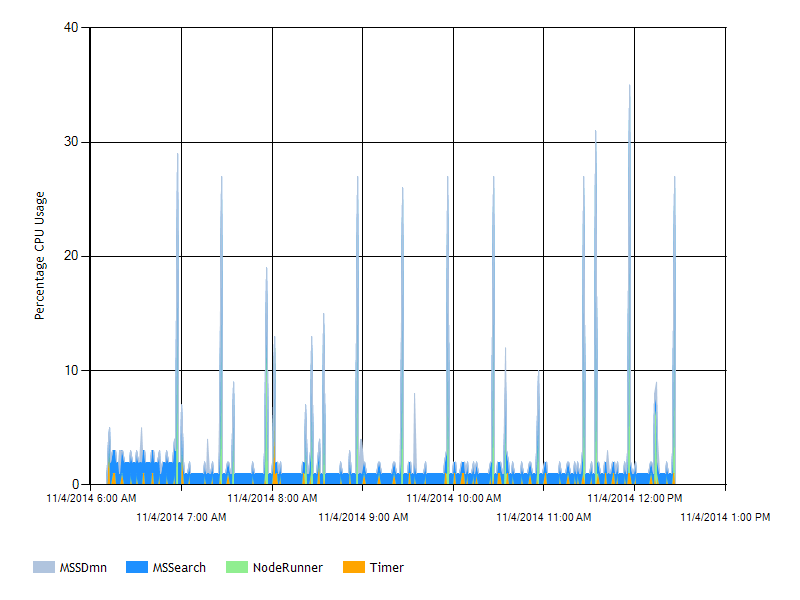
One Day Crawl History
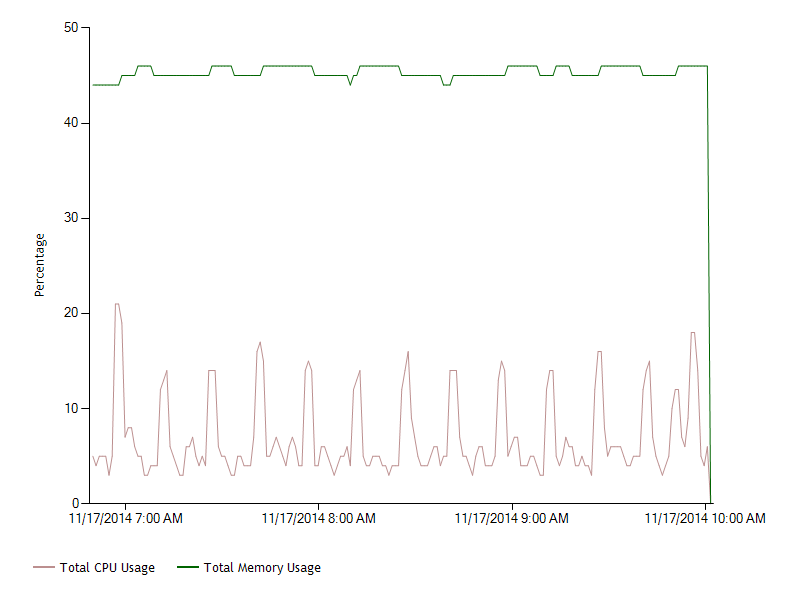
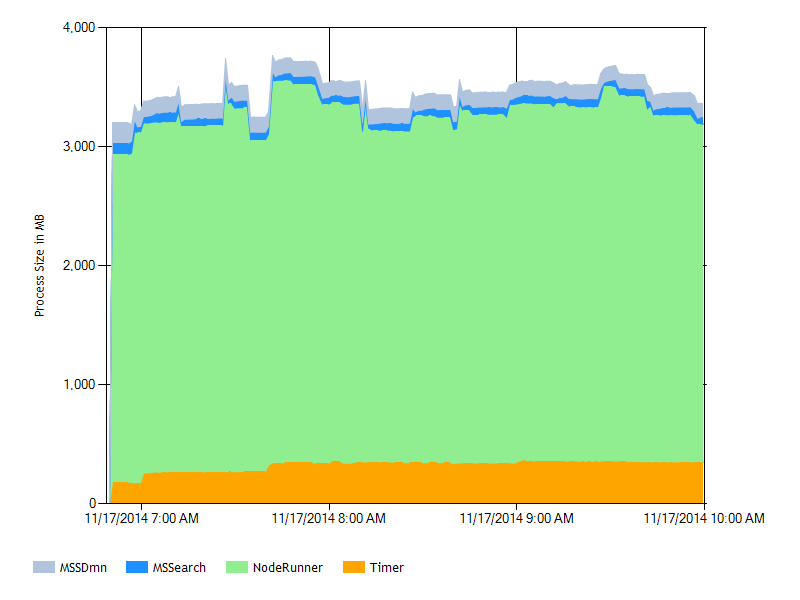
Analysis: these one-day charts represent that typical usage for M-F workdays that was observed.
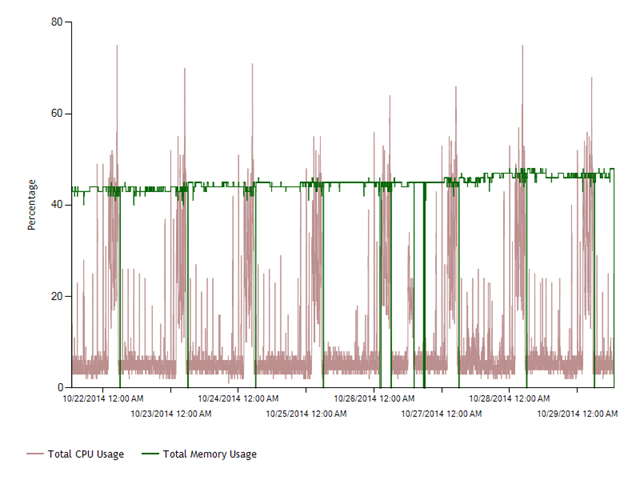
Crawl History Over 8 Days
Analysis: these results demonstrated to me that application server load was well within acceptable limits, and that these results were consistent.
Performance Testing
60 Minute Incremental Crawls
In this test, the incremental crawl interval was changed to 1-hour, and then this change in crawl interval was monitored over a workday period and then for a one week period.
Reviewing the Crawl Freshness results found them to be consistent with a one-hour crawl interval:
| Summary | Distribution by Freshness |
||||||||||
|---|---|---|---|---|---|---|---|---|---|---|---|
| Content Source |
Aggregate Freshness |
# Documents |
<10m |
<30m | <1h | <4h | <12h | <1D | <2D | <3D | >3D |
| Local SharePoint sites |
<1h |
155 |
17% |
60% |
95% | 98% | 98% | 98% | 98% | 100% | 100% |
(m = minute, h = hour, D = day)
The way to interpret this table is something like: "17% of all changes made to documents in SharePoint during the last 10 minutes are fully indexed; 60% of all changes to documents made during the last half hour are fully indexed..." and so on.
Analysis: No significant crawl-related adverse trends and impacts observed for this crawl interval.
30-minute Incremental Crawls
In this performance test, the crawl interval was changed to 30 minutes, and then monitored over a one day period
Review of the Crawl Freshness results found them consistent with a 30-minute crawl interval:
| Summary | Distribution by Freshness |
||||||||||
|---|---|---|---|---|---|---|---|---|---|---|---|
| Content Source |
Aggregate Freshness |
# Documents |
<10m |
<30m | <1h | <4h | <12h | <1D | <2D | <3D | >3D |
| Local SharePoint sites |
<30m |
200 |
53% |
96% |
100% | 100% | 100% | 100% | 100% | 100% | 100% |
Analysis: no significant crawl-related adverse trends and impacts observed for reducing the incremental crawl interval to 30 minutes; content freshness improved.
15-Minute Incremental Crawls
In this performance test, the crawl interval was changed to 15 minutes, and then monitored over a one day period
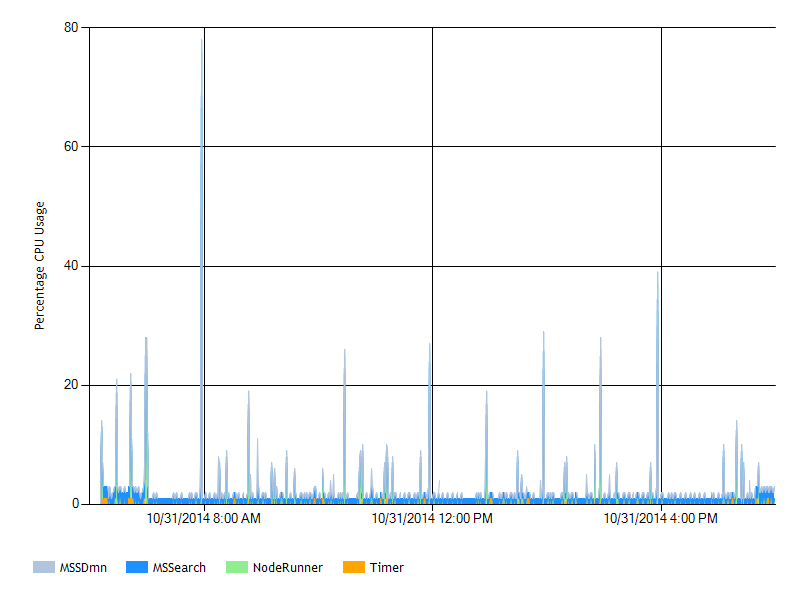
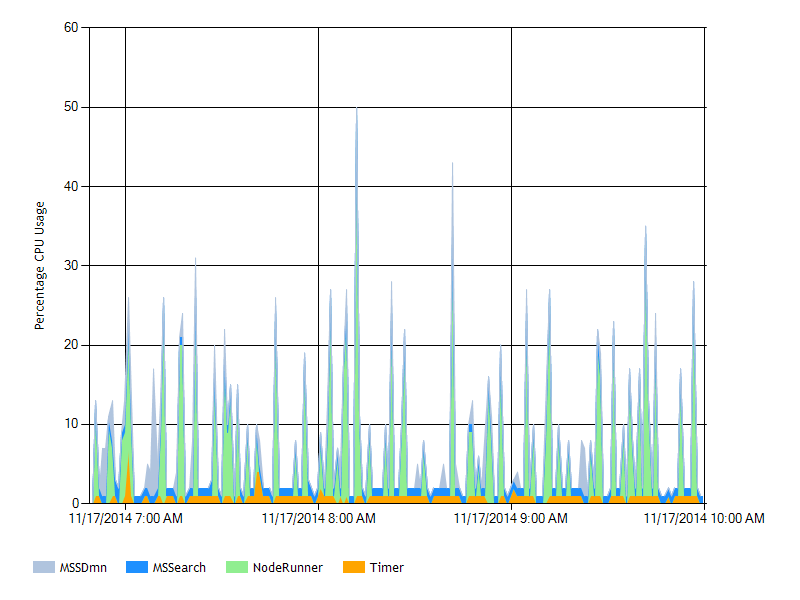
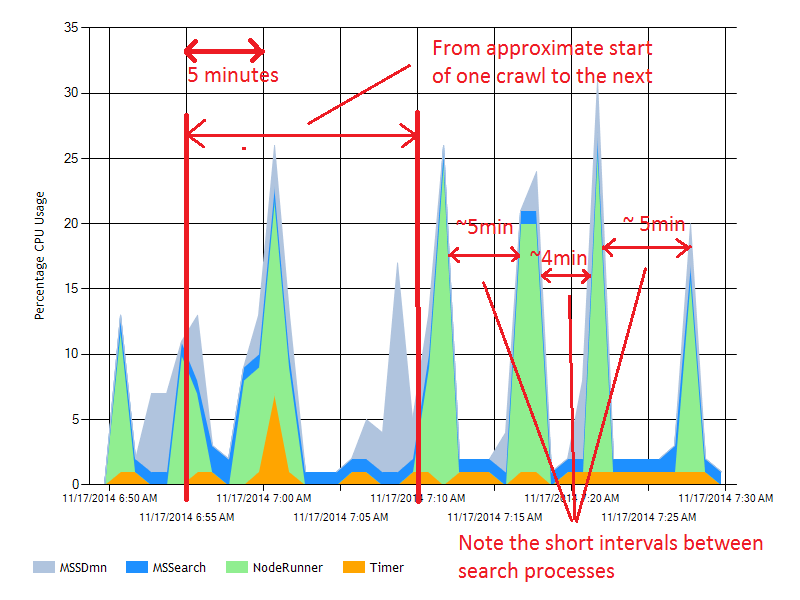
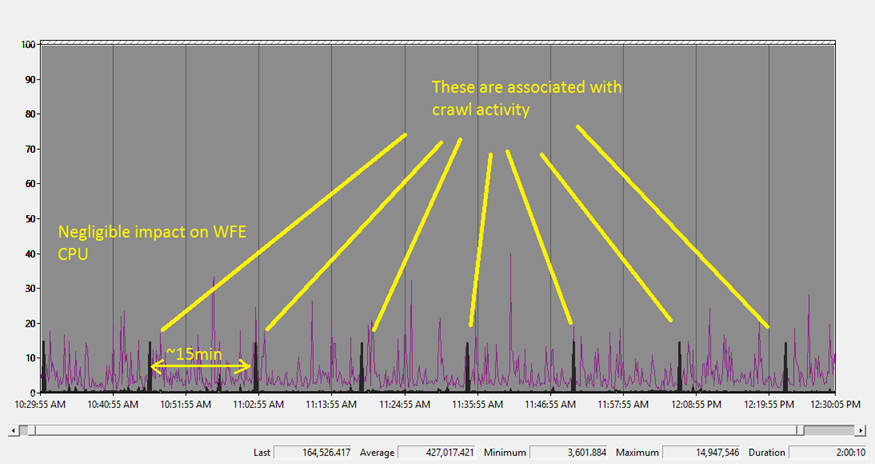
Review of the Crawl Freshness results found them inconsistent with a 15-minute crawl interval. While there was minor improvement in the freshness distribution, the aggregate freshness did not improve, and this finding seems consistent with what was revealed in the percentage CPU chart above. This was an unexpected outcome.
| Summary | Distribution by Freshness |
||||||||||
|---|---|---|---|---|---|---|---|---|---|---|---|
| Content Source |
Aggregate Freshness |
# Documents |
<10m |
<30m | <1h | <4h | <12h | <1D | <2D | <3D | >3D |
| Local SharePoint sites |
<30m |
88 |
78% |
100% |
100% | 100% | 100% | 100% | 100% | 100% | 100% |
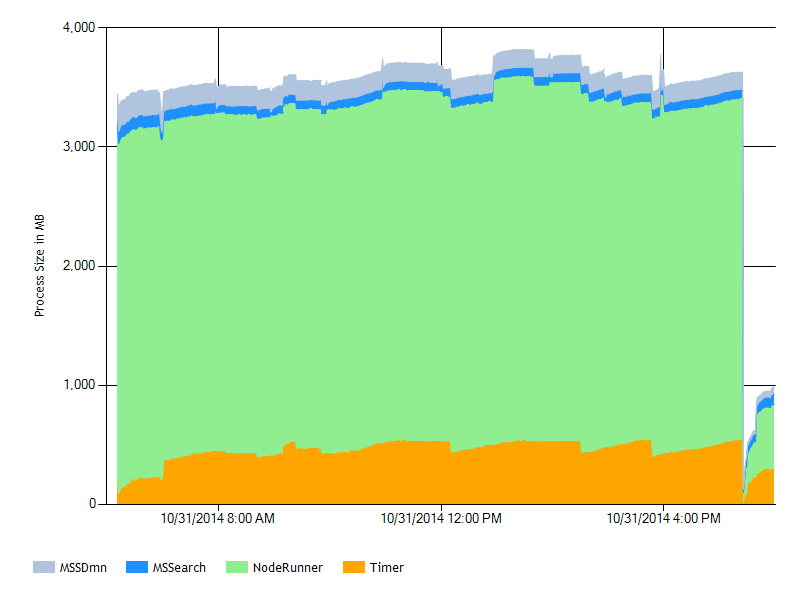
These results invited wider analysis, so, Windows Performance Monitor was used to capture CPU usage on the primary WFE and the results analyzed.
Analysis: no significant crawl-related adverse trends and impacts observed; crawl processes seem now close to overlapping; no improvement in crawl freshness.
10-minute Incremental Crawls
In this test, the crawl interval was reduced to 10 minutes, and then monitored over the course of a workday. Interestingly, rather than improving indexed content freshness, there seemed to be a slight degradation: while aggregate freshness remained the same, freshness distribution degraded somewhat.
| Summary | Distribution by Freshness |
||||||||||
|---|---|---|---|---|---|---|---|---|---|---|---|
| Content Source |
Aggregate Freshness |
# Documents |
<10m |
<30m | <1h | <4h | <12h | <1D | <2D | <3D | >3D |
| Local SharePoint sites |
<30m |
244 |
78% |
93% |
93% | 93% | 94% | 100% | 100% | 100% | 100% |
Analysis: no real improvement was found from reducing the incremental crawl interval to 10 minutes.
Continuous Crawl
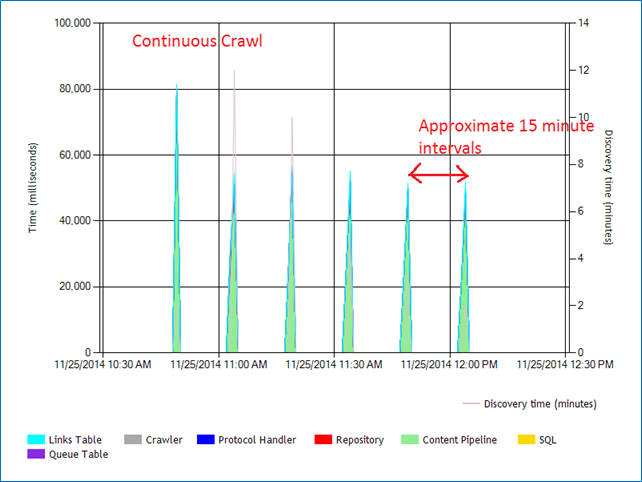
In this test, the crawl interval was set to "continuous", and then monitored over a workday.
No substantive improvement in aggregate freshness was found in comparison to the 10 minute crawl interval.
| Summary | Distribution by Freshness |
||||||||||
|---|---|---|---|---|---|---|---|---|---|---|---|
| Content Source |
Aggregate Freshness |
# Documents |
<10m |
<30m | <1h | <4h | <12h | <1D | <2D | <3D | >3D |
| Local SharePoint sites |
<30m |
44 |
86% |
100% |
100% | 100% | 100% | 100% | 100% | 100% | 100% |
What was found from this test was that the effective outcome of setting the incremental crawl interval to "continuous" was the same as setting the incremental crawl interval to 15 minutes.
Analysis
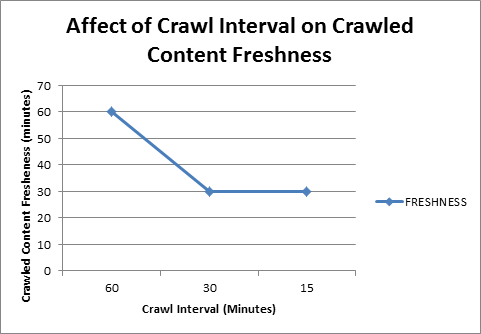
Plotting Aggregate Freshness over these various crawl interval types obtained the following chart
| Chart | Comment |
|---|---|
 |
tbd |
Summary
Decreasing the crawl interval to less than 30 minutes led to no discernible improvement in crawl freshness. Implementing continuous crawl also did not improve crawl freshness - an unexpected outcome. Given the results of testing, setting the crawl interval to 30 minutes accomplishes the best crawl freshness performance reasonably achievable for this particular SharePoint 2013 system.
References
- Overview of search in SharePoint Server 2013
- Crawling content with Sharepoint 2013 Search
- SharePoint 2013 Search Architecture Part 1 - Intro
- Best practices for crawling in SharePoint Server 2013
Notes
- tbd
