Power BI: Conditional Formatting
Introduction
In this article, we gonna explore all conditional formatting available in Power BI.
What's Conditional Formatting?
Conditional Formatting is a feature that helps you to apply a specific format on a cell value or a range of cell values based on specific conditions / rules.
In Power BI, there are 4 options for conditional formatting:
- Background color,
- Font color,
- Data bar,
- Icons (Introduced in July 2019 feature update).
1. Background color
Background color is a conditional formatting option that helps you to add a background color for a specific column based on
- Format type:
- Color Scale.
- Rules.
- Field value.
- Specific aggregated Field value.
- Specific Field value.
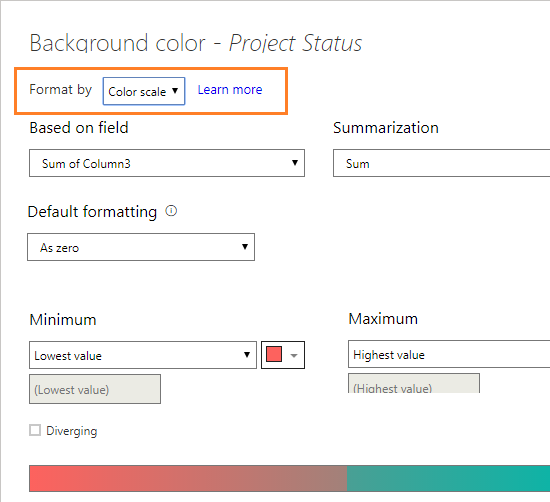
Color Scale
Color Scale is a format option that show the background color based on a scale.
As shown in below image, we need to add a background color for "Project Status" field formatted by "Color Scale".
So we should
- Specify based on which field we will format the "Project Status" field.
- Specify the summarization function based on the field type.
- Default formatting for blank values.
- No format.
- As zeros.
- Specific color.
- Minimum as the lowest value in cell range or starting from specific number.
- Maximum as the highest value in cell range or starting from specific number.
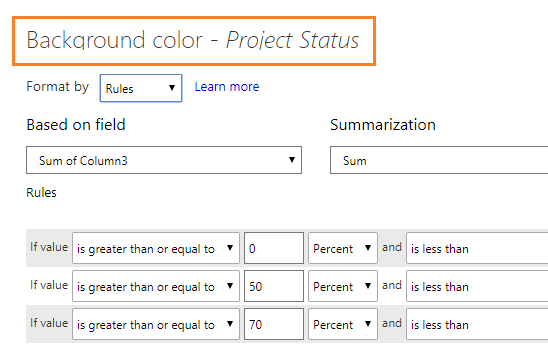
Rules
Rules is a format option that show the background color based on specific rules
As shown in below image, we need to add a background color for "Project Status" field formatted by "Rules".
So we should
- Specify based on which field we will format the "Project Status" field.
- Specify the Summarization function based on the field type.
- Specify the rules and conditions.
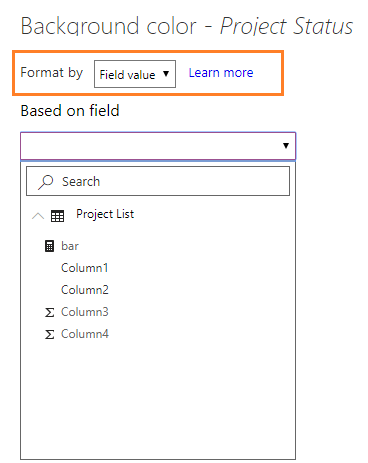
Field Value
Field value is a format option that specify the background color for the current column form another column that holds the color data.
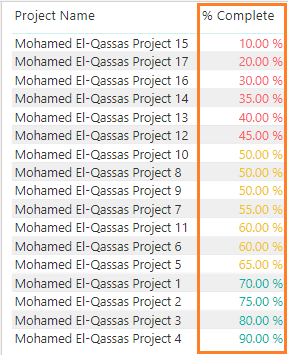
The output for "Background Color" conditional formatting:
2. Font color
The same idea and options of the background color, but the only difference is the color applied on the content fore color not the cell background.
The output for "Font Color" conditional formatting:
3. Data bar
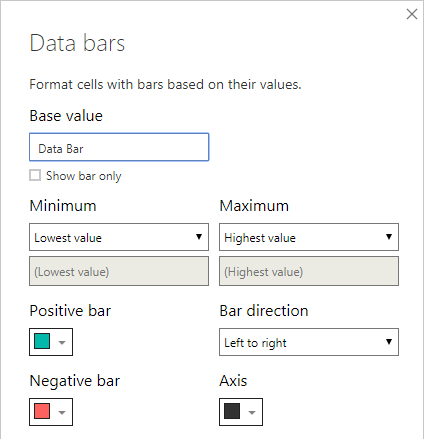
In the new Power BI desktop update, the Data bar is not shown by default, because it mainly applied on a measures.
Data Bar doesn't have the same format type as the background and font color, rather it have
- Minimum value.
- Maximum value.
- Option to show only bars without showing the value.
- The color for axis, positive and negative value.
- Bar direction:
- Right to Left.
- Left to Right.
The output for "Data Bar" conditional formatting:
4. Icons
In July 2019 feature update, The Power BI team announced a new Icon experience conditional formatting.
Icons helps you to show awesome icons in your cell instead of the colors as show below:
Format types
It has only two format type:
- Rules.
- Field Value.
Options
Plus the below options:
- Icon layout
- left data
- right data
- Icon only
- Icon alignment
- Top
- Middle
- Bottom
Note: Icons is not available right now for Power BI Report Server.
The output for "Icons" conditional formatting:
See Also
- Install and Configure Power BI Report Server On-Prem.
- Power BI: Show and Sort Slicer By Month or Quarter Name.
- Power BI: Explore The New Selection Pane Feature.
- Power BI: Two Way To Get Data From SharePoint List / Library.
- Power BI: Edit Existing SQL Query.
- Missing Save To Power BI Report Server In Power BI Desktop.


