Bing Maps API: Building Postcode lookup service
Introduction
One thing missing from the Bing Geodata API is a Postcode lookup service. There are obvious reasons Microsoft don’t offer such changing data sets, but that’s no reason we can’t bolt some on ourselves!
Get a Postcode/Latitude/Longitude data set
Go find yourself a dataset of postcodes for your country. You can use any decent search engine to find a CSV or Excel version of your country's postcodes. Use the search tool's advanced options to filter by file type. These are often gigantic sets of data, which will probably be out of date unless you pay for a commercial updated version.
The traditional route now, is to crunch that into a database of some sort, which you can then query against.
For this excercise, we use an old copy of the UK postcodes and loaded them into an SQL Server database.
Best solution: You can now also store your data in the Bing service itself, with Microsoft’s awesome Data Source Management API. This takes all the hassle of storage AND location querying off your to-do list!
Alternatively, if you like some work, you can split your data into geo-locational "buckets" as files in folders, and make a Javascript client-side "json search" feature of your own. The project we'll attach later, will also show an example of how to pull file-based data into your maps.
Add a Bing Map to your webpage
Now we start plotting all this onto a map. Adding a Bing map to your webpage is easy.
Include a script reference on your webpage to the service API, with a callback parameter that specifies which Javascript function to run, once it’s loaded.
<div class="map-wrapper">
 <div id='myMap'></div>
</div>

<script>
 var map;
 function loadMapScenario() {
  map = new Microsoft.Maps.Map(document.getElementById('myMap'),
   {
    allowHidingLabelsOfRoad: true,
   });
 }
</script>
<script type='text/javascript'
 src='https://www.bing.com/api/maps/mapcontrol?key=YOURKEY&callback=loadMapScenario'
 async defer></script>
Note how the callback function is added to the bing map control URL. This will be called when the page has finished loading. You then have control how to present the map and what actions to take in startup. This is where you attach the map to your place-holder and initialize any properties or actions you want to start with.
Plotting your postcodes onto the map
First, let’s load all the postcodes from a specified "search area" rectangle onto the map.
The code below loops over a set of data containing latitude, longitude and postcode attributes:
function getPostcodesInView() {
 var viewBounds = map.getBounds();
 getPostCodesInBoundary(viewBounds.bounds[0], viewBounds.bounds[1],  // Top left
    viewBounds.bounds[2], viewBounds.bounds[3]); // Bottom right
}

function getPostCodesInBoundary(latVal1, longVal1, latVal2, longVal2) {
 console.log("Loading...");
 $.ajax({
  url: '@Url.Action("GetPostcodesInBox", "Map")',
  type: 'post',
  data: {
   latVal1: latVal1,
   longVal1: longVal1,
   latVal2: latVal2,
   longVal2: longVal2
  },
  success: function (data) {
   placePostcodes(data,  null);
  }
 });
}
Map.getBounds is all it takes to get the boundary values of the view.
In postcode terms though, you'd have to be zoomed in quite close, to at least district view.
In the code below, we loop through the long/lat data set and convert the points into Microsoft.Maps.Location objects.
function placePostcodes(data, pinColor) {
 var dLen = data.length;
 if (dLen == 0) {
  return;
 }

 for (a = 0; a < dLen; a++) {
  var location = new Microsoft.Maps.Location(data[a].latitude, data[a].longitude);

  (function (_location, _postcode, _color, _ary) {
   var pinOptions = { 'draggable':  false, 'title': _postcode };
   if (_color) {
    pinOptions.color = _color;
   }

   var pin = new Microsoft.Maps.Pushpin(_location, pinOptions);
   _ary.push(pin);
   Microsoft.Maps.Events.addHandler(pin, 'click', function () { postcodePinClick(_postcode); });
  })(location, data[a].postcode, pinColor, map.entities);
 }
}
Each location is used for a new Microsoft.Maps.Pushpin. This is the item that is loaded into the map.
Note the function wrapper around each loop. This is because we are adding an event handler.
Note also that map.entities is just an array and we can manipulate it as such.
But an instance of this and the map.layers collection can only be created by the map.
Selecting an area with the Drawing tool
Another good way to choose an area to query is by drawing the boundary, using the drawing tool.
This is added to your map with a simple snippet in that initial Javascript function:
function loadMapScenario() {
 map = new Microsoft.Maps.Map(document.getElementById('myMap'),
  {
   // your map options
  });

 Microsoft.Maps.loadModule('Microsoft.Maps.DrawingTools', function () {
  var  tools = new Microsoft.Maps.DrawingTools(map);
  tools.showDrawingManager(function (manager) {
   drawingManager = manager;
   Microsoft.Maps.Events.addHandler(drawingManager,  'drawingStarted', function () { makeFixedAspect(); });
   Microsoft.Maps.Events.addHandler(drawingManager,  'drawingChanging', function () { makeFixedAspect(); });
   Microsoft.Maps.Events.addHandler(drawingManager,  'drawingChanged', function () { makeFixedAspect(); });
  })
 });

 map.setView({
  mapTypeId: Microsoft.Maps.MapTypeId.aerial,
  center: new Microsoft.Maps.Location(50.10813239246177, -5.20205552284329),
  zoom: 10
 });
}
Note the example above also shows an initial pan and zoom, plus changes the map type to the aerial view.
Then we can pull the boundary from a shape that we can draw on the map canvas.
The code snippet below uses a custom user-defined shape as bounds and calls the same function above, to place the pins:
function getPostcodesInBox() {
 var shapes = drawingManager.getPrimitives();

 if (shapes.len == 0) {
  console.log("No shape drawn to measure");
  return;
 }

 var latVal1 = shapes[0].geometry.bounds[0];
 var longVal1 = shapes[0].geometry.bounds[1];
 var latVal2 = shapes[0].geometry.bounds[2];
 var longVal2 = shapes[0].geometry.bounds[3];

 getPostCodesInBoundary(latVal1, longVal1, latVal2, longVal2);
}
Below is how that looks so far:
Zooming in is still quite responsive, once you let the page load.
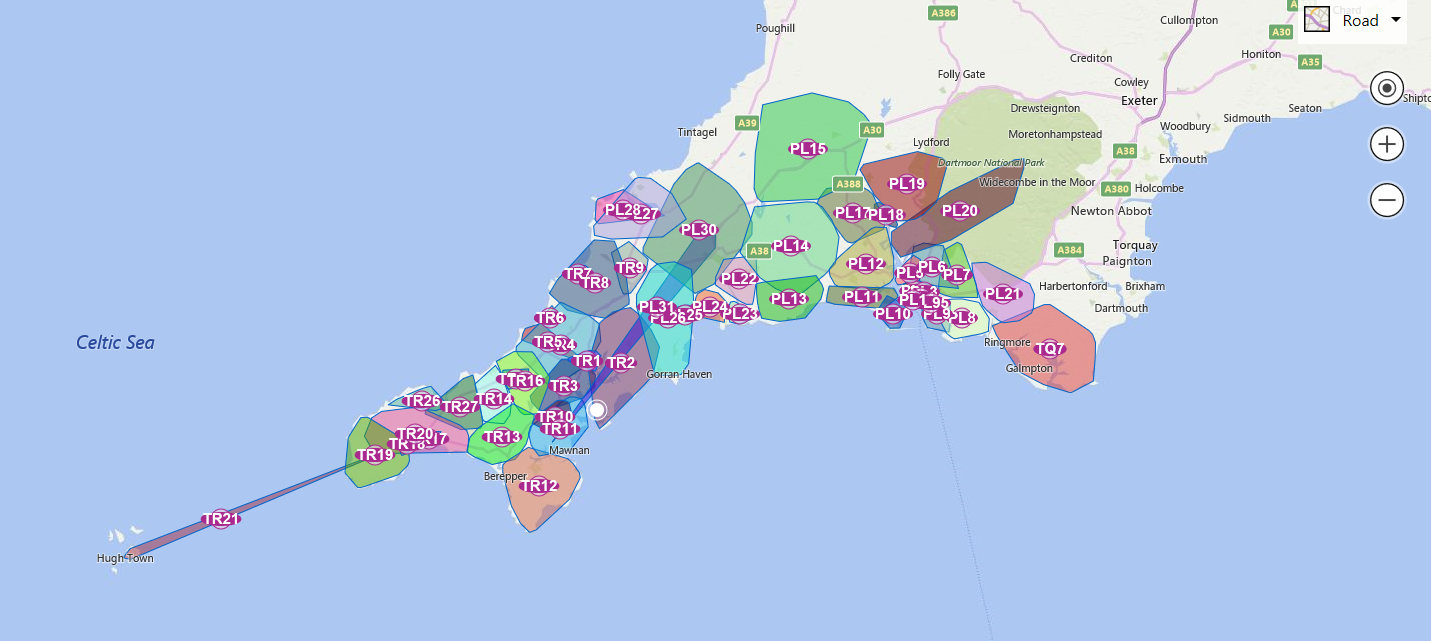
Grouping postcodes into area code polygons (Convex Hull)
This is looking a bit busy, so let’s group postcodes by the first part of the code.
The best way to generate this [painlessly] is by adding all the postcodes from each group into an array. Then generating arrays of points into convex shapes, which represent the general area that encompasses all of the grouped postcodes.
The code below shows how to generate a Microsoft.Maps.SpatialMath.Geometry.convexHull boundary shape, which defines a rough outline shape that encompasses all the points in the array.
In this example, the longitudes and latitudes are joined in one long CSV string.
So, we simply split them back out to an array and parse them back into Location objects.
(function (_grp, _map) {
 var locs = [];
 var ix = 0;
 var _ptsAry = _grp.LatLongsAsCsv.split(',');
 var ptsLen = _ptsAry.length;
 while (ix < ptsLen) {
  locs.push(new Microsoft.Maps.Location(parseFloat(_ptsAry[ix++]), parseFloat(_ptsAry[ix++])));
 }
 Microsoft.Maps.loadModule('Microsoft.Maps.SpatialMath', function () {
  var col = random_color('rgba');
  var shape = Microsoft.Maps.SpatialMath.Geometry.convexHull(locs,
   {
    fillColor: col
   });

  _map.push(shape);

  var cLoc = new  Microsoft.Maps.Location(_grp.CenterLatitude, _grp.CenterLongitude);
  var pin = new Microsoft.Maps.Pushpin(cLoc,
   {
    text: _grp.Postcode
   })
  var b = Microsoft.Maps.SpatialMath.Geometry.bounds(shape)
  Microsoft.Maps.Events.addHandler(pin, 'click', function () { _map.remove(pin); postcodeGroupPinClick(_grp.Postcode, b, _grp.CenterLatitude, _grp.CenterLongitude, shape, col); });
  _map.push(pin);
 });
})(shp, map.entities);
In this example, We are placing a PushPin in the center of the polygon, which will load all the postcodes from that postcode area. Note we pass in the center point for the pin, which can otherwise be obtained using the Microsoft.Maps.SpatialMath.Geometry.centroid module.
You can pass either an array of points or an array of shape 'primitives', like pins or polygons. I'll discuss this later.
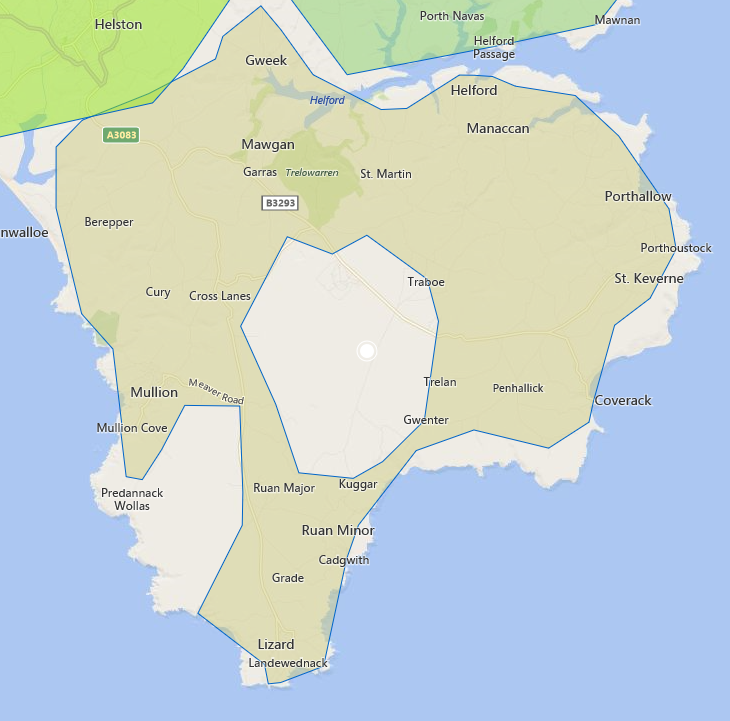
Making a more detailed boundary outline (Concave Hull)
On this detailed area view, we can afford a couple of extra seconds to generate a concave boundary for the group. I’d recommend pre-processing these, if you have 500 or more points. I’ve done that in this example for the convex postcode groups. If it’s the first time we query the code/area from the database, we save it back after calculating the shape. This [slower to calculate] concave shape much better represents the true area for the postcodes.
Below is an example of loading a group of locations (postcodes) represented with inline SVG. This looks better than the standard pins, in some cases.
var shape = Microsoft.Maps.SpatialMath.Geometry.concaveHull(locationArray);
shape.setOptions({
 fillColor: 'rgba(255, 0, 0, 1)'
});
concaveLayer.add(shape);
Note in this example, we am setting the fillColor option explicitly. Also, we am adding the shape to it's own Microsoft.Maps.Layer. This is so that the postcodes loaded into the shape can be on a higher level and still "clickable". Layers are added to your map as shown below:
concaveLayer = new Microsoft.Maps.Layer();
concaveLayer.setZIndex(9007);
map.layers.insert(concaveLayer);

groupLayer = new Microsoft.Maps.Layer();
groupLayer.setZIndex(9008);
map.layers.insert(groupLayer);
Note the difference in ZIndex values, which defines which sits on top [and obstructs] the other.
Adjust boundaries for inflation or accuracy
Notice the hole that has formed in the middle of the shape. A close-up inspection shows it also misses some roads, as there is no accounting for the radius the postcode covers.
We need to inflate the boundaries to account for the radius of the points. Or in some cases, this would be to account for accuracy.
There are two main methods here:
- Enlarging the points
- Inflating the final shape
To inflate or shrink a shape, you can use the Microsoft.Maps.SpatialMath.Geometry.buffer method. However, in tests, using the Microsoft.Maps.SpatialMath.Geometry.concaveHull function after using the buffer function had very bad performance. If you can imagine the boundaries of all the rounded edges that this is trying to calculate, using rounded shapes is much harder to calculate the paths and geometry needed.
Microsoft also notes this and suggest we use simple inflated polygons, instead of pins or locations.
Rounded objects like pins get inflated into bigger rounded objects, with many points in their rounded paths. Using straight sided regular polygons helps concave shapes calculate their shape much faster - just a few seconds per 1000 postcode group. The map eventually slows down though, depending on how many more visible objects you push onto the canvas.
If we take the polygon down to just three sides, the sharp-cornered triangles make the concave shape much sharper and more representative:
var triPath = Microsoft.Maps.SpatialMath.getRegularPolygon(location, 800, 3, Microsoft.Maps.SpatialMath.Meters);
tempArray.push(triPath);
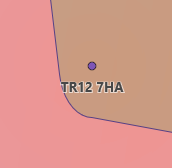
We've got a little overlap now, with inflated boundaries.
This kind of thing doesn't really work with postcodes, as they aren't separated by distance.
Notice a couple below look distinctly in the other postcode area, until you study the route a delivery van would take.
Adjusting the inflation size of your polygon points or adjusting your buffer method on a simple shape easily tweaks this to a happy place:
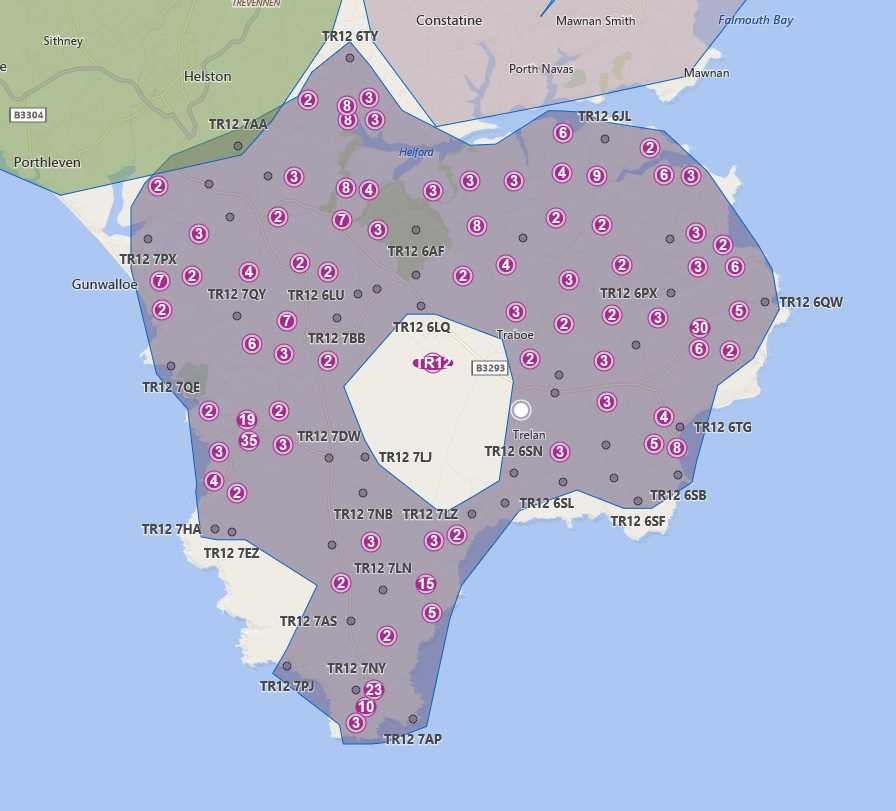
Grouping crowded Pushpins into Cluster Pins
Now we have a better handle on the areas, we can drill down into an area and load just the postcodes for that area. The area can still look a bit crowded with all those points. Let’s cluster them together, into groups. This gives a clearer view. You can also add event handlers to these cluster group pins, to drill down, explode or pop up a list of the group.
Microsoft.Maps.loadModule("Microsoft.Maps.Clustering", function () {
 var clusterLayer = new Microsoft.Maps.ClusterLayer(locationArray);
 map.layers.insert(clusterLayer);
});
And here is the result:
Read more on the Clustering Module and the options for designing the cluster pin and handling events here.
Postcode density as a Heat Map Layer
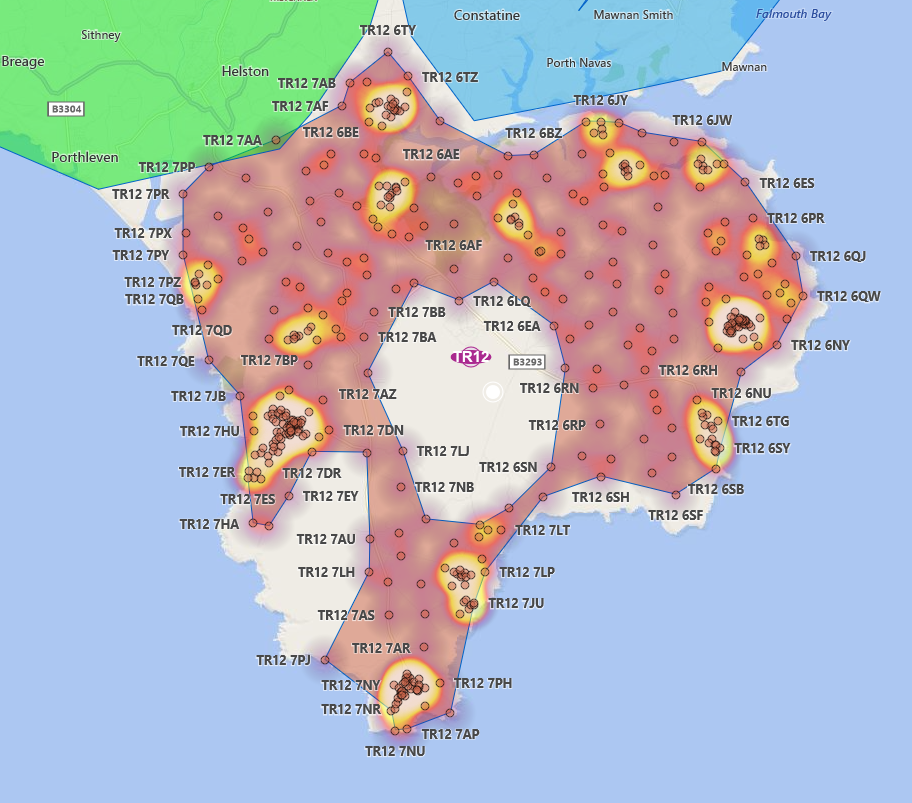
Now let’s play with the heatmap Module, as I’d be interested to see how these represent population density and transport routes.
The next snippet shows how to load those postcode locations into a heat map layer and push onto the map canvas:
Microsoft.Maps.loadModule('Microsoft.Maps.HeatMap', function () {
 var heatmap = new  Microsoft.Maps.HeatMapLayer(locationArray, {
  intensity: 0.5,
  opacity:0.6,
  radius: 1000,
  unit: 'meters'
 });
 map.layers.insert(heatmap);
 heatMaps.push(heatmap);
});
This is how it looks now:
Now that’s looking really nice!
Come to think of it, a heat map of postcodes must surely represent a map of populated areas.
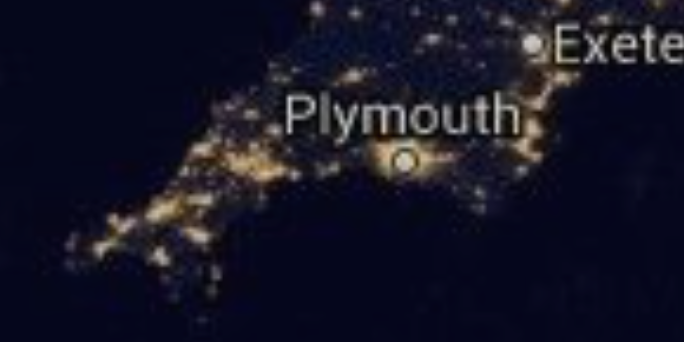
Another example would be the satellite images at night, showing all the lights.
Let’s have a look!
Postcode Density - Night Satellite Image Emulation
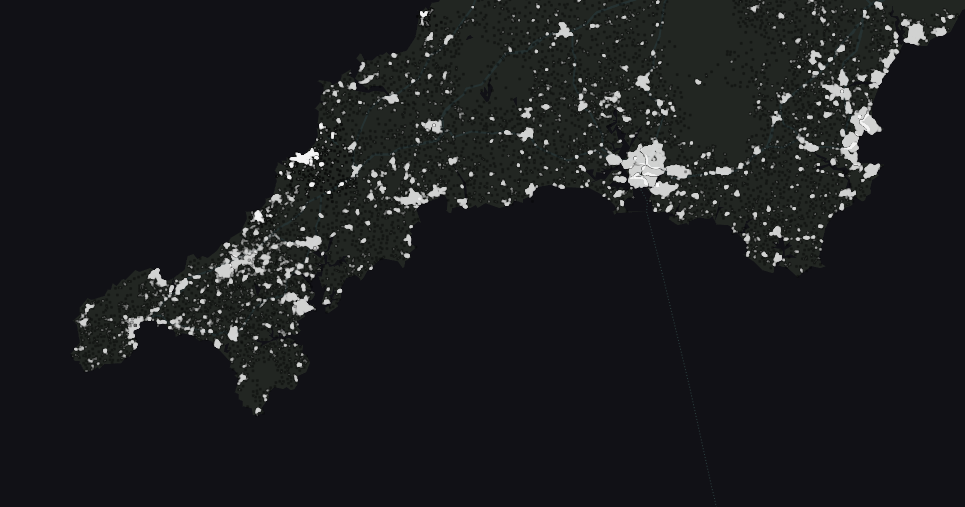
The code below shows how to change the map type to “Microsoft.Maps.MapTypeId.canvasDark” and iterate over all the heatmaps, changing the colour gradients to a simulate population lighting:
function SatNight() {
 map.setMapType(Microsoft.Maps.MapTypeId.canvasDark);
 map.setOptions({
  backgroundColor:  'black',
  customMapStyle: satelliteNightStyle
 });

 for (var a = 0; a < heatMaps.length; a++) {
  heatMaps[a].setOptions({
   colorGradient: {
    '0': 'transparent',
    '0.5': 'transparent',
    '1': 'White'
   },
   opacity: 0.8,
  });
 }
}
To get a copy of the actual satellite image, I've also restyled the map itself, with the following snippet:
var nightLand = "#222622";
var nightWater = "#111116";
var nightTransport = "#263232";
var nightOther = "#222622";

var satelliteNightStyle = {
 "elements": {
  "water": { "fillColor": nightWater },
  "waterPoint": { "iconColor": nightLand },
  "transportation": { "strokeColor": nightTransport },
  "road": { "fillColor": nightTransport },
  "railway": { "strokeColor": nightTransport },
  "structure": { "fillColor": nightLand },
  "runway": { "fillColor": nightTransport },
  "area": { "fillColor": nightLand },
  "political": { "borderStrokeColor": nightOther,  "borderOutlineColor": nightOther },
  "point": { "iconColor": "#ffffff", nightOther: "#FF6FA0", "strokeColor": nightOther },
  "transit": { "fillColor": nightTransport }
 },
 "settings": { "landColor": nightLand },
 "version": "1.0"
};
Putting it all together, this is what we finally get, showing postcode density on a Bing Map:
Bing heat map of postcode density
Below is a real satellite photo of the same area.
Slightly different angle/perspective, but clearly a very good match!
Actual satellite nighttime image of the same area
See Also
- Bing Maps - Official Site
- Bing Maps API Documentation
- Bing Maps V8 Web Control
- Developer code samples
- Extra Map API Modules


