SSRS : Create custom reporting map
Problem
SQL Server reporting services displays and visualizes data in different ways, and one of the most important feature in SSRS is Maps. SSRS allow you to create maps or maps layers to let you visualize data against a geographic background, but in visual studio we have just the united states map, so how can we get the maps of other countries?
Solution
Here is a solution to create your own customized map.
1. Get the shapefile
To start, you need to download the shapefile (world) which contains all the information related to the geometry of the countries (Points, lines, polygons).
2. Conversion of shapefile to SQL Spatial Data
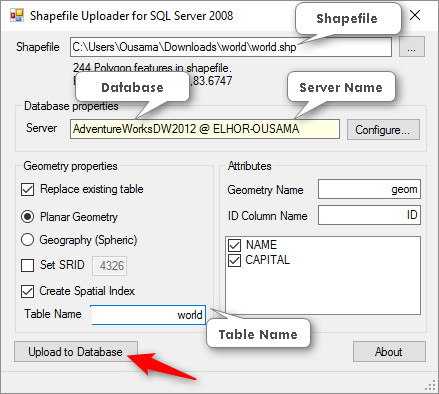
In the next step we will use a tool called Shape2SQL (sqlspatialtools_build) to extract the spatial data from the shapefile in a SQL Server table.
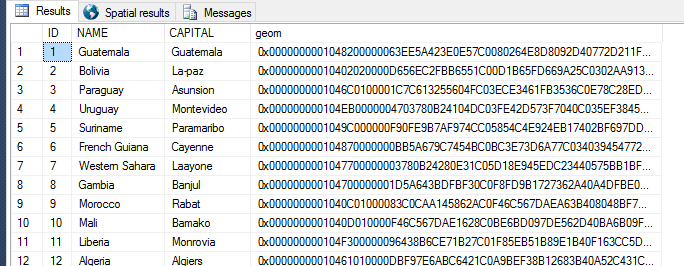
Now we have all the countries in a table called World, as shown below, with a geom column having the geometry SQL Data type, knowing that you can delete countries that you do not need.
3. Creating the map
Now that we have our spatial data in a table, we are ready to create the map. In business intelligence development studio, We added the map to our report that launched the map wizard, and then we used the following steps on the page :
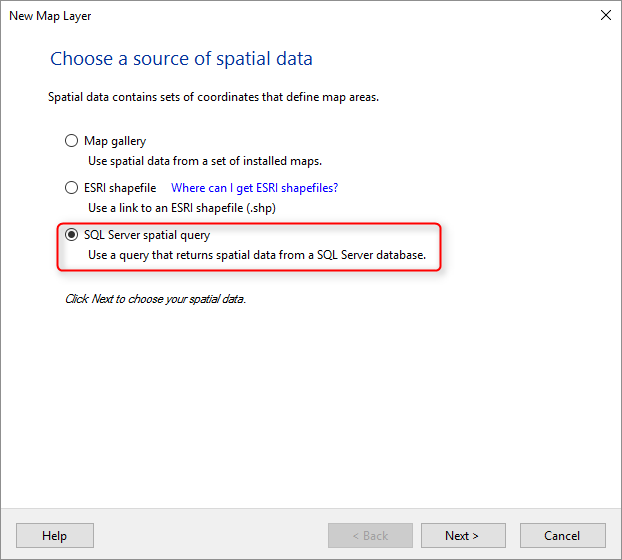
- Choosing a source for spatial data.
- Select SQL Server spatial query.
- Click Next.
On the page :
- Choosing a Data Set with SQL Server Spatial Data.
- Select add a new Dataset with SQL Server spatial data.
On the page :
- Choosing a connection to SQL Server spatial data source.
- Select New.
In the Data source properties dialog box, on the general page :
- Add a connection string like this :
(Changing the name of your server and your database)
Data Source = (local); Initial Catalog = SpatialData
OK, and then click Next.
On the design page query, add a query for the "dbo.World" table, like this :
SELECT[NAME] ,[geom] FROM[dbo].[world]
Then click Next.
The map wizard reads the spatial data and makes it for you on the choose Spatial Data and Map view options page, ad shown below.
On the next screen, remember to check the Embed map data in this report.
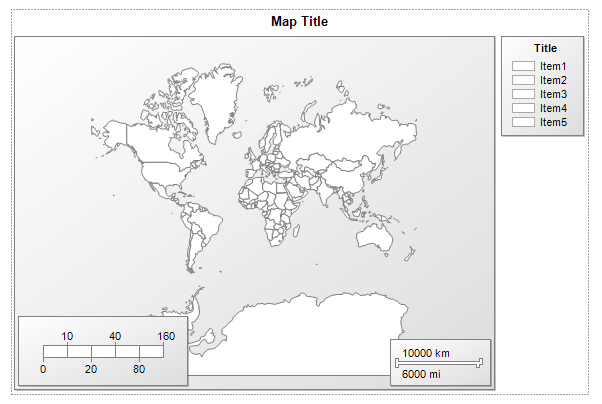
After that, continue to click Next until you reach the finish button. Click finish and you should get the result as shown below :
Now save the report and then copy the rdl report from its source location to C:\Program Files (x86)\Microsoft Visual Studio 11.0\Common7\IDE\PrivateAssemblies\MapGallery, you should be able to see the map that you just created in the map gallery when you create a new map in another report on the same system.
Conclusion
In this article, we talked about map report, how to create a map report based on spatial information.
Now that the .rdl file was created, it can be shared and used on other projects.
See also
Other Languages
This article is also available in the following languages:


