Power View Report in SharePoint
Introduction
For every business function automation or where you have large data stored - BI reports play a vital role in analyzing the existing data, improving from the past experience and predicting the future of business, etc. In this article, we will learn how to create Power View reports from SharePoint list and integrate with SharePoint in detail.
Environment
SharePoint Online - Office 365 (should work in SharePoint 2016 & 2013 versions as well).
Excel 2016 - Microsoft Office 365 Pro Plus (should work for Excel 2013 versions as well).
Why Power View?
If you have already migrated or are migrating to SharePoint Online and want to create reports/dashboards in SharePoint then following are the options available:
1. Using Excel Services/Excel Web Part
2. Power BI
3. Using third-party solutions
4. Custom solutions using JQuery chart plugins
If you look at the above options, using Excel Services and Power BI are the easiest ways one can create reports in SharePoint. 3rd and 4th options need in-depth knowledge in customization to build reports, but for using Power BI you need to buy a separate license. Obviously, we will go to the Excel Services/Excel Web Part option which comes with MS Office.
For more information about what is not supported in SharePoint Online in Office 365, refer this article
Creating Power View reports in SharePoint
1. For this demo, we have created a SharePoint List named "Finance Sample Data" using the data from Finance Sample records downloaded from Power BI site. Click download. It has around 700 records which are very less when we compare the data load which is 1 Million records.
2. Let's go ahead connect the data from SharePoint to Excel and create excel dashboards. If you are using Excel 2016 and don't see the Power View option in the ribbon, read this article to enable it.
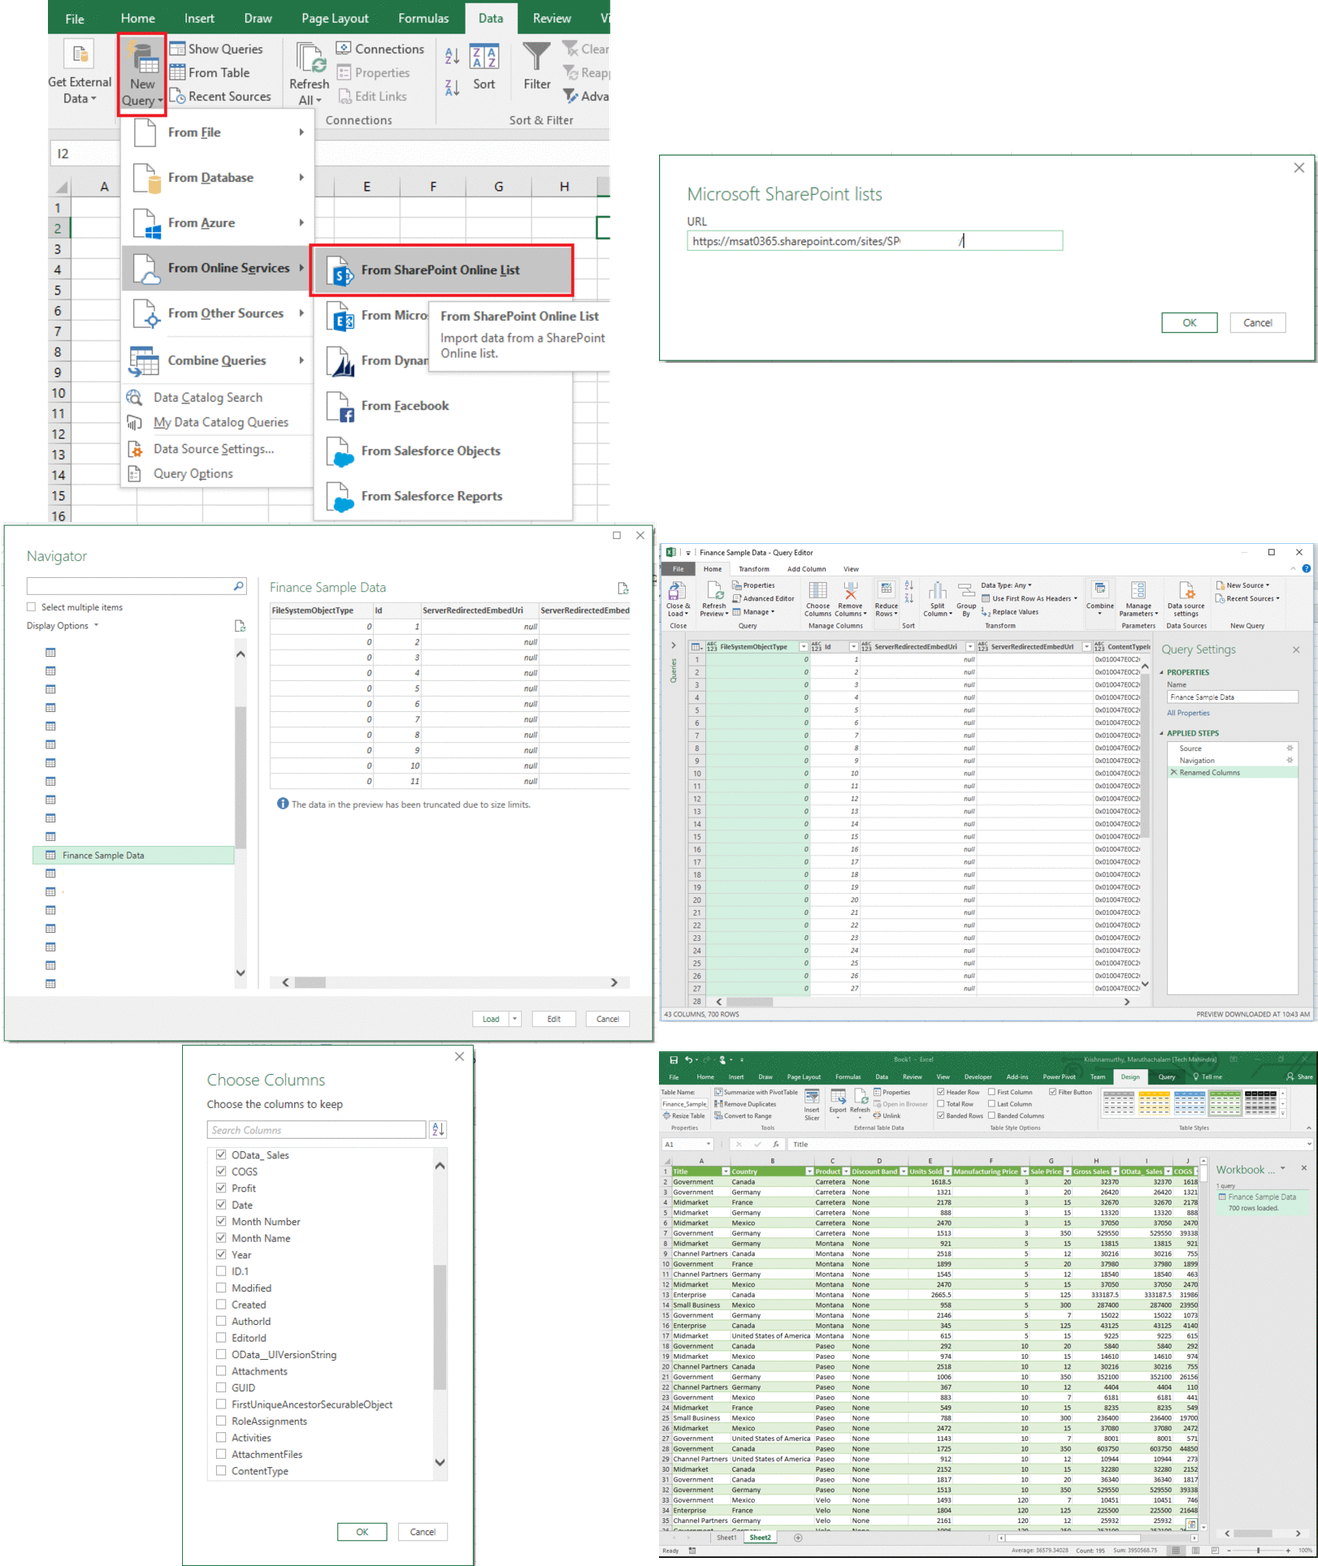
3. Open Excel -> new workbook -> Data -> New Query -> From Online Services -> From SharePoint Online List -> Enter the SharePoint Site URL -> Select the list "Finance Sample Data" from the list -> Click Edit button at the bottom right corner to edit or you can load all columns as per your requirement -> You can choose columns or remove unwanted columns -> Load the data to Excel
4. Once the data is loaded it will open the blank Power View report. Now, it is time to add the report. Remember Power View is a Silverlight-based application and Power BI is HTML based application. Power View cannot be customized within the report. But Power BI is customizable. You can click any columns at the right side menu and add filter
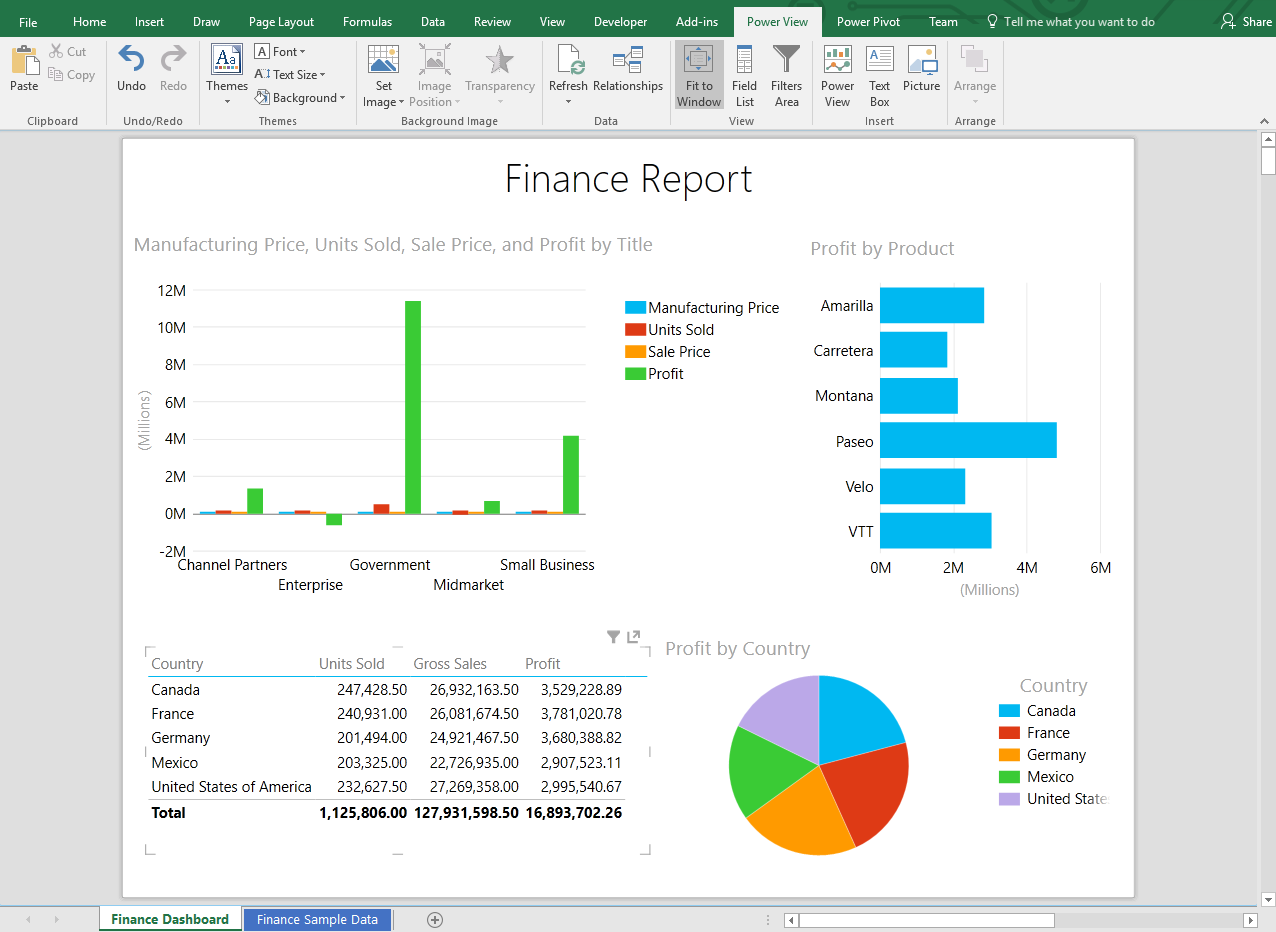
5. In the same way, add data by dragging the fields. I have added the 4 report sections as shown below. The final report created in Power View in Excel is:
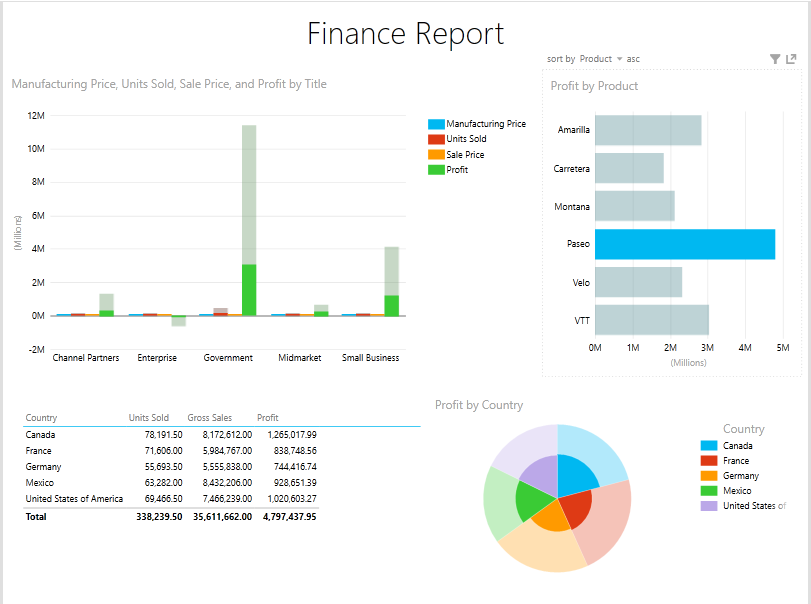
6. Also, when you click the chart area, it will filter according to the data relationship and filter the data automatically
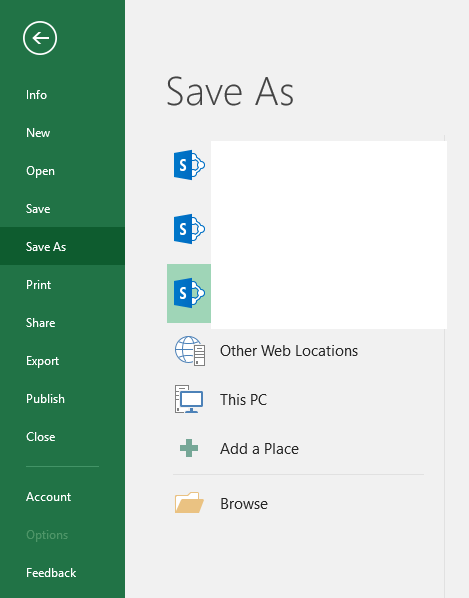
7. Now, it's time to publish the report to SharePoint so that we can display the report on a separate page. Very important, if you don't follow the below step you will get an error when linking the report in Excel access web part. Instead of uploading the report to Document Library -> click on Save As -> Connect to the SharePoint Online site (if not connected already) -> then click on the site to view the libraries -> publish to the desired library
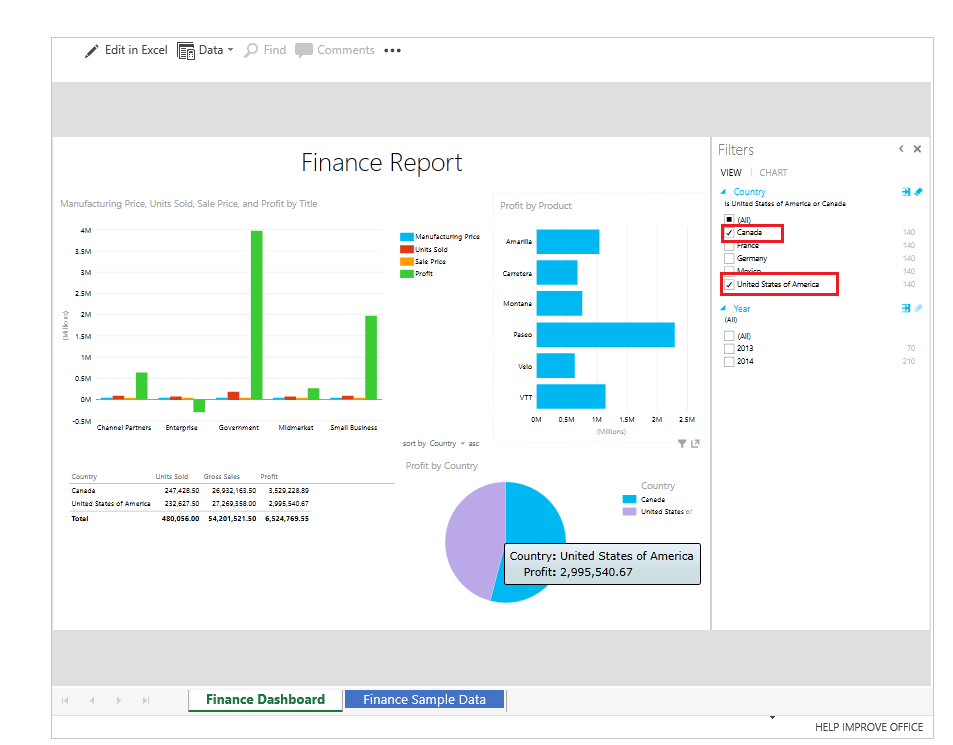
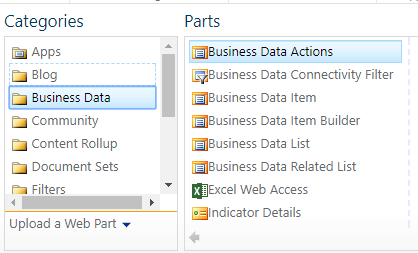
8. Add a new SharePoint page -> Insert Excel Web Access web part -> Add the link to the Excel sheet published in SharePoint library -> Save it to view the Power View report in SharePoint.
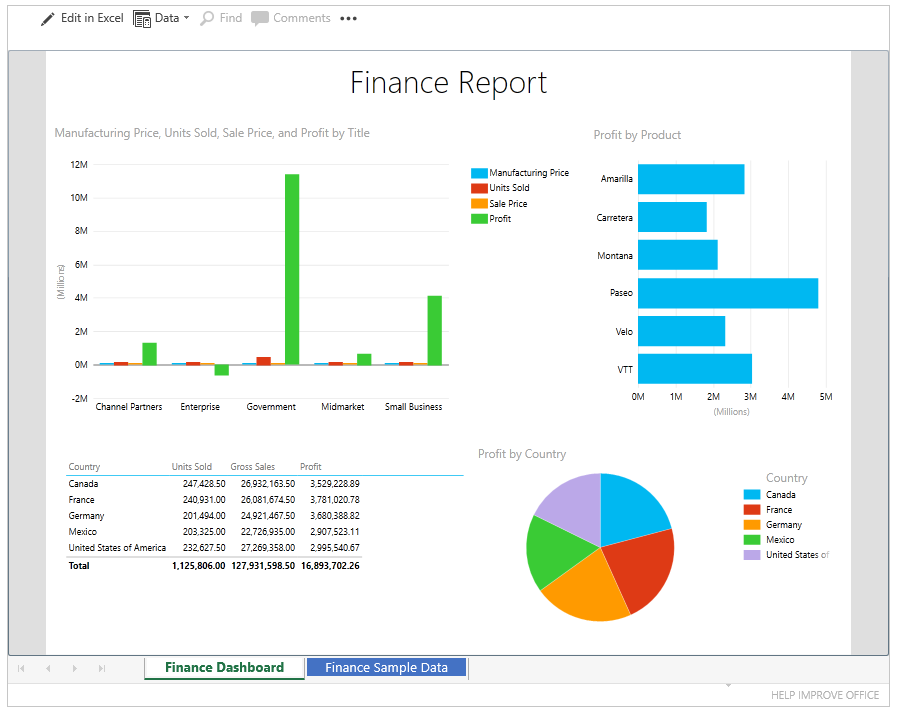
9. Final report published in the SharePoint looks like below:
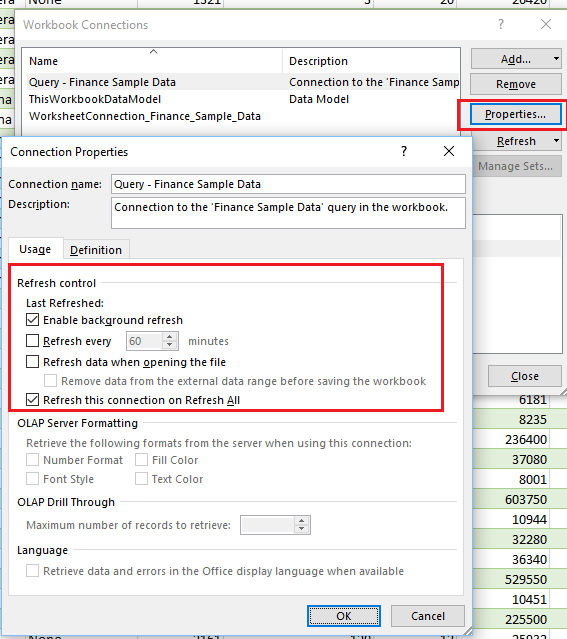
10. Next what? We forgot about the Data Refresh option. In the Excel sheet -> click the Data tab -> Connections -> Properties -> Usage as shown below:
See Also
Creating reports using OData Feed in Power BI
Create Power BI report and publish in SharePoint
