Create Power BI Reports using Facebook Data
Introduction
Power BI is a cloud based service that provides data visualization options based on the source data. Using Power BI we can create dashboards based on the data. In order to create reports using Power BI make sure that you have a Power BI account. If you don’t have an account you can sign up for it here. You can either work with Power BI online or download the Power BI Desktop version from here.
Getting Started

In this article, we will go ahead with the desktop version. Once downloaded and installed, spin up Power BI Desktop.
This will open up the desktop version of Power BI.

Power BI is flexible enough to work with multiple data sources. In this article, we will see how to create reports using SharePoint Online list as the data source. Click on ‘Get Data’ option to select the data source.

Connect to Facebook from Power BI
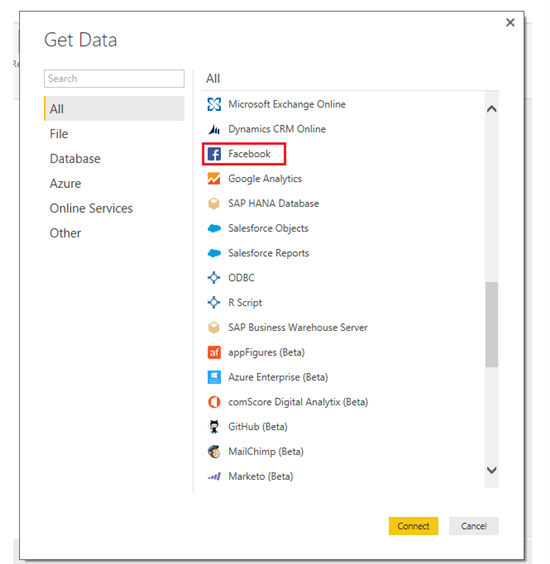
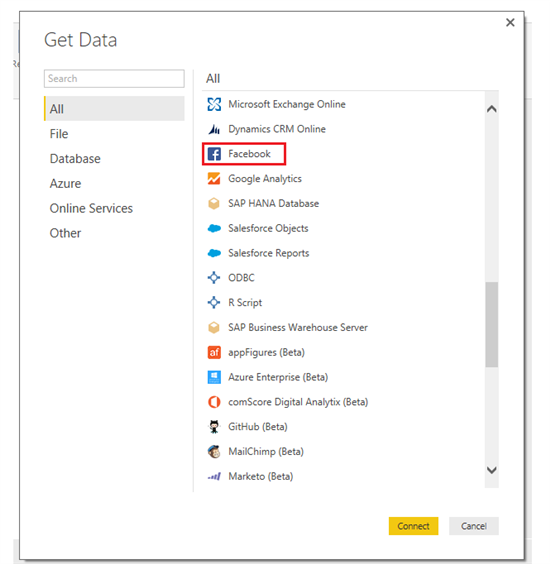
All the supported data sources from which we can create reports will be listed down as separate tabs. In this blog, we will see how to report against Facebook. From All tab, select Facebook and click Connect.
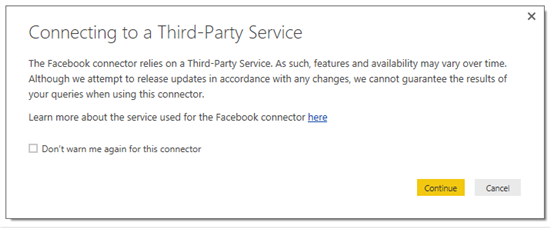
This will connect to Facebook using the Facebook connector. Click Continue.
We can either connect to a Facebook user account or to a Facebook page.
Connect to a Facebook User Account
First, let’s derive data from the personal account. In order to do that specify me in the first text box and select Posts to get details about the Facebook wall posts.
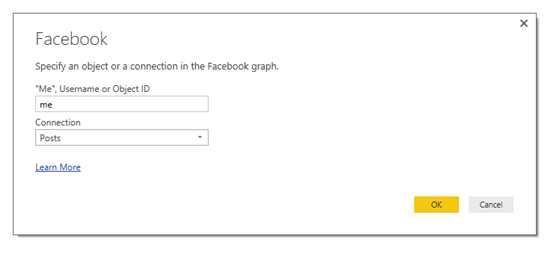
Upon clicking OK, it will generate a temporary table that shows the data about the recent wall posts.

Click Load to import the data to Power BI.

Generate Specific Facebook User based Power BI Report
Thus we have the data inside Power Bi desktop. Now we can use the different visualization options to derive meaningful data out of it.

Let’s select Pie Chart to visualize the Facebook data.

Drag and drop the type column to the values section of the pie chart.

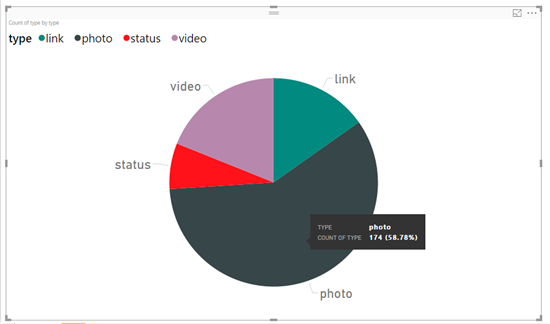
Type column contains Facebook data categorized as photo, video, links etc. After drag and drop, the pie chart will show pie section for each of the type of the data (photo, video etc.).
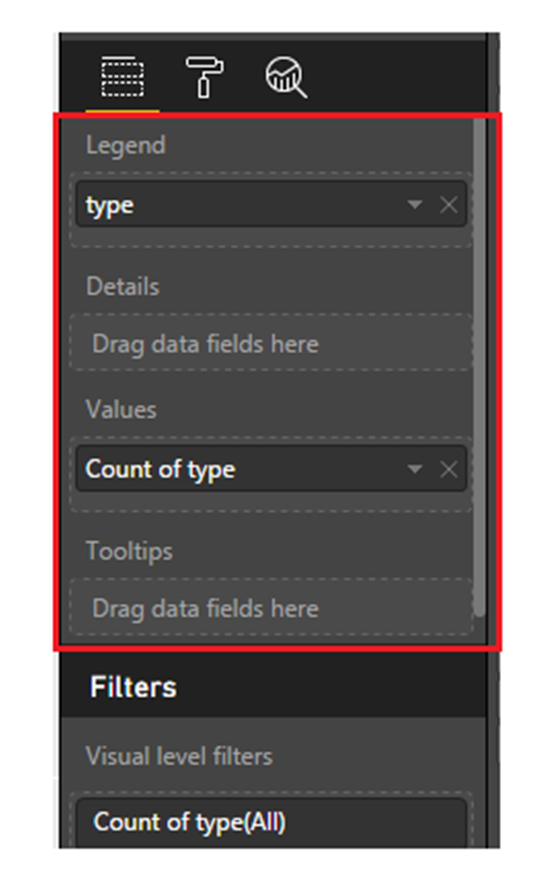
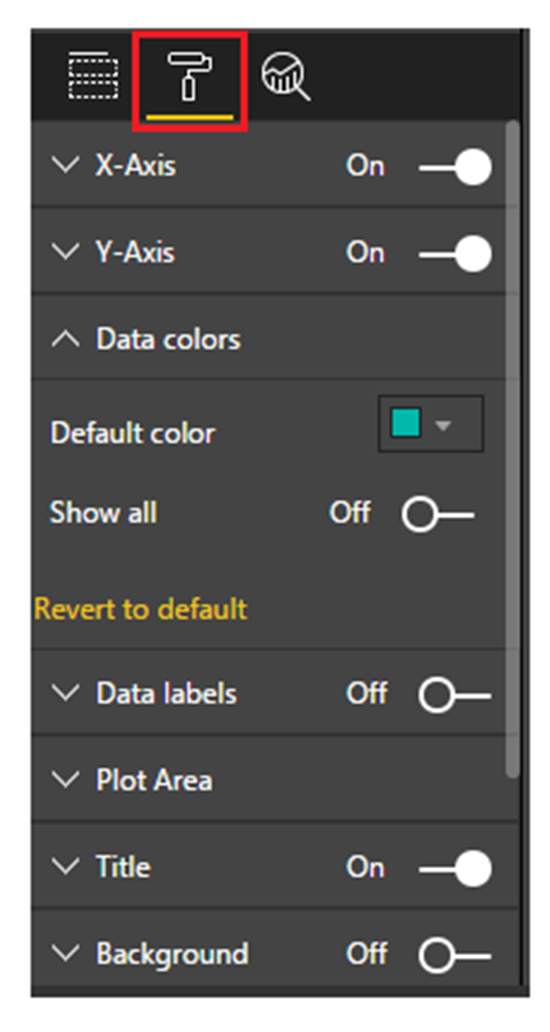
We can do cosmetic changes in the highlighted section of the visualization tab.
Finally, the pie chart will render the Facebook data categorized by the type of the data as shown below:
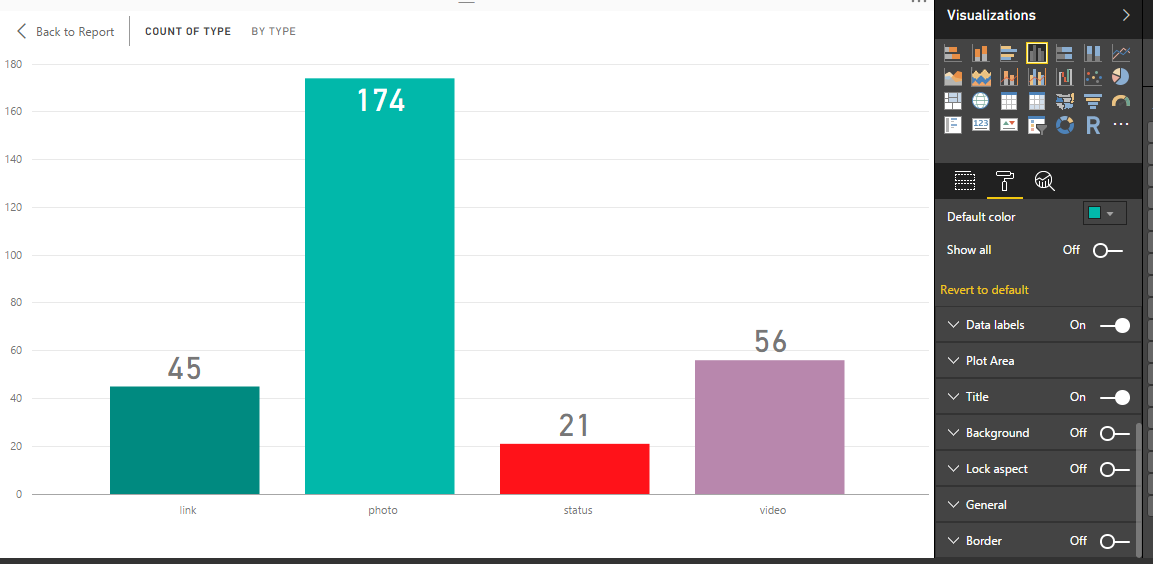
We can also convert it to a bar chart:
Connect to a Facebook Public Page
In the earlier section we connected Power BI to a user account, now let derive the data from a public page, the official Microsoft Power BI page (https://www.facebook.com/*microsoftbi*) which has the object id- microsoftbi . From Get Data, select Facebook.

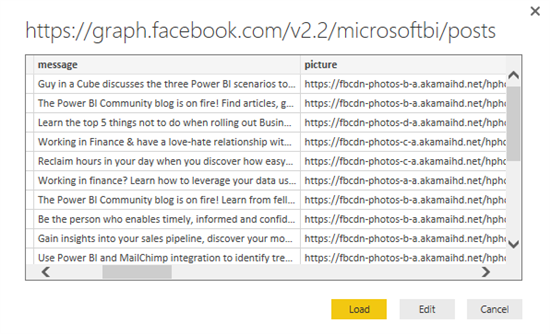
In the object ID section specify microsoftbi and in the connection drop down select posts.

This will populate a temporary table with the posts from the Microsoftbi page, click Load to import it to Power BI desktop.
Generate Facebook Public Page Power BI Report
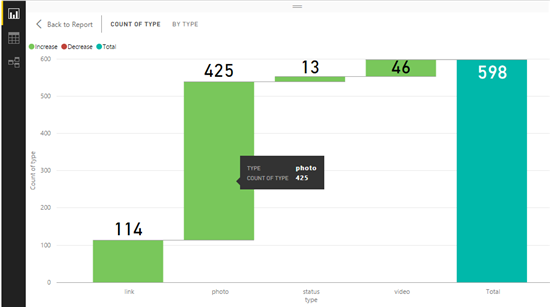
The data is now imported to Power BI.Just like we did earlier we can visualize the data using either one of the graph options. Drag and drop type column to the Category section based on which the chart will be categorized and displayed.

The chart representation will look like below.
Summary
Thus we saw how to integrate Power BI and Facebook and generate Power BI reports based on the Facebook data.
See Also
This article can be viewed from the below link as well:

