Regression Algorithms parameters in Azure ML
Introduction
Regression algorithms concerned with modelling the relationship between variables that is iteratively refined using a measure of error in the predictions made by the evaluate model. Regression methods are a workhorse of statistics and have been cooped into statistical machine learning. This may be confusing because we can use regression to refer to the class of problem and the class of algorithm. Really, regression is a process.
The most popular regression algorithms are:
- Ordinary Least Squares Regression (OLSR)
- Linear Regression
- Logistic Regression
- Stepwise Regression
- Multivariate Adaptive Regression Splines (MARS)
- Locally Estimated Scatterplot Smoothing (LOESS)
Following algorithms are available in Azure ML studio:
- Bayesian Linear regression
- Boosted Decision Tree Regression
- Decision Forest Regression
- Fast Forest Quantile Regression
- Linear regression
- Neural Network Regression
- Ordinal Regression
- Poisson Regression
In Azure machine learning studio when we create a regression ML experiment and when we click on visualize option in evaluate model. When you pass on a scored model for a regression algorithm, the evaluation model generates metrics of following:
Mean Absolute Error
A high number is bad and a low number is good. It is an absolute value in the units squared of the vertical axis, so only use it to compare models with a common vertical axis unit of measure and similar ranges. As with all these scores, they measure the aggregate vertical differences, aka residuals, of the actual cases to the best fit linear regression line. These scores use absolute or squared values to treat over-predicting and under-predicting equally.
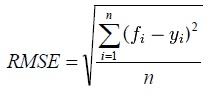
Root Mean Squared Error
This squares the differences rather than use an absolute difference. A high number is bad a low number is good. Only compare models with a common vertical axis unit of measure and similar ranges.
Relative Absolute Error
The ‘relative’ in this context is relative to the mean of all the actual ‘Y’s (the variable you are trying to predict). Because it is a ratio you can compare it to any other model. A high number is bad a low number is good.
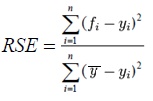
Relative Squared Error
The ‘relative’ in this context is relative to the mean of all the actual ‘Y’s. Because the score is a ratio between 0 and 1 you can compare it to any other model. This score squares the residuals instead of taking absolute differences. A high number is bad a low number is good.
Coefficient of Determination
The closer to 1 the better the model is at forecasting, while 0 means it isn’t any good at all and you might as well use the historic mean to predict the next outcome.
If you have a single variable X (Azure ML allows you to have multiple variables, too) that contains information to predict Y, then the coefficient of determination explains how much better using your model with X as an input performs compared to just taking the mean of Y to forecast any other Y. This score is only valid when the differences between the predicted value and the actual value have a normal distribution and the relationship is linear. A coefficient of determination of .7 means 70% of Y can be understood by using X to forecast Y and the other 30% cannot be explained by this model.
The coefficient of determination is sensitive to outliers. Outlier treatment is a subject in itself but as with all machine learning, take a good look at the variables going into the model to see if there are outliers.
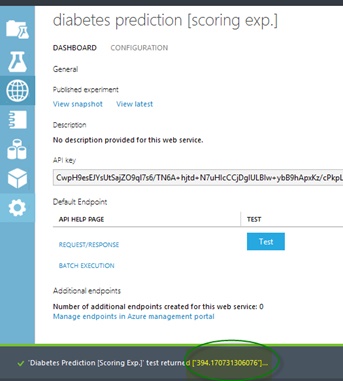
Following is screenshot of diabetes prediction experiment by regression algorithm.
See Also
Another important place to find an extensive amount of Cortana Intelligence Suite related articles is the TechNet Wiki itself. The best entry point is Cortana Intelligence Suite Resources on the TechNet Wiki.


