Classification Algorithms parameters in Azure ML
Introduction
In Azure machine learning studio when we create a classification ML experiment and when we click on visualize option of evaluate model there are many parameters metrics information along with charts is displayed to check the accuracy of algorithm. Different types of metrics are available in evaluate model like ROC Graph, Precision, Recall, F1 Score, Lift, TP, TN, FP, FN, AUC, Accuracy of algorithm etc. but to understand each metrics is important to work with machine learning experiments.
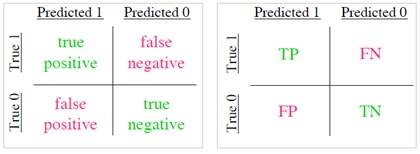
In general True positive, true negative, false positive, false negative are pioneer parameters for any algorithms means correctly identified and rejected results.
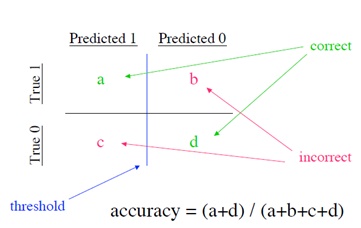
When we see confusion matrix below: we can easily calculate accuracy of algorithm by following equations
Precision and Recall
Precision and recall typically used in document retrieval.
Precision: how many of the returned documents are correct and Recall: how many of the positives does the model return
PRECISION = a / (a + c)
RECALL = a / (a + b)
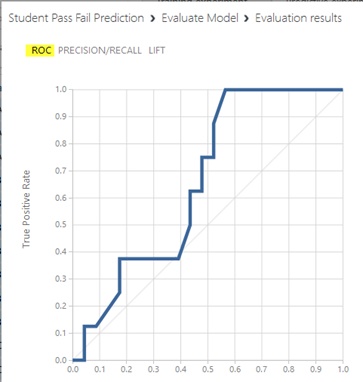
ROC
Receiver Operator Characteristic - Developed in WWII to statistically model false positive and false negative detections of radar operators, and better statistical foundations than most other measures. ROC is standard measure in medicine and biology ROC is becoming more popular in ML also.
Properties of ROC
• ROC Area:
– 1.0: perfect prediction
– 0.9: excellent prediction
– 0.8: good prediction
– 0.7: mediocre prediction
– 0.6: poor prediction
– 0.5: random prediction
– <0.5: something wrong!
ROC Slope is non-increasing each point on ROC represents different tradeoff (cost ratio) between false positives and false negatives, Slope of line tangent to curve defines the cost ratio. ROC Area represents performance averaged over all possible cost ratios If two ROC curves do not intersect, one method dominates the other, If two ROC curves intersect, one method is better for some cost ratios, and other method is better for other cost ratios.
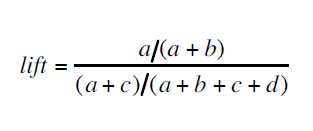
To calculate Lift following is equation
F1 Score
F1 Score is the harmonic mean of precision and Recall.
F1 = 2TP / (2TP + FP + FN)
Where, TP=True Positive, TN=True Negative, FP=False Positive, FN=False Negative
Threshold - Threshold is the value above which it belongs to first class and all other values to the second class. E.g. if the threshold is 0.5 then any patient scored more than or equal to 0.5 is identified as sick else healthy.
See Also
Another important place to find an extensive amount of Cortana Intelligence Suite related articles is the TechNet Wiki itself. The best entry point is Cortana Intelligence Suite Resources on the TechNet Wiki.


