Chart Widgets With Server Side Data In MVC Using Angular JS And Web API
In this article we will learn how we can create some client side chart widgets with the data from SQLServer database. We use MVC architecture with Web API and Angular JS to fetch the data and do all the manipulations. I am creating this application in Visual Studio 2015. In this project we covers topic of how to use HighChart with Angular JS. You can always get the tips/tricks/blogs about these mentioned technologies from the links given below.
-
Now we will go and create our application. I hope you will like this.
Download the source code
You can always download the source code here.
SQL Scripts With Insert Queries
Background
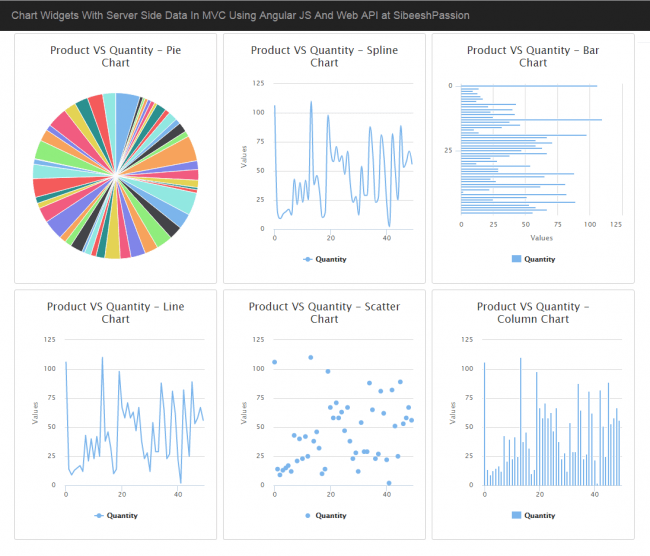
I am working now in a personal dashboard application in which I uses HighChart products for the chart integration. We can always load the chart widgets with server side data and Angular JS right? Here we will discuss that. We are going to create the preceding charts for our dashboard.
Pie Chart
Spline Chart
Bar Chart
Line Chart
Scatter Chart
Column Chart
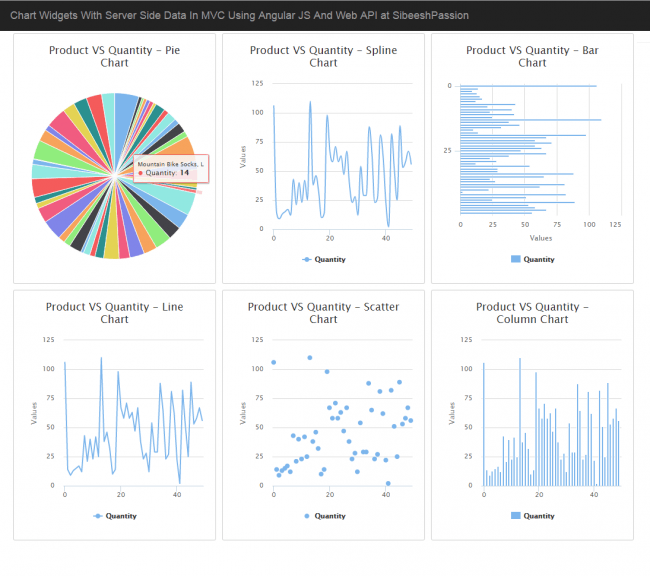
Once we are done, this is how our applications output will be.
http://sibeeshpassion.com/wp-content/uploads/2016/03/Chart-Widgets-With-Server-Side-Data-In-MVC-Using-Angular-JS-And-Web-API-Output-1024x875.png
Chart Widgets With Server Side Data In MVC Using Angular JS And Web API Output
Create a MVC application
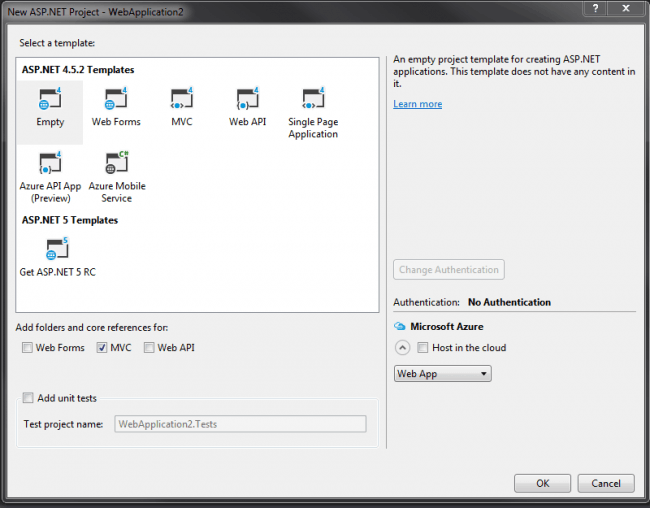
Click File-> New-> Project then select MVC application. From the following pop up we will select the template as empty and select the core references and folders for MVC.
http://sibeeshpassion.com/wp-content/uploads/2016/03/MVC-Project-With-Empty-Template-e1458122053871.png
MVC Project With Empty Template
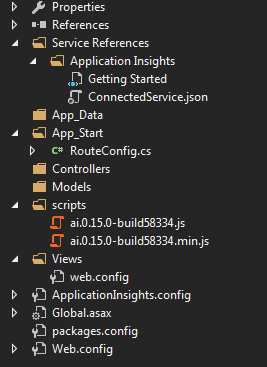
Once you click OK, a project with MVC like folder structure with core references will be created for you.
http://sibeeshpassion.com/wp-content/uploads/2016/03/Folder-Structure-And-References-For-Empty-MVC-Project.png
Folder Structure And References For Empty MVC Project
Before going to start the coding part, make sure that all the required extensions/references are installed. Below are the required things to start with.
Angular JS
jQuery
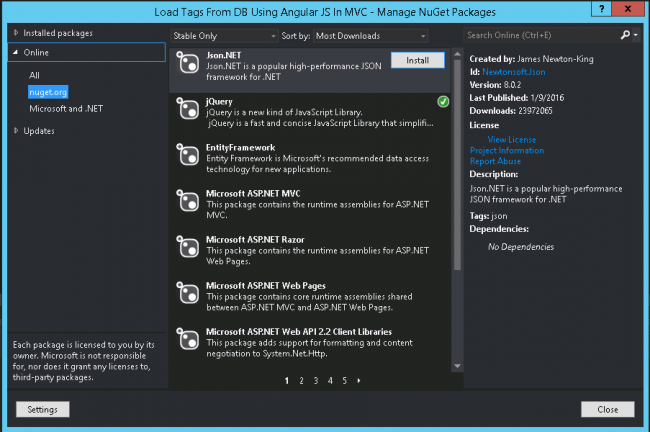
You can all the items mentioned above from NuGet. Right click on your project name and select Manage NuGet packages.
http://sibeeshpassion.com/wp-content/uploads/2016/02/Manage-NuGet-Package-Window-e1455700665396.png
Manage NuGet Package Window
Once you have installed those items, please make sure that all the items(jQuery, Angular JS files) are loaded in your scripts folder.
Using the code
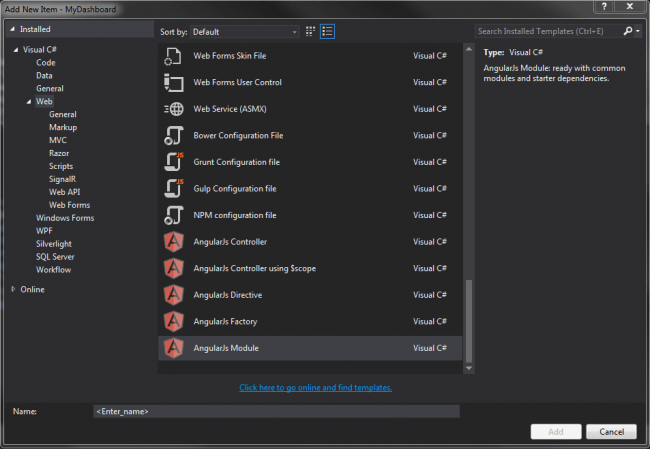
As I have said before, we are going to use Angular JS for our client side operations, so it is better to create the Angular JS script files first right? Just to make sure that we have got all the required things :). For that, create a folder named Widget in script folder and right click -> Add -> New Item -> Select AngularJS Module and enter the module name -> Click Add.
http://sibeeshpassion.com/wp-content/uploads/2016/03/Creating-Angular-JS-Modue-In-MVC-Application-e1458122639235.png
Creating Angular JS Modue In MVC Application
Follow the same procedure to create Angular JS factory and Angular JS controller. Yes, we have set everything to get started our coding. Now we will create a Web API controller and get the data from database in JSON format. Let’s start then.
Create Web API Controller
To create a Web API controller, just right click on your controller folder and click Add -> Controller -> Select Web API controller – Empty ( We will create our own actions later) -> Name the controller (Here I am giving the controller name as Widget).
So our controller is ready, now we need to set up our database so that we can create Entity Model for our application later.
Create a database
The following query can be used to create a database in your SQL Server.
SQL
USE [master]
GO

/****** Object:  Database [TrialsDB]    Script Date: 16-Mar-16 4:08:15 PM ******/
CREATE DATABASE [TrialsDB]
 CONTAINMENT = NONE
 ON  PRIMARY
( NAME = N'TrialsDB', FILENAME = N'C:\Program Files\Microsoft SQL Server\MSSQL11.MSSQLSERVER\MSSQL\DATA\TrialsDB.mdf' , SIZE = 3072KB , MAXSIZE = UNLIMITED, FILEGROWTH = 1024KB )
 LOG ON
( NAME = N'TrialsDB_log', FILENAME = N'C:\Program Files\Microsoft SQL Server\MSSQL11.MSSQLSERVER\MSSQL\DATA\TrialsDB_log.ldf' , SIZE = 1024KB , MAXSIZE = 2048GB , FILEGROWTH = 10%)
GO

ALTER DATABASE [TrialsDB] SET COMPATIBILITY_LEVEL = 110
GO

IF (1 = FULLTEXTSERVICEPROPERTY('IsFullTextInstalled'))
begin
EXEC [TrialsDB].[dbo].[sp_fulltext_database] @action = 'enable'
end
GO

ALTER DATABASE [TrialsDB] SET ANSI_NULL_DEFAULT OFF
GO

ALTER DATABASE [TrialsDB] SET ANSI_NULLS OFF
GO

ALTER DATABASE [TrialsDB] SET ANSI_PADDING OFF
GO

ALTER DATABASE [TrialsDB] SET ANSI_WARNINGS OFF
GO

ALTER DATABASE [TrialsDB] SET ARITHABORT OFF
GO

ALTER DATABASE [TrialsDB] SET AUTO_CLOSE OFF
GO

ALTER DATABASE [TrialsDB] SET AUTO_CREATE_STATISTICS ON
GO

ALTER DATABASE [TrialsDB] SET AUTO_SHRINK OFF
GO

ALTER DATABASE [TrialsDB] SET AUTO_UPDATE_STATISTICS ON
GO

ALTER DATABASE [TrialsDB] SET CURSOR_CLOSE_ON_COMMIT OFF
GO

ALTER DATABASE [TrialsDB] SET CURSOR_DEFAULT  GLOBAL
GO

ALTER DATABASE [TrialsDB] SET CONCAT_NULL_YIELDS_NULL OFF
GO

ALTER DATABASE [TrialsDB] SET NUMERIC_ROUNDABORT OFF
GO

ALTER DATABASE [TrialsDB] SET QUOTED_IDENTIFIER OFF
GO

ALTER DATABASE [TrialsDB] SET RECURSIVE_TRIGGERS OFF
GO

ALTER DATABASE [TrialsDB] SET  DISABLE_BROKER
GO

ALTER DATABASE [TrialsDB] SET AUTO_UPDATE_STATISTICS_ASYNC OFF
GO

ALTER DATABASE [TrialsDB] SET DATE_CORRELATION_OPTIMIZATION OFF
GO

ALTER DATABASE [TrialsDB] SET TRUSTWORTHY OFF
GO

ALTER DATABASE [TrialsDB] SET ALLOW_SNAPSHOT_ISOLATION OFF
GO

ALTER DATABASE [TrialsDB] SET PARAMETERIZATION SIMPLE
GO

ALTER DATABASE [TrialsDB] SET READ_COMMITTED_SNAPSHOT OFF
GO

ALTER DATABASE [TrialsDB] SET HONOR_BROKER_PRIORITY OFF
GO

ALTER DATABASE [TrialsDB] SET RECOVERY FULL
GO

ALTER DATABASE [TrialsDB] SET  MULTI_USER
GO

ALTER DATABASE [TrialsDB] SET PAGE_VERIFY CHECKSUM
GO

ALTER DATABASE [TrialsDB] SET DB_CHAINING OFF
GO

ALTER DATABASE [TrialsDB] SET FILESTREAM( NON_TRANSACTED_ACCESS = OFF )
GO

ALTER DATABASE [TrialsDB] SET TARGET_RECOVERY_TIME = 0 SECONDS
GO

ALTER DATABASE [TrialsDB] SET  READ_WRITE
GO
Now we will create the tables we needed. As of now I am going to create two tables.
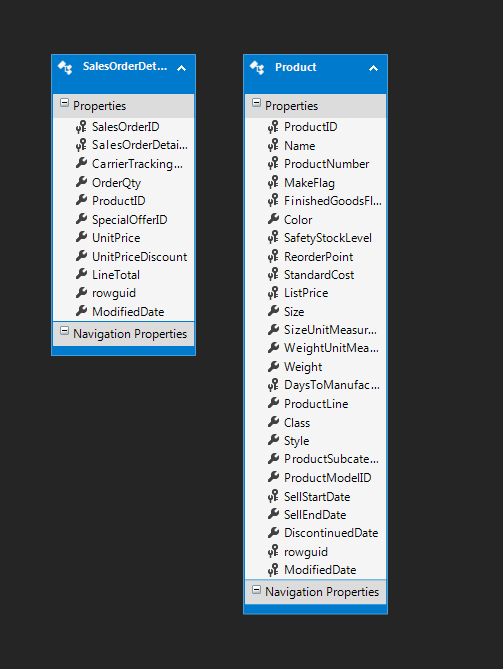
SalesOrderDetail
Product
These tables are having relationship by the key ProductID.
Create tables in database
Below is the query to create SalesOrderDetail table in database.
SQL
USE [TrialsDB]
GO

/****** Object:  Table [dbo].[SalesOrderDetail]    Script Date: 16-Mar-16 4:10:22 PM ******/
SET ANSI_NULLS ON
GO

SET QUOTED_IDENTIFIER ON
GO

CREATE TABLE [dbo].[SalesOrderDetail](
    [SalesOrderID] [int] NOT NULL,
    [SalesOrderDetailID] [int] IDENTITY(1,1) NOT NULL,
    [CarrierTrackingNumber] [nvarchar](25) NULL,
    [OrderQty] [smallint] NOT NULL,
    [ProductID] [int] NOT NULL,
    [SpecialOfferID] [int] NOT NULL,
    [UnitPrice] [money] NOT NULL,
    [UnitPriceDiscount] [money] NOT NULL,
    [LineTotal]  AS (isnull(([UnitPrice]*((1.0)-[UnitPriceDiscount]))*[OrderQty],(0.0))),
    [rowguid] [uniqueidentifier] ROWGUIDCOL  NOT NULL,
    [ModifiedDate] [datetime] NOT NULL,
 CONSTRAINT [PK_SalesOrderDetail_SalesOrderID_SalesOrderDetailID] PRIMARY KEY CLUSTERED
(
    [SalesOrderID] ASC,
    [SalesOrderDetailID] ASC
)WITH (PAD_INDEX = OFF, STATISTICS_NORECOMPUTE = OFF, IGNORE_DUP_KEY = OFF, ALLOW_ROW_LOCKS = ON, ALLOW_PAGE_LOCKS = ON) ON [PRIMARY]
) ON [PRIMARY]

GO
Now we will create the table Product.
SQL
USE [TrialsDB]
GO

/****** Object:  Table [dbo].[Product]    Script Date: 16-Mar-16 4:11:29 PM ******/
SET ANSI_NULLS ON
GO

SET QUOTED_IDENTIFIER ON
GO

CREATE TABLE [dbo].[Product](
    [ProductID] [int] NOT NULL,
    [Name] [nvarchar](max) NOT NULL,
    [ProductNumber] [nvarchar](25) NOT NULL,
    [MakeFlag] [bit] NOT NULL,
    [FinishedGoodsFlag] [bit] NOT NULL,
    [Color] [nvarchar](15) NULL,
    [SafetyStockLevel] [smallint] NOT NULL,
    [ReorderPoint] [smallint] NOT NULL,
    [StandardCost] [money] NOT NULL,
    [ListPrice] [money] NOT NULL,
    [Size] [nvarchar](5) NULL,
    [SizeUnitMeasureCode] [nchar](3) NULL,
    [WeightUnitMeasureCode] [nchar](3) NULL,
    [Weight] [decimal](8, 2) NULL,
    [DaysToManufacture] [int] NOT NULL,
    [ProductLine] [nchar](2) NULL,
    [Class] [nchar](2) NULL,
    [Style] [nchar](2) NULL,
    [ProductSubcategoryID] [int] NULL,
    [ProductModelID] [int] NULL,
    [SellStartDate] [datetime] NOT NULL,
    [SellEndDate] [datetime] NULL,
    [DiscontinuedDate] [datetime] NULL,
    [rowguid] [uniqueidentifier] ROWGUIDCOL  NOT NULL,
    [ModifiedDate] [datetime] NOT NULL
) ON [PRIMARY] TEXTIMAGE_ON [PRIMARY]

GO
Can we insert some data to the tables now?
Insert data to table
You can use the below query to insert the data to SalesOrderDetail.
SQL
USE [TrialsDB]
GO

INSERT INTO [dbo].[SalesOrderDetail]
           ([SalesOrderID]
           ,[CarrierTrackingNumber]
           ,[OrderQty]
           ,[ProductID]
           ,[SpecialOfferID]
           ,[UnitPrice]
           ,[UnitPriceDiscount]
           ,[rowguid]
           ,[ModifiedDate])
     VALUES
           (<SalesOrderID, int,>
           ,<CarrierTrackingNumber, nvarchar(25),>
           ,<OrderQty, smallint,>
           ,<ProductID, int,>
           ,<SpecialOfferID, int,>
           ,<UnitPrice, money,>
           ,<UnitPriceDiscount, money,>
           ,<rowguid, uniqueidentifier,>
           ,<ModifiedDate, datetime,>)
GO
and the following query can be used for the table Product
SQL
USE [TrialsDB]
GO

INSERT INTO [dbo].[Product]
           ([ProductID]
           ,[Name]
           ,[ProductNumber]
           ,[MakeFlag]
           ,[FinishedGoodsFlag]
           ,[Color]
           ,[SafetyStockLevel]
           ,[ReorderPoint]
           ,[StandardCost]
           ,[ListPrice]
           ,[Size]
           ,[SizeUnitMeasureCode]
           ,[WeightUnitMeasureCode]
           ,[Weight]
           ,[DaysToManufacture]
           ,[ProductLine]
           ,[Class]
           ,[Style]
           ,[ProductSubcategoryID]
           ,[ProductModelID]
           ,[SellStartDate]
           ,[SellEndDate]
           ,[DiscontinuedDate]
           ,[rowguid]
           ,[ModifiedDate])
     VALUES
           (<ProductID, int,>
           ,<Name, nvarchar(max),>
           ,<ProductNumber, nvarchar(25),>
           ,<MakeFlag, bit,>
           ,<FinishedGoodsFlag, bit,>
           ,<Color, nvarchar(15),>
           ,<SafetyStockLevel, smallint,>
           ,<ReorderPoint, smallint,>
           ,<StandardCost, money,>
           ,<ListPrice, money,>
           ,<Size, nvarchar(5),>
           ,<SizeUnitMeasureCode, nchar(3),>
           ,<WeightUnitMeasureCode, nchar(3),>
           ,<Weight, decimal(8,2),>
           ,<DaysToManufacture, int,>
           ,<ProductLine, nchar(2),>
           ,<Class, nchar(2),>
           ,<Style, nchar(2),>
           ,<ProductSubcategoryID, int,>
           ,<ProductModelID, int,>
           ,<SellStartDate, datetime,>
           ,<SellEndDate, datetime,>
           ,<DiscontinuedDate, datetime,>
           ,<rowguid, uniqueidentifier,>
           ,<ModifiedDate, datetime,>)
GO
So let us say, we have inserted the data as follows. If you feel bored of inserting data manually, you can always tun the SQL script file attached which has the insertion queries. Just run that, you will be all OK. If you don’t know how to generate SQL scripts with data, I strongly recommend you to have a read here
Next thing we are going to do is creating a ADO.NET Entity Data Model.
Create Entity Data Model
Right click on your model folder and click new, select ADO.NET Entity Data Model. Follow the steps given. Once you have done the processes, you can see the edmx file and other files in your model folder. Here I gave Dashboard for our Entity data model name. Now you can see a file with edmx extension have been created. If you open that file, you can see as below.
http://sibeeshpassion.com/wp-content/uploads/2016/03/Entity-Data-Model.png
Entity Data Model
Now go back our Web API controller. Please change the code as below.
C#
using System;
using System.Collections.Generic;
using System.Linq;
using System.Net;
using System.Net.Http;
using System.Web.Http;
using MyDashboard.Models;
using Newtonsoft.Json;
namespace MyDashboard.Controllers
{
    public class WidgetController : ApiController
    {
        public DashboardEntities de = new DashboardEntities();
        Retriever ret = new Retriever();
        public string getWidgetData()
        {
            var dataList = ret.GetWidgetData(de);
            return dataList;
        }
    }
}
Here we have created a new model class *Retriever *and we have added a method GetWidgetData in that class. Now let us see what I have coded in that.
C#
using Newtonsoft.Json;
using System;
using System.Collections.Generic;
using System.Linq;
using System.Web;

namespace MyDashboard.Models
{
    public class Retriever
    {
        public string GetWidgetData(DashboardEntities de)
        {
            try
            {
                using (de)
                {
                    var resList = (from sales in de.SalesOrderDetails
                                  join prod in de.Products
                                  on sales.ProductID equals prod.ProductID
                                  select new
                                  {
                                      ProductName = prod.Name,
                                      QuantityOrdered = sales.OrderQty
                                  });
                    var res = resList.GroupBy(d => d.ProductName).Select(g => new
                    {
                        name = g.FirstOrDefault().ProductName,
                        y = g.Sum(s => s.QuantityOrdered)
                    });
                    return JsonConvert.SerializeObject(res, Formatting.None, new JsonSerializerSettings()
                    {
                        ReferenceLoopHandling = ReferenceLoopHandling.Ignore
                    });
                }
            }
            catch (Exception)
            {
                throw new NotImplementedException();
            }

        }
    }
}
Here we are using LINQ to fetch the data, We uses JOIN in the query to find the Name from the table Products. Once the data is ready, we are just do group by the column ProductName and sum ofQuantityOrdered.
C#
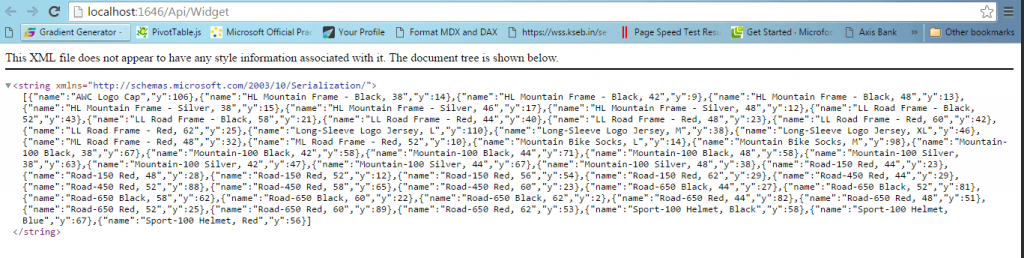
var res = resList.GroupBy(d => d.ProductName).Select(g => new
                    {
                        name = g.FirstOrDefault().ProductName,
                        y = g.Sum(s => s.QuantityOrdered)
                    });
So the coding part to fetch the data from database is read, now we need to check whether our Web API is ready for action!. To check that, you just need to run the URL http://localhost:1646/Api/Widget. HereWidget is our Web API controller name. I hope you get the data as a result. If you are getting the errorServer Error in ‘/’ Application The resource cannot be found, you need to configure your Web API inGlobal.asax.cs. You got this error just because you created an Empty project with only needed references. So here we need to do his step by our own. No worries, we will do it now. Just change the *Global.asax.cs *as follows.
C#
using System;
using System.Collections.Generic;
using System.Linq;
using System.Web;
using System.Web.Http;
using System.Web.Mvc;
using System.Web.Routing;

namespace MyDashboard
{
    public class MvcApplication : System.Web.HttpApplication
    {
        protected void Application_Start()
        {
            AreaRegistration.RegisterAllAreas();
            GlobalConfiguration.Configure(WebApiConfig.Register);//This is for setting the configuration
            RouteConfig.RegisterRoutes(RouteTable.Routes);
        }
    }
}
Now build your application and run the same URL again, you will get the output as follows.
http://sibeeshpassion.com/wp-content/uploads/2016/03/Web-API-Output-1024x258.png
Web API Output
Now we will go back to our angular JS files and consume this Web API. You need to change the scripts in the app.js, controller.js, factory.js as follows.
app.js
JavaScript
(function () {
    'use strict';
    angular.module('WidgetsApp', []);
})();
controller.js
JavaScript
(function () {
    'use strict';
    angular
        .module('WidgetsApp')
        .controller('WidgetsController', function ($scope, factory) {
            var res = factory.getData();
            var options;
            if (res != undefined) {
                res.then(function (d) {
                    var data = JSON.parse(d.data);

                }, function (error) {
                    console.log('Oops! Something went wrong while fetching the data.');
                });
            }
        });
})();
Once our service is called, we will get the data in return. We will parse the same and store it in a variable for future use.
JavaScript
var data = JSON.parse(d.data);factory.js
JavaScript
(function () {
    'use strict';
    angular
        .module('WidgetsApp')
        .service('factory', function ($http) {
            this.getData = function () {
                var url = 'Api/Widget';
                return $http({
                    type: 'get',
                    url: url
                });
            }
        });
})();
AS you can see we are just calling our Web API Api/Widget with the help of Angular $http.
Now we a view to show our data right? Yes, we need a controller too!.
Create a MVC controller
To create a controller, we need to right click on the controller folder, Add – Controller. I hope you will be given a controller as follows.
JavaScript
using System;
using System.Collections.Generic;
using System.Linq;
using System.Web;
using System.Web.Mvc;

namespace MyDashboard.Controllers
{
    public class HomeController : Controller
    {
        // GET: Home
        public ActionResult Index()
        {
            return View();
        }
    }
}
Here Home is our controller name.
Now we need a view right?
Creating a view
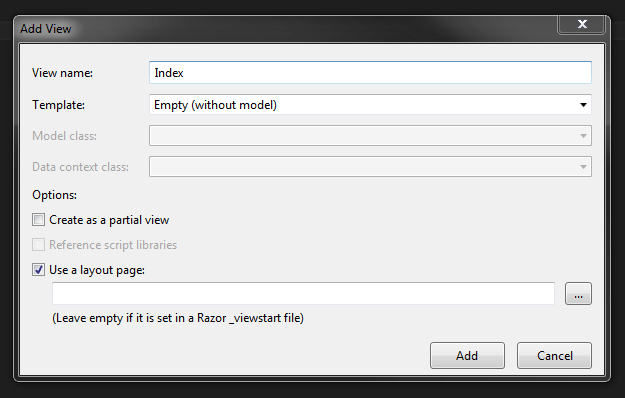
To create a view, just right click on your controller name -> Add View -> Add.
http://sibeeshpassion.com/wp-content/uploads/2016/03/Creating-a-view.png
Creating a view
Now in your view add the needed references.
HTML
<script src="~/scripts/jquery-1.10.2.min.js"></script>
<script src="~/scripts/jquery-ui-1.11.4.min.js"></script>
<script src="~/scripts/angular.min.js"></script>
<script src="~/scripts/angular-aria.js"></script>
<script src="~/scripts/angular-route.js"></script>
<script src="~/scripts/Widgets/app.js"></script>
<script src="~/scripts/Widgets/controller.js"></script>
<script src="~/scripts/Widgets/factory.js"></script>
Once we add the references, we can call our Angular JS controller as follows.
HTML
<div ng-app="WidgetsApp">
    <div ng-controller="WidgetsController">
    </div>
</div>
Now if you run your application, you can see our Web API call works fine and successfully get the data. Next thing we need to do is creating charts with the data we get.
Create chart widgets with the data
As I said, we are going to to create HighChart chart widgets, we need to add a reference to use that plug in.
HTML
<script src="https://code.highcharts.com/highcharts.js"></script>Now create elements where we can load our chart.
HTML
<div ng-app="WidgetsApp">
    <div ng-controller="WidgetsController">
        <div id="widgetPie" class="widget">Placeholder for chart</div>
        <div id="widgetspline" class="widget">Placeholder for chart</div>
        <div id="widgetBar" class="widget">Placeholder for chart</div>
        <div id="widgetLine" class="widget">Placeholder for chart</div>
        <div id="widgetScatter" class="widget">Placeholder for chart</div>
        <div id="widgetColumn" class="widget">Placeholder for chart</div>
    </div>
</div>
You can style your elements as follows if you want, but this is optional.
HTML
    .widget {
        width: 30%;
        border: 1px solid #ccc;
        padding: 10px;
        margin: 5px;
        border-radius: 3px;
        transition: none;
        -webkit-transition: none;
        -moz-transition: none;
        -o-transition: none;
        cursor: move;
        display: inline-block;
        float:left;
    }
Go back to our Angular JS controller and add the below codes right after we get the data from server.
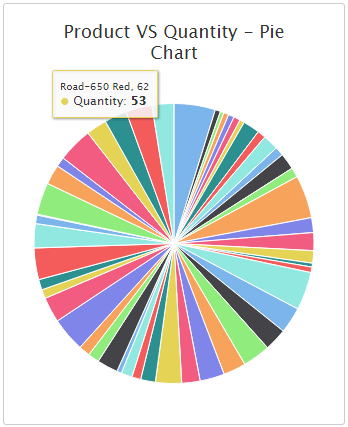
Pie Chart
JavaScript
var data = JSON.parse(d.data);
                    var categories = [];
                    for (var i = 0; i < data.length; i++) {
                        categories.push(data[i].name)
                    }
                    options = new Highcharts.chart('widgetPie', {
                        credits: {
                            enabled: false
                        },
                        chart: {
                            type: 'pie',
                            renderTo: ''
                        },
                        title: {
                            text: 'Product VS Quantity - Pie Chart'
                        },
                        plotOptions: {
                            pie: {
                                allowPointSelect: true,
                                cursor: 'pointer',
                                dataLabels: {
                                    enabled: false,
                                    format: '<b>{point.name}</b>: {point.y:,.0f}'
                                }
                            }
                        },
                        series: [{
                            name:'Quantity',
                            data: data
                        }]
                    });
Now run your application, you can see a pie chart with the data given.
http://sibeeshpassion.com/wp-content/uploads/2016/03/Pie-Chart-In-MVC-With-Angular-JS-And-Web-API.png
Pie Chart In MVC With Angular JS And Web API
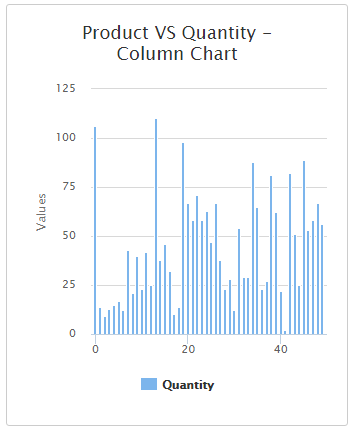
Column Chart
JavaScript
options = new Highcharts.chart('widgetColumn', {
                        credits: {
                            enabled: false
                        },
                        chart: {
                            type: 'column',
                            renderTo: ''
                        },
                        title: {
                            text: 'Product VS Quantity - Column Chart'
                        },
                        series: [{
                            name: 'Quantity',
                            data: data
                        }]
                    });
Now run your application, you can see a column chart with the data given.
http://sibeeshpassion.com/wp-content/uploads/2016/03/Column-Chart-In-MVC-With-Angular-JS-And-Web-API.png
Column Chart In MVC With Angular JS And Web API
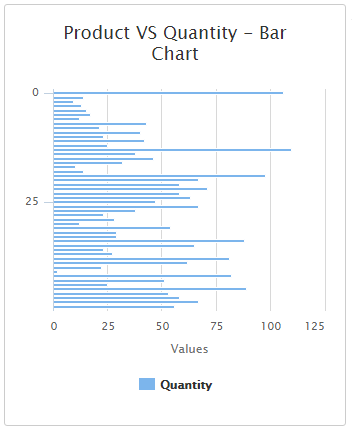
Bar Chart
JavaScript
options = new Highcharts.chart('widgetBar', {
                        credits: {
                            enabled: false
                        },
                        chart: {
                            type: 'bar',
                            renderTo: ''
                        },
                        title: {
                            text: 'Product VS Quantity - Bar Chart'
                        },
                        series: [{
                            name: 'Quantity',
                            data: data
                        }]
                    });
Now run your application, you can see a Bar chart with the data given.
http://sibeeshpassion.com/wp-content/uploads/2016/03/Bar-Chart-In-MVC-With-Angular-JS-And-Web-API.png
Bar Chart In MVC With Angular JS And Web API
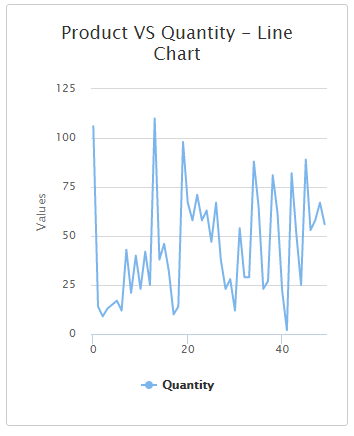
Line Chart
JavaScript
options = new Highcharts.chart('widgetLine', {
                        credits: {
                            enabled: false
                        },
                        chart: {
                            type: 'line',
                            renderTo: ''
                        },
                        title: {
                            text: 'Product VS Quantity - Line Chart'
                        },
                        series: [{
                            name: 'Quantity',
                            data: data
                        }]
                    });
Now run your application, you can see a Line chart with the data given.
http://sibeeshpassion.com/wp-content/uploads/2016/03/Line-Chart-In-MVC-With-Angular-JS-And-Web-API.png
Line Chart In MVC With Angular JS And Web API
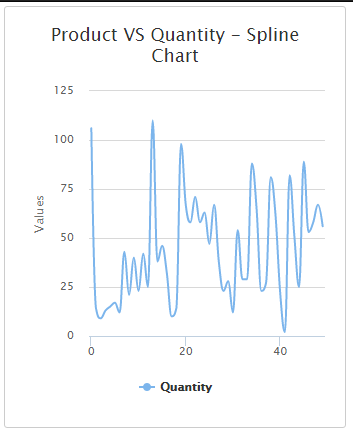
Spline Chart
JavaScript
options = new Highcharts.chart('widgetspline', {
                        credits: {
                            enabled: false
                        },
                        chart: {
                            type: 'spline',
                            renderTo: ''
                        },
                        title: {
                            text: 'Product VS Quantity - Spline Chart'
                        },
                        series: [{
                            name: 'Quantity',
                            data: data
                        }]
                    });
Now run your application, you can see a Spline chart with the data given.
http://sibeeshpassion.com/wp-content/uploads/2016/03/Spline-Chart-In-MVC-With-Angular-JS-And-Web-API.png
Spline Chart In MVC With Angular JS And Web API
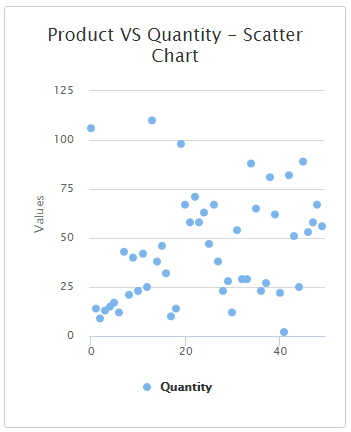
Scatter Chart
JavaScript
options = new Highcharts.chart('widgetScatter', {
                       credits: {
                           enabled: false
                       },
                       chart: {
                           type: 'scatter',
                           renderTo: ''
                       },
                       title: {
                           text: 'Product VS Quantity - Scatter Chart'
                       },
                       series: [{
                           name: 'Quantity',
                           data: data
                       }]
                   });
Now run your application, you can see a Scatter chart with the data given.
http://sibeeshpassion.com/wp-content/uploads/2016/03/Scatter-Chart-In-MVC-With-Angular-JS-And-Web-API.png
Scatter Chart In MVC With Angular JS And Web API
Now this is how complete code for our controller.js file looks like.
JavaScript
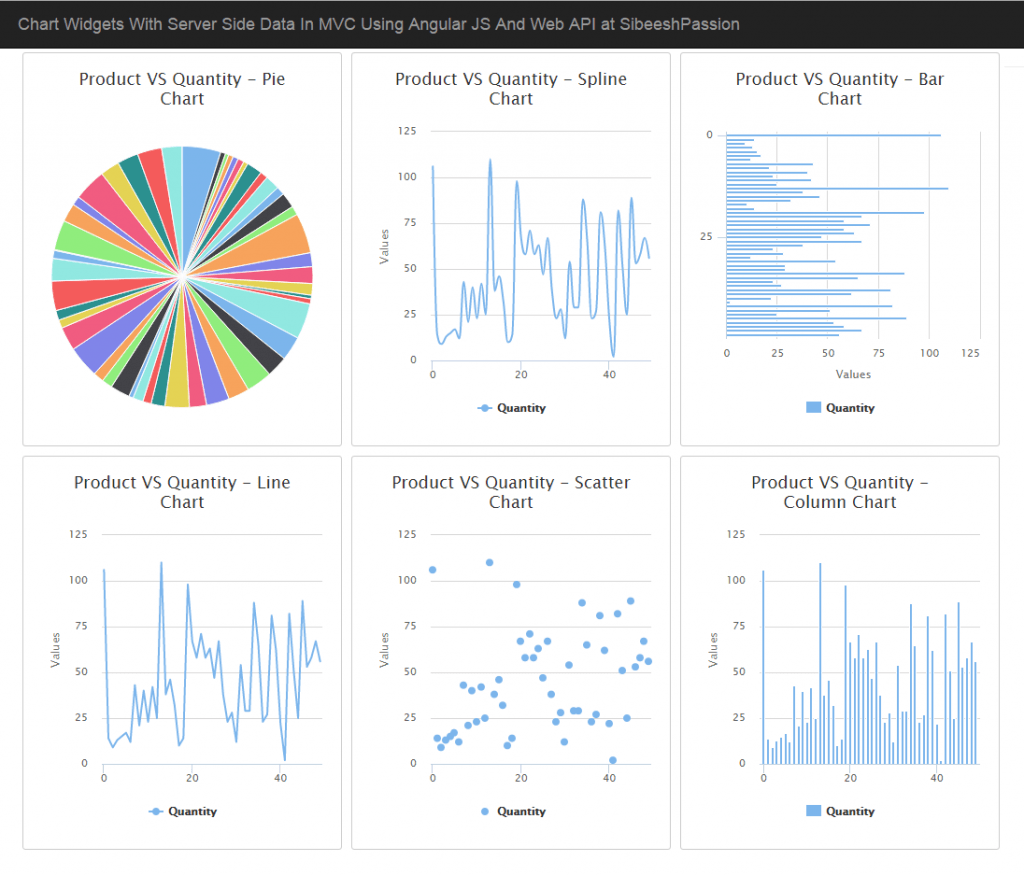
(function () {
    'use strict';
    angular
        .module('WidgetsApp')
        .controller('WidgetsController', function ($scope, factory) {
            var res = factory.getData();
            var options;
            if (res != undefined) {
                res.then(function (d) {
                    var data = JSON.parse(d.data);
                    var categories = [];
                    for (var i = 0; i < data.length; i++) {
                        categories.push(data[i].name)
                    }
                    options = new Highcharts.chart('widgetPie', {
                        credits: {
                            enabled: false
                        },
                        chart: {
                            type: 'pie',
                            renderTo: ''
                        },
                        title: {
                            text: 'Product VS Quantity - Pie Chart'
                        },
                        plotOptions: {
                            pie: {
                                allowPointSelect: true,
                                cursor: 'pointer',
                                dataLabels: {
                                    enabled: false,
                                    format: '<b>{point.name}</b>: {point.y:,.0f}'
                                }
                            }
                        },
                        series: [{
                            name:'Quantity',
                            data: data
                        }]
                    });
                    options = new Highcharts.chart('widgetColumn', {
                        credits: {
                            enabled: false
                        },
                        chart: {
                            type: 'column',
                            renderTo: ''
                        },
                        title: {
                            text: 'Product VS Quantity - Column Chart'
                        },
                        series: [{
                            name: 'Quantity',
                            data: data
                        }]
                    });
                    options = new Highcharts.chart('widgetBar', {
                        credits: {
                            enabled: false
                        },
                        chart: {
                            type: 'bar',
                            renderTo: ''
                        },
                        title: {
                            text: 'Product VS Quantity - Bar Chart'
                        },
                        series: [{
                            name: 'Quantity',
                            data: data
                        }]
                    });
                    options = new Highcharts.chart('widgetLine', {
                        credits: {
                            enabled: false
                        },
                        chart: {
                            type: 'line',
                            renderTo: ''
                        },
                        title: {
                            text: 'Product VS Quantity - Line Chart'
                        },
                        series: [{
                            name: 'Quantity',
                            data: data
                        }]
                    });
                    options = new Highcharts.chart('widgetspline', {
                        credits: {
                            enabled: false
                        },
                        chart: {
                            type: 'spline',
                            renderTo: ''
                        },
                        title: {
                            text: 'Product VS Quantity - Spline Chart'
                        },
                        series: [{
                            name: 'Quantity',
                            data: data
                        }]
                    });
                    options = new Highcharts.chart('widgetScatter', {
                        credits: {
                            enabled: false
                        },
                        chart: {
                            type: 'scatter',
                            renderTo: ''
                        },
                        title: {
                            text: 'Product VS Quantity - Scatter Chart'
                        },
                        series: [{
                            name: 'Quantity',
                            data: data
                        }]
                    });
                }, function (error) {
                    console.log('Oops! Something went wrong while fetching the data.');
                });
            }
        });
})();
If you have configured all the chart types, we can see the output now.
http://sibeeshpassion.com/wp-content/uploads/2016/03/Chart-Widgets-In-MVC-With-Angular-JS-And-Web-API-1024x907.png
We have done everything!. That’s fantastic right? Have a happy coding.