IoT Suite - Under The Hood - Predictive Maintenance
https://msdnshared.blob.core.windows.net/media/2016/08/0841.NinjaAwardTinySilver.pngSilver Award Winner
Introduction
This article continues the series detailing the components that are created when you use IoT Suite to generate your IoT solution. I will examine the components for the second example, Predictive Maintenance.
Overview
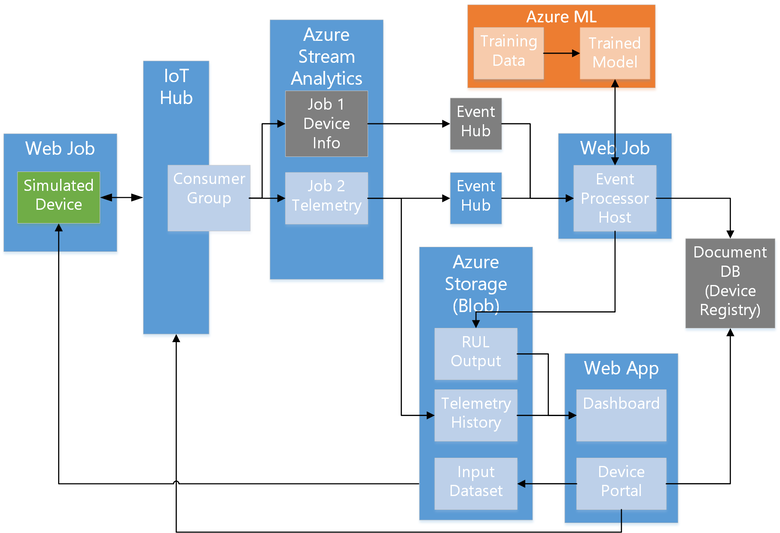
When you create an IoT solution with IoT Suite, it creates all the bits for you that you will need to run the example. Below is a diagram that shows the components, taken from the official walk through here.
The diagram above comes from the official walk through documentation HERE.
The code used for these components are available from GitHub - https://github.com/Azure/azure-iot-predictive-maintenance
The grey boxes are not implemented, just to show how you could arrange things. The actual devices in this case are listed in Table Storage, as explained below.
Running IoT Suite
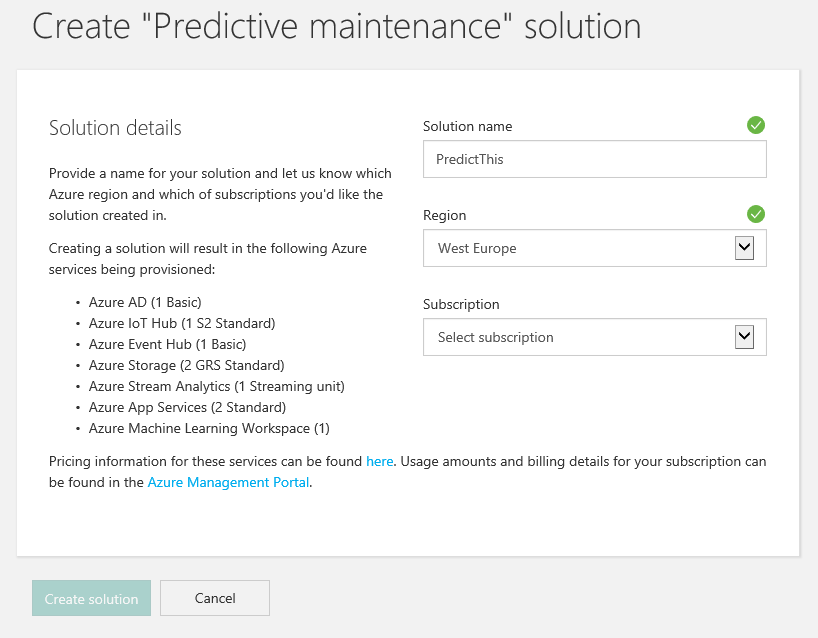
Setting up your IoT solution is just a few clicks! Just chose the option from the available icons, then enter the name of your solution, region and subscription.
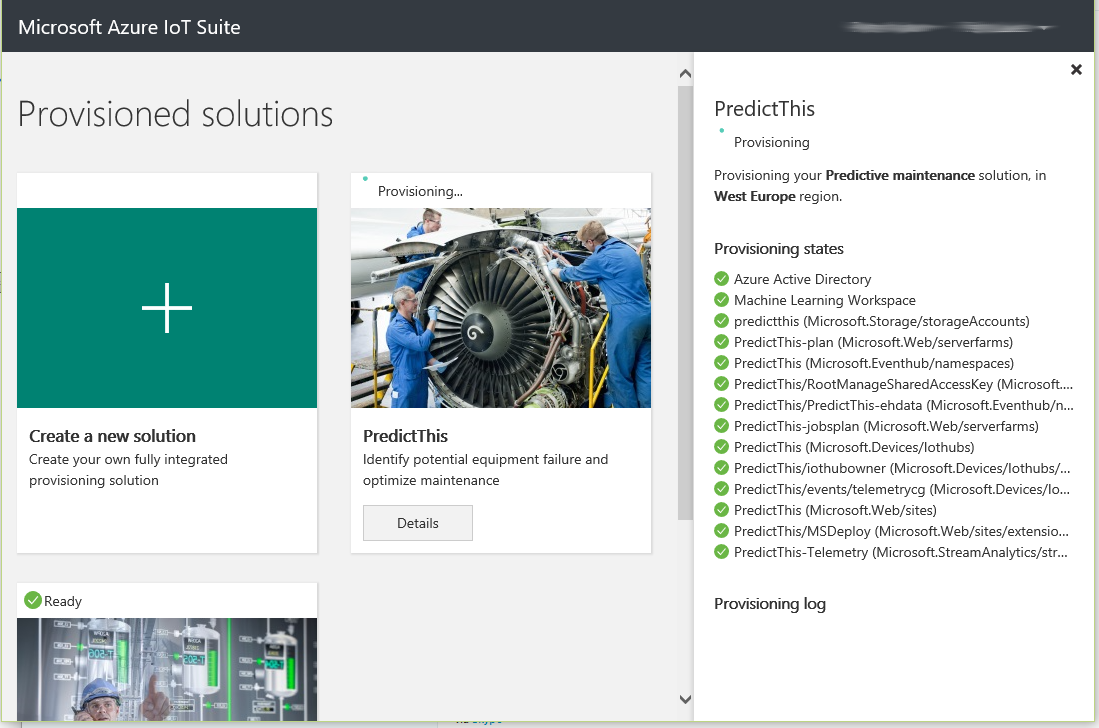
You will have to wait a few moments while Azure sets up everything for you, but it keeps a handy tally down the right side, to show progress.
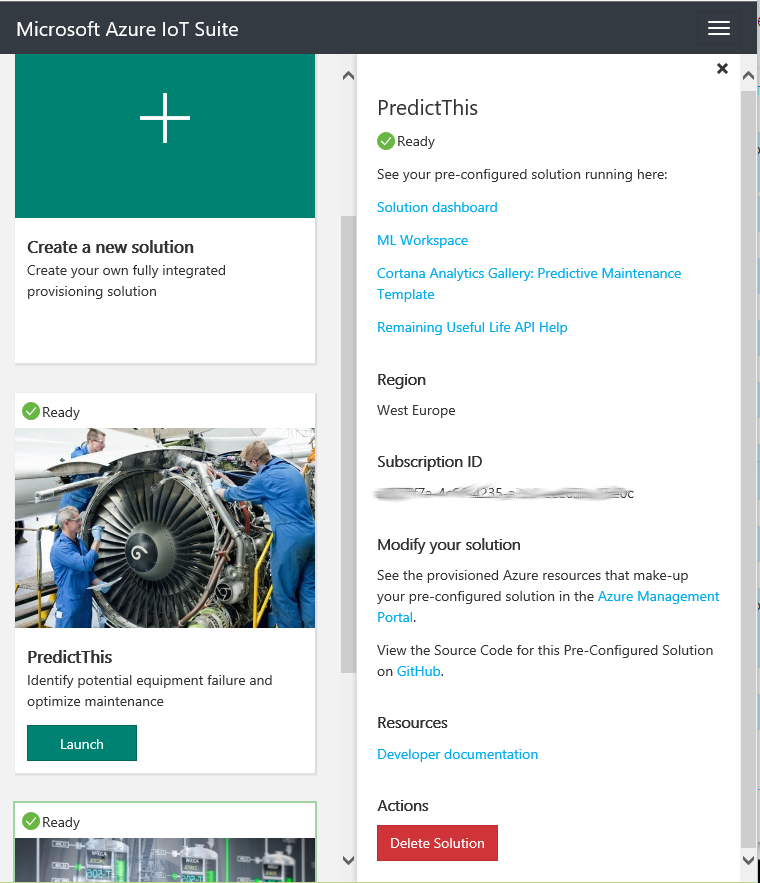
Once created, you will be presented with a list of jumping points, for your solution.
Solution dashboard will take you to the application page, where you can test your solution.
Clicking the ML Workspace link opens up your pre-provisioned machine learning workspace with two machine learning experiments in it.
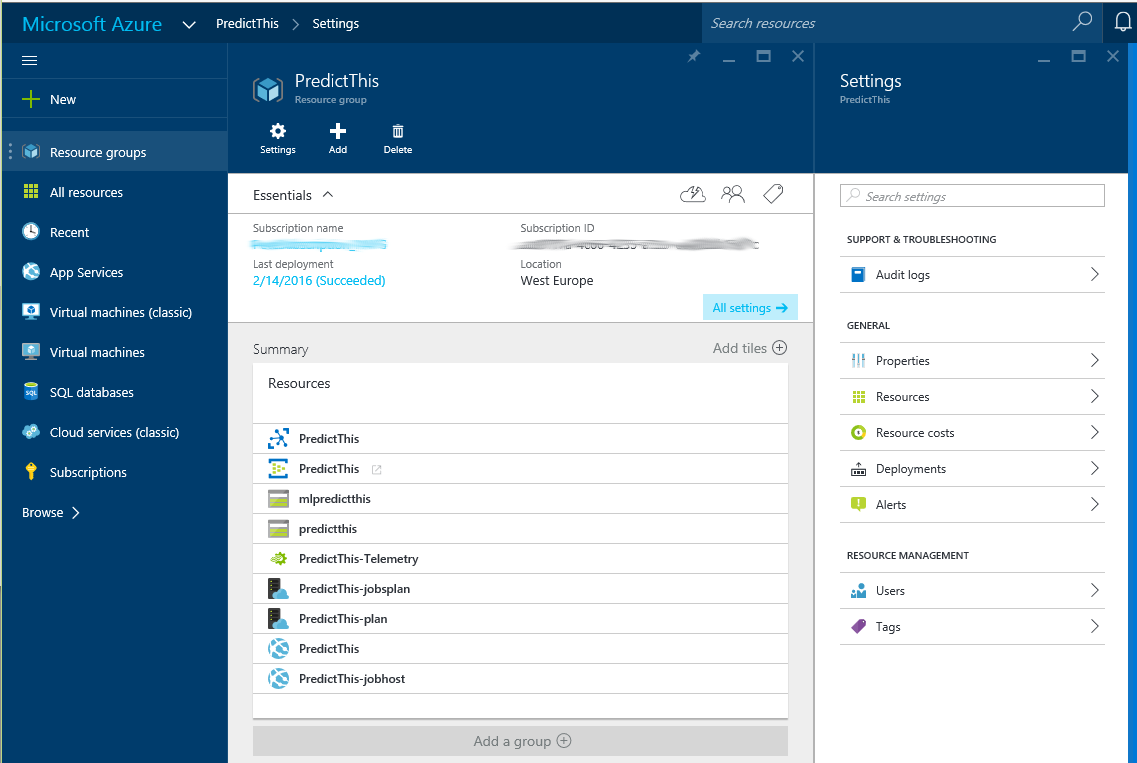
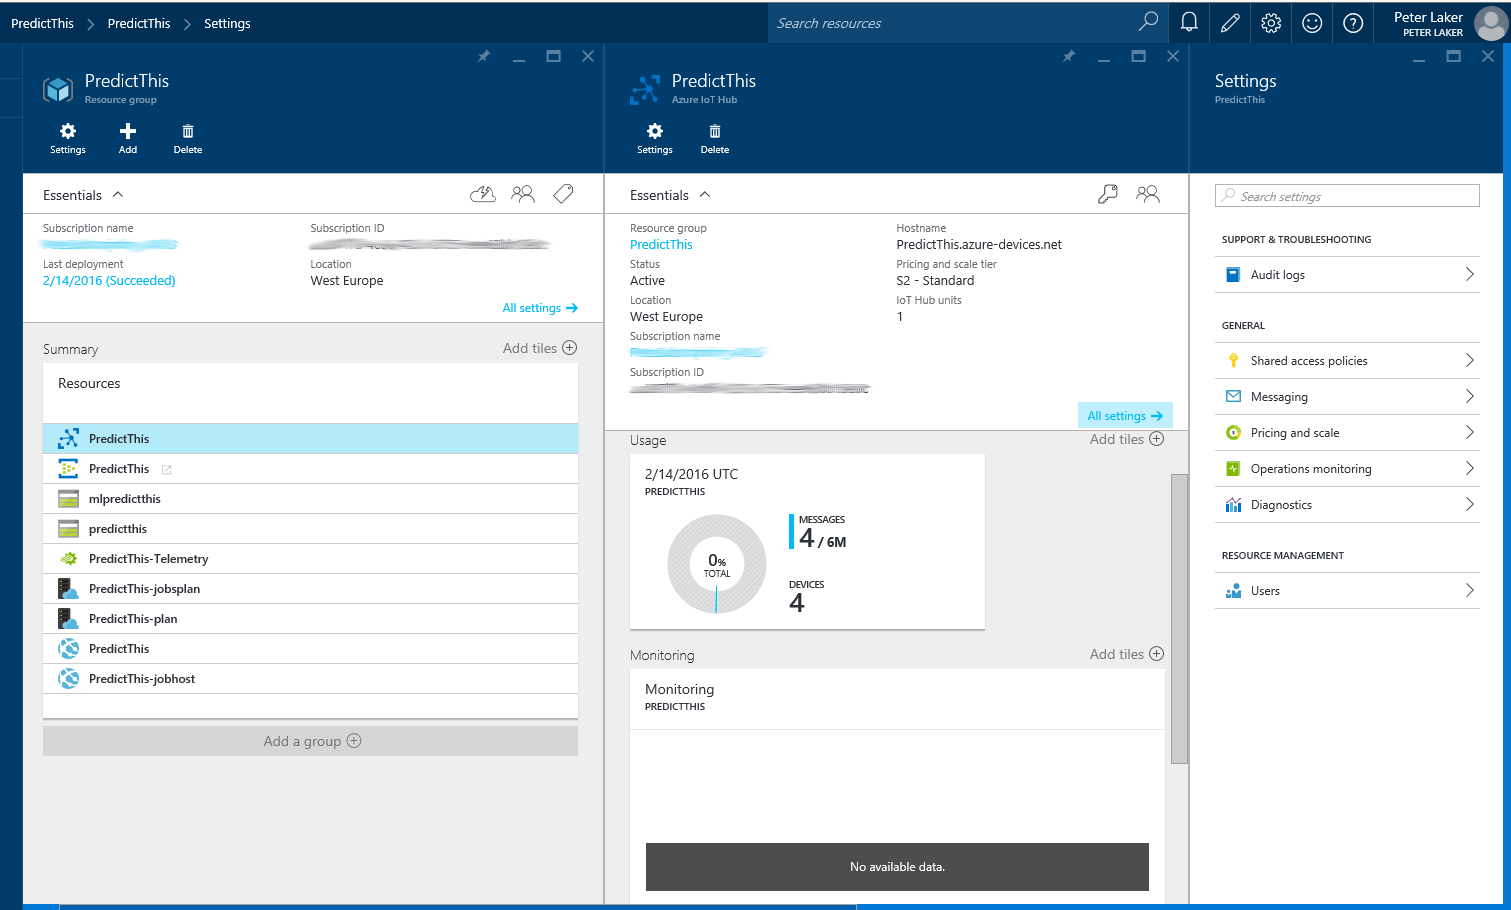
Modify your Solution has a link back into Azure Portal, where you will find the items described below. They are handily grouped together in a Resource Group
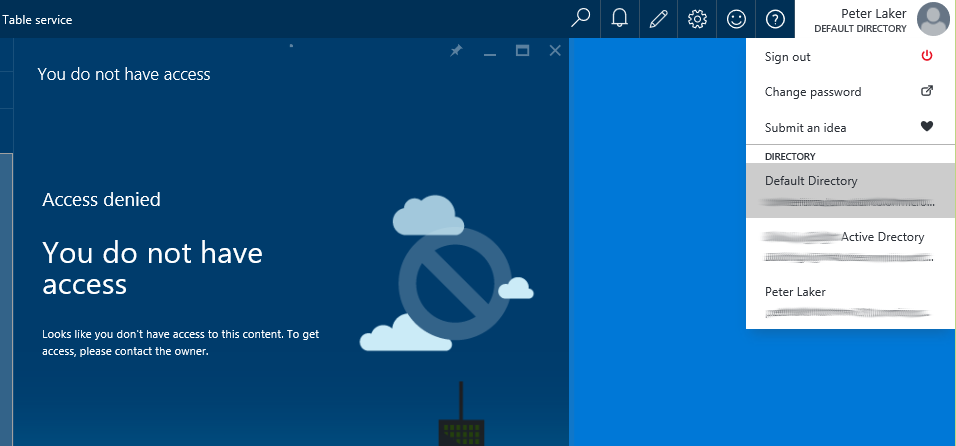
If you see an "Access Denied - You do not have access" error on Azure Portal...
[At the time of writing this]
This happens when jumping between IoT Suite and Azure Portal, but only if you have multiple Azure Active Directories.
Azure Portal remembers which account you last logged in with, so if that is different from the account you created your IoT solution with, then you will see this access denied error.
You simply have to chose the correct login from the list top right, as shown below:
Predictive Maintenance Solution Components
In this document, I will examine each component and what they contain by default. Once you understand these, you can change as you need, or replace some components with others, like SQL instead of DocumentDb.
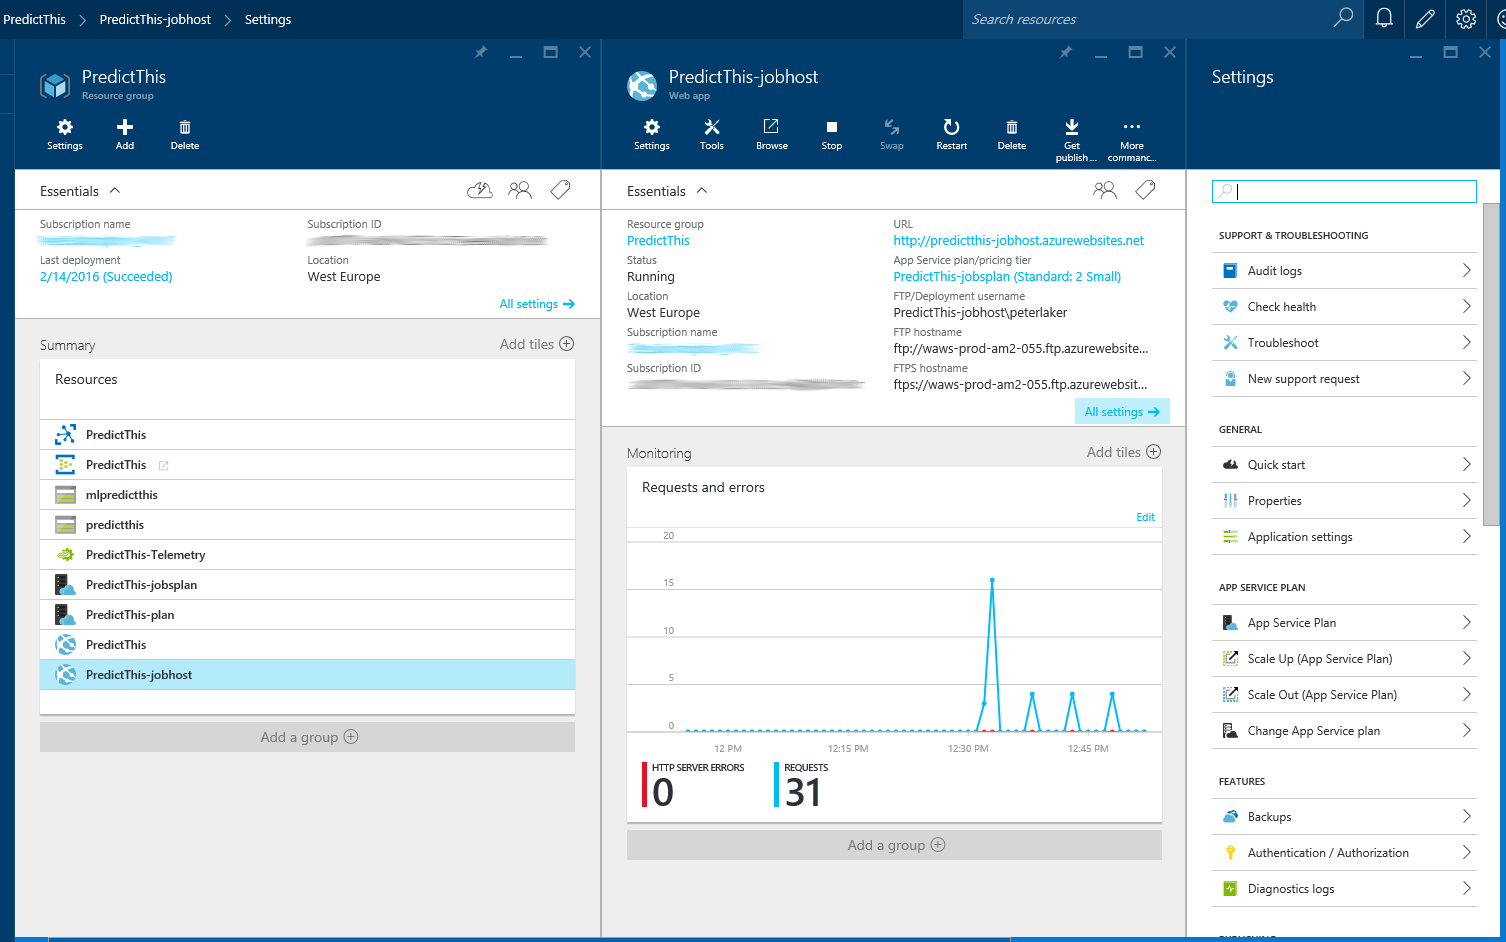
Web Job (Simulated Device)
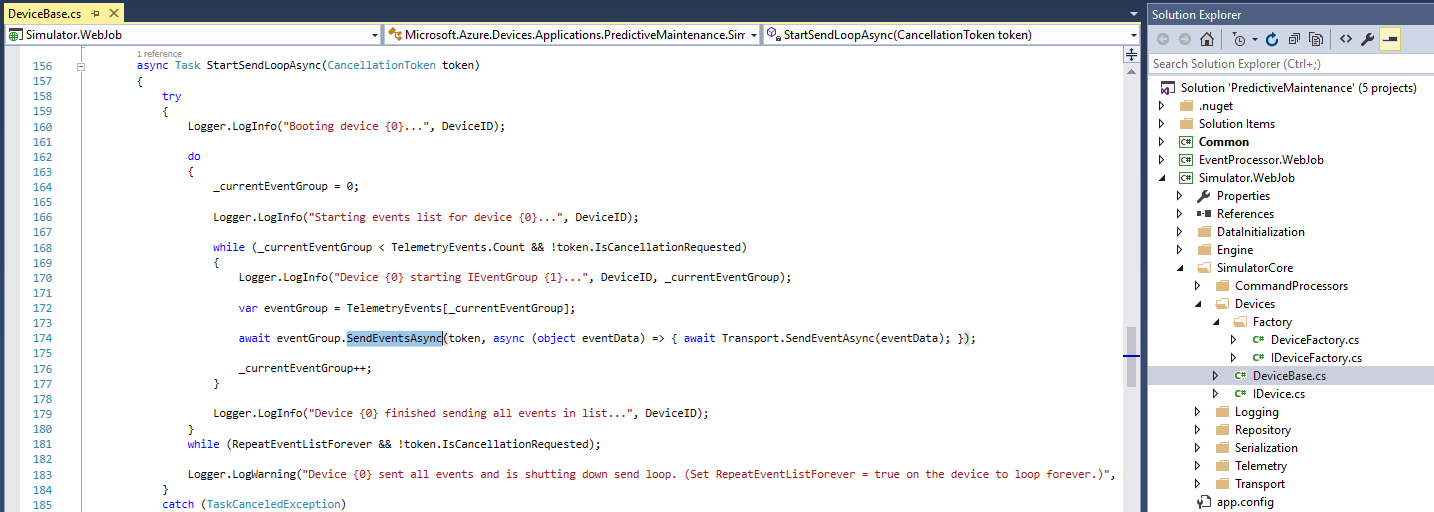
This Web Job simulates the device data, by sending the telemetry data to IoT Hub periodically.
The Web Job takes it's data from a csv file. Then when the simulation is started, it loops through the data, sending the data over a period of time.
IoT Hub
This is the ingestion point where the data from the simulated plane comes into the system.
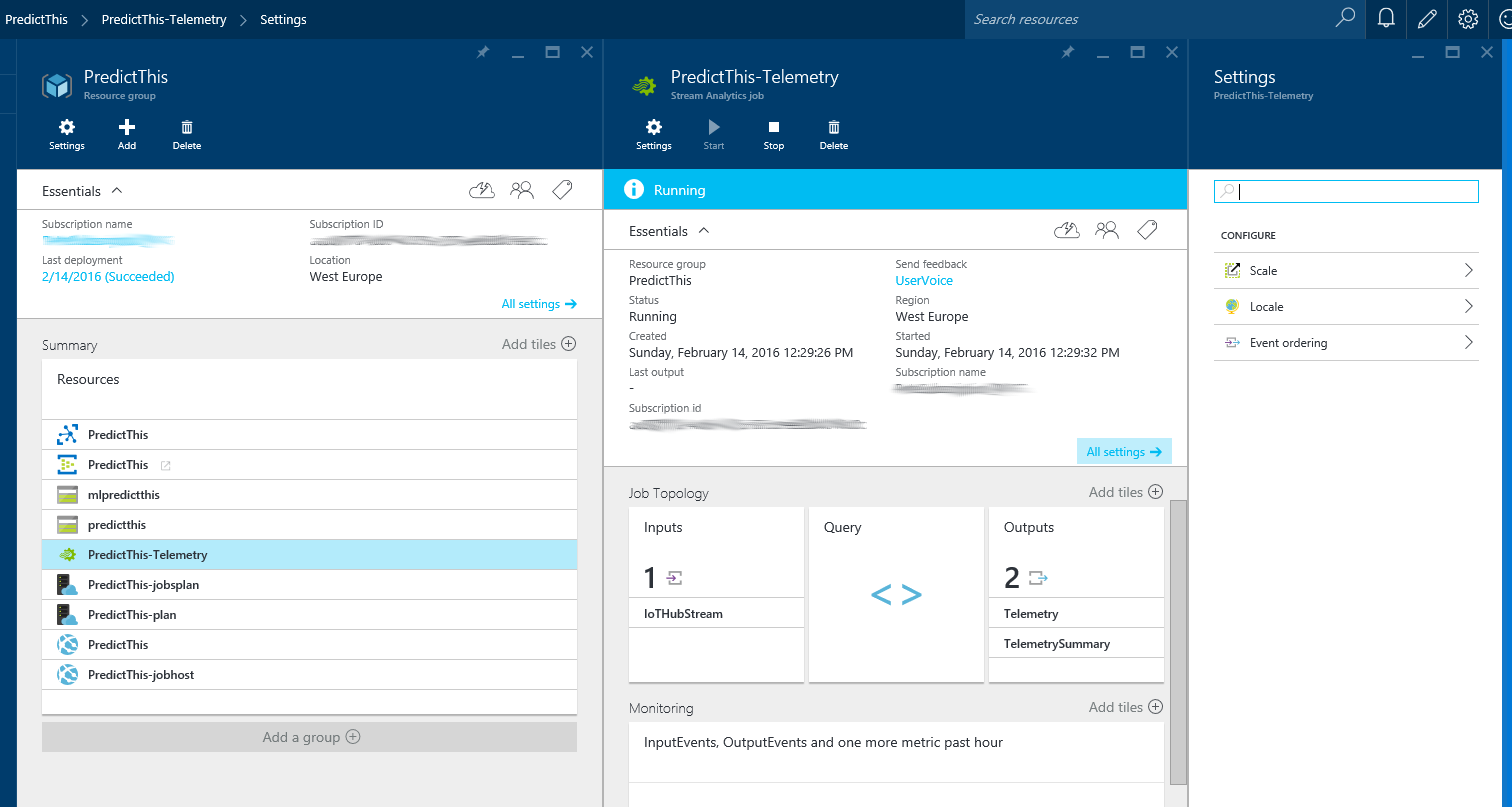
Azure Stream Analytics
Two queries within one Stream Analytics job watch the data coming in from the IoT Hub. One is just to store the data in Blob storage. The Dashboard also feeds from this data. The second stream analytics job aggregates the sensor data for a given cycle (cycle in the solution is synonymous with an airplane flight of variable length). The aggregations are passed to the pre-provisioned machine learning model to calculate remaining useful life per cycle.
PredictThis-Telemetry
Input
- Data Stream - IoTHubStream
- Iot Hub : PredictThis
- Consumer Group : telemetrycg
Query
| WITH [StreamData] AS ( SELECT * FROM [IoTHubStream] WHERE [ObjectType] IS NULL -- Filter Out Device Info And Command Responses ) |
SELECT DeviceId, Counter, Cycle, Sensor9, Sensor11, Sensor14, Sensor15 INTO [Telemetry] FROM [StreamData] |
| SELECT DeviceId, Cycle, AVG(Sensor9) AS Sensor9, AVG(Sensor11) AS Sensor11, AVG(Sensor14) AS Sensor14, AVG(Sensor15) AS Sensor15 INTO [TelemetrySummary] FROM [StreamData] GROUP BY DeviceId, Cycle, SLIDINGWINDOW(Minute, 2) |
| -- Duration Must Cover The Longest Possible Cycle HAVING SUM(EndOfCycle) = 2 -- Sum When EndOfCycle Contains Both Start And End Events |
Outputs
1. Telemetry - Table Storage
- Storage Account : predictthis
- Table Name : devicetelemetry
- Partition Key : DeviceId
- Row Key : Counter
2. TelemetrySummary (Device Info) - Event Hub
- Service Bus Namespace : PredictThis
- Event Hub Name : PredictThis-ehdata
- Partition Key Column : DeviceId
Event Hub
The Event Hub is "internal" to the solution, used to manage queues of data. This means if any internal part breaks, it can pick up from where it left off. This kind of solution has proved most successful at handling large volumes of data and recovering from problems. When you are working with high volumes of data that just cannot get lost, this is essential.
Web Job - Event Processor Host
This is a host application for the Event Processor and Simulator Web Jobs
Document Db (Device Registry)
This is not part of the solution, just a suggestion in Microsoft's diagram. Read it in original context HERE.
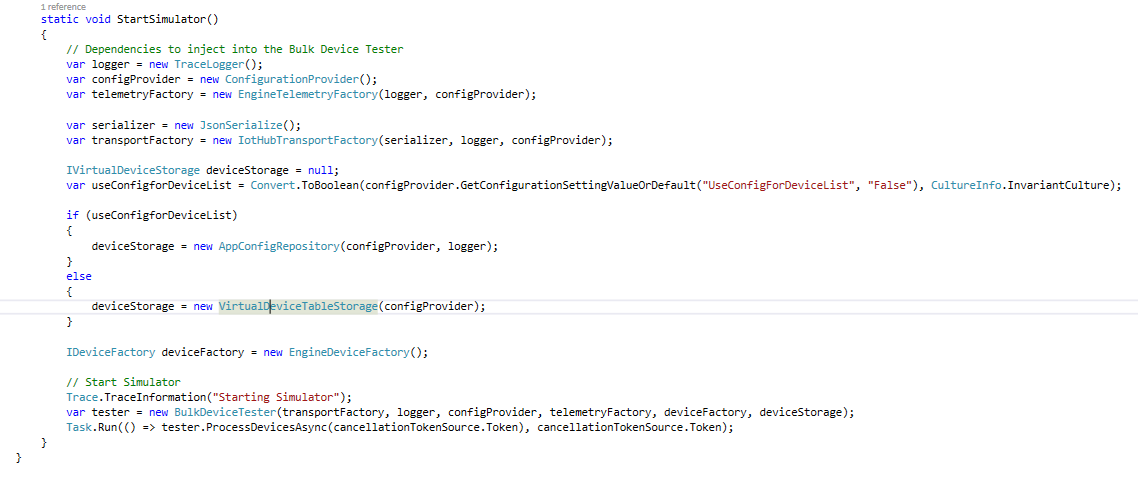
Devices are actually managed in the "DeviceList" Table Storage.
There is not a DocumentDb instance created in the Resource Group, or referred to in code.
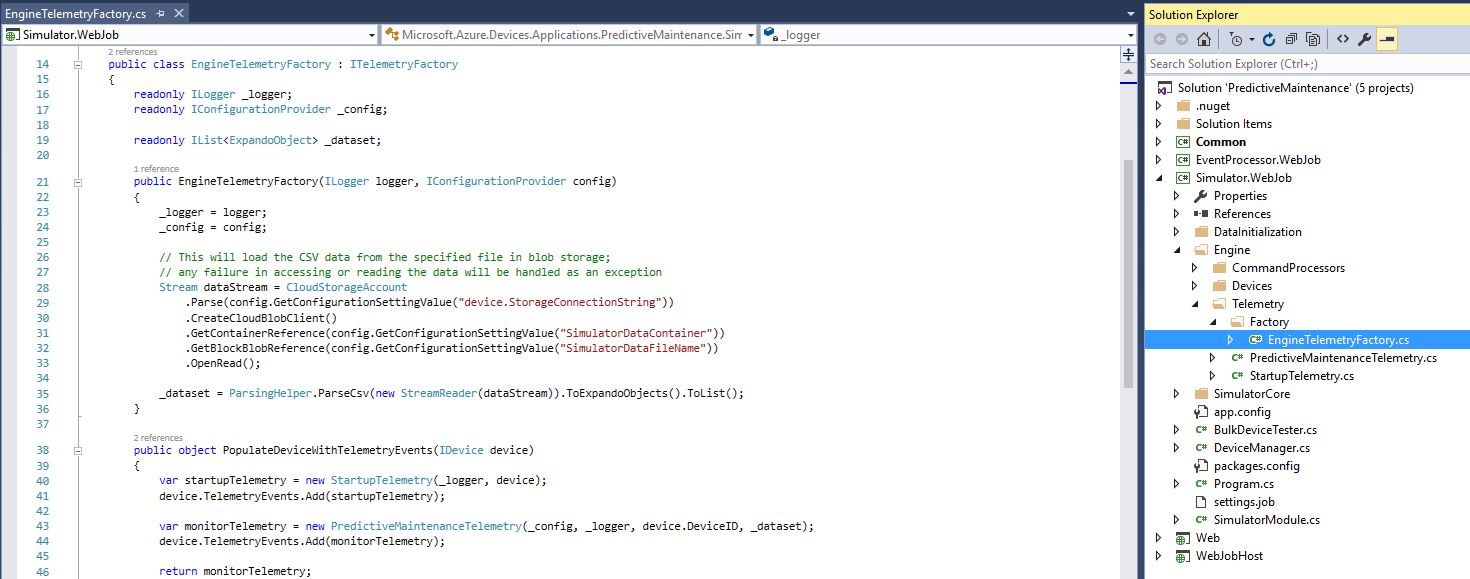
Devices are loaded when the simulator starts, as shown below:
Azure Storage (Blob)
RUL Output
See "devicemlresult" Table Service, below.
Telemetry History
Device telemetry (sensor data) is stored in "devicetelemetry" Table Storage below.
The file in Blob storage is the Event Hub config/info file that the partitions in Event Hub use.
An example of it's contents below:
{"EventHubPath":"predictthis-ehdata","CreatedAt":"2016-02-14T12:27:46.01Z","PartitionCount":4}
Input Dataset
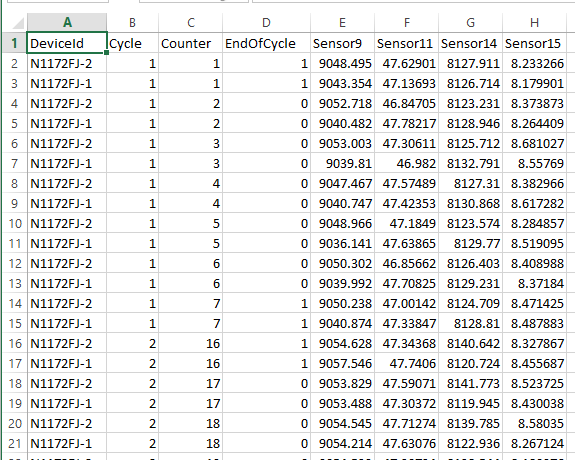
This csv file contains the engine sensor data, that will be replayed in this simulation.
Below is an example of it's contents, as seen in Microsoft Excel:@
Azure Storage (Table Service aka Blob)
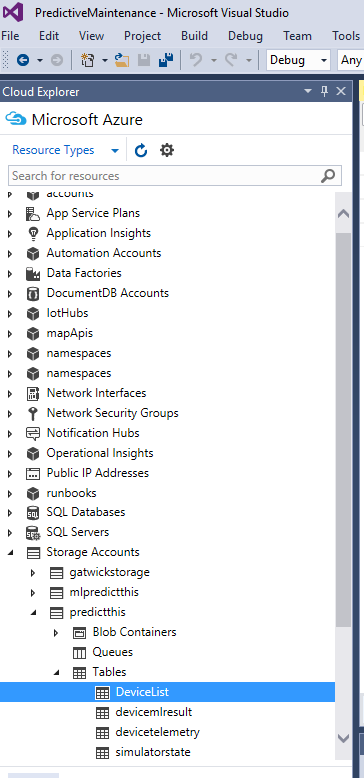
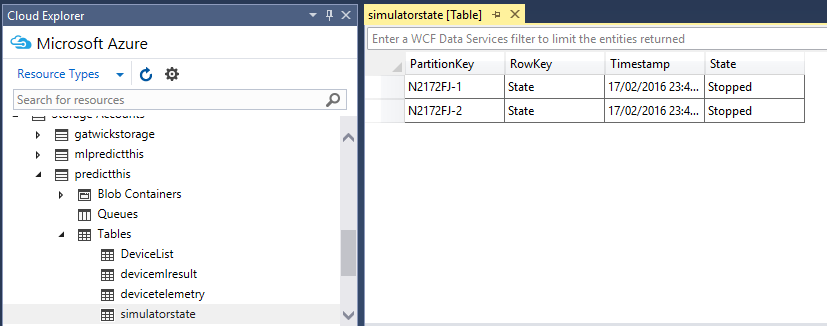
A good way to investigate and fiddle with the contents of these tables is via Visual Studio. You can browse to them in Cloud Explorer.
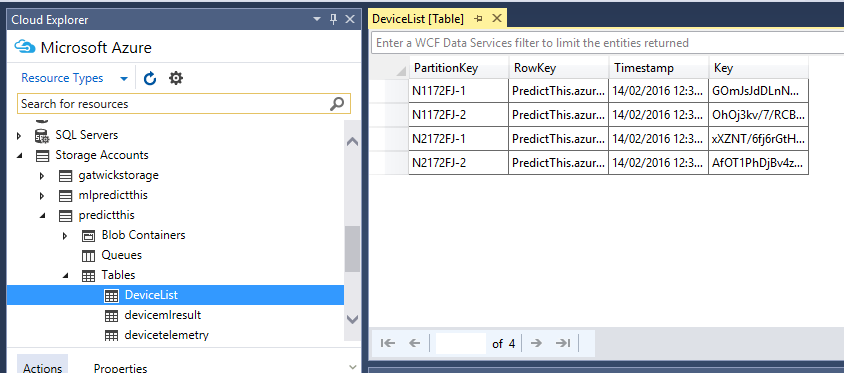
DeviceList
This lists the devices that have been defined for this demo. It also has the "Primatry Auth" key that the device uses.
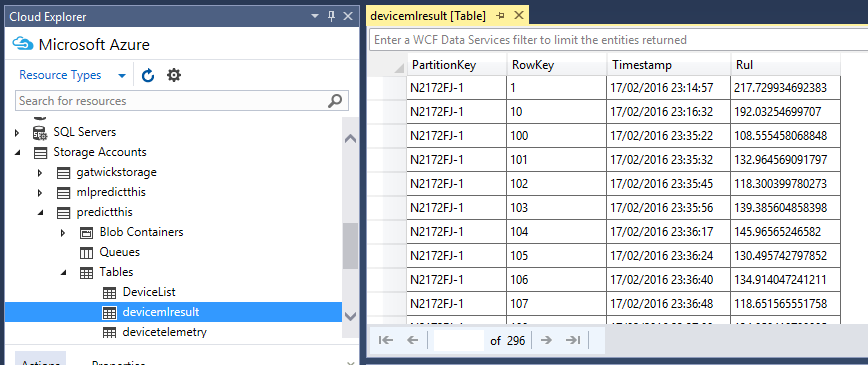
devicemlresult
This is the result data that comes out of the Machine Learning job.
devicetelemetry
This holds all the device data that is coming in through IoT Hub. It is populated from the Stream Analytics job.
In this example, Microsoft take my favoured approach for telemetry, by passing it to Table Storage. This is also my preferred method of storing date related data cheaply. It only has partition and rowkey to index on, but rowkey can be a "compound key", allowing more ways to query. This is the fastest, cheapest most queryable (in this scenario) solution.
simulatorstate
This table lists the state changes of the simulators, which is read by the Web App
Web App
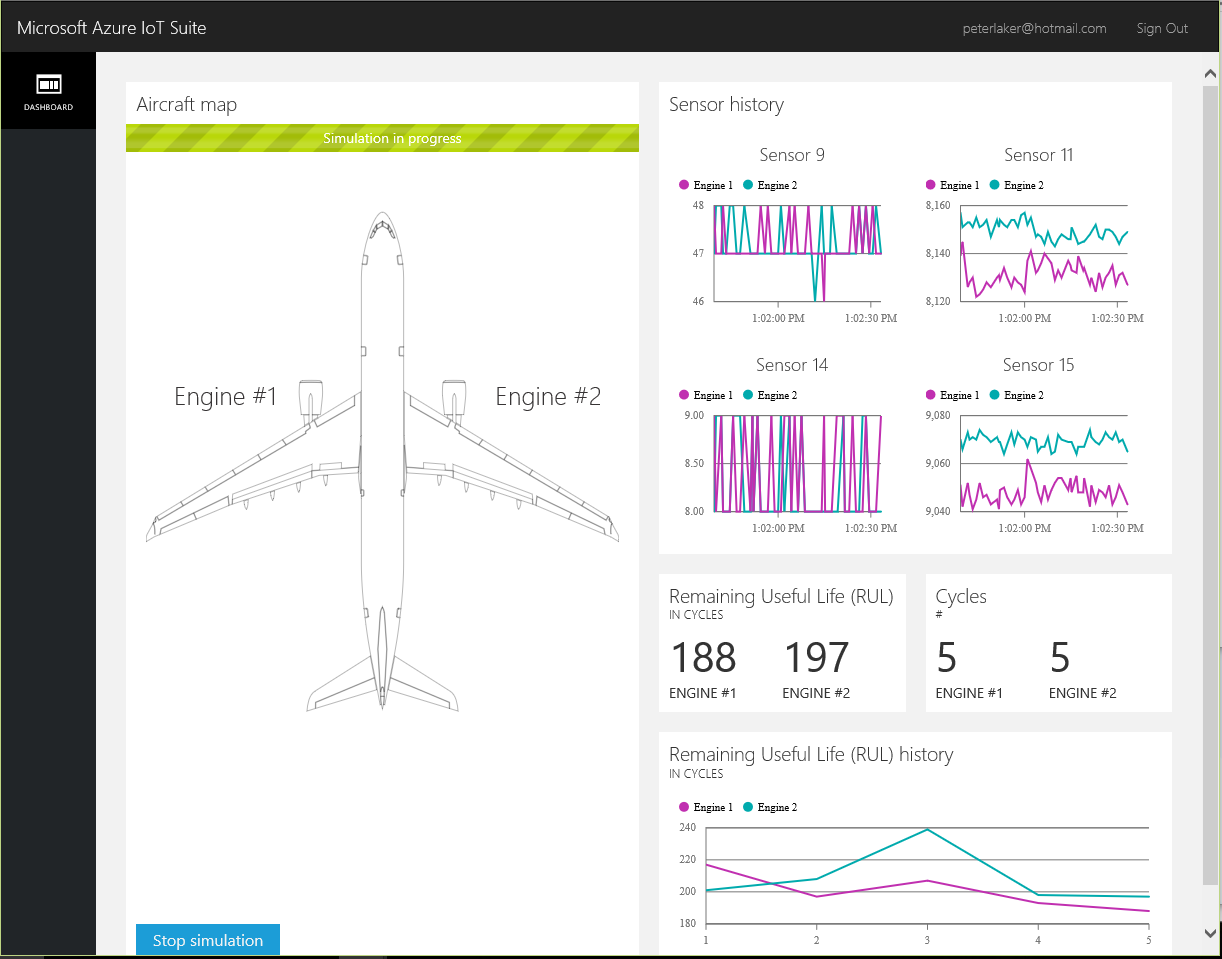
This is an example Web App Microsoft provide with this solution, to show how you can represent the data and manage the devices.
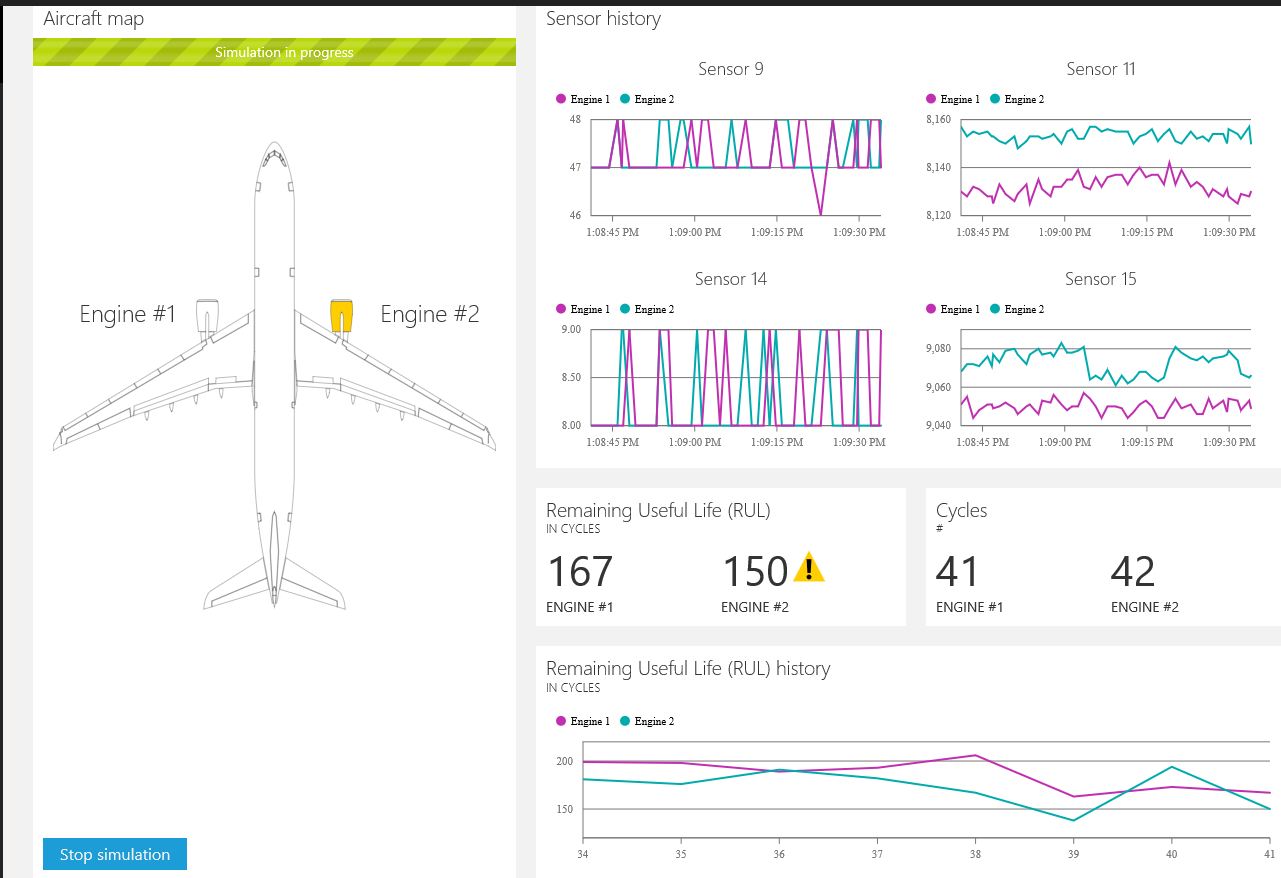
You click the "Start Simulation" button, bottom left to start the simulation running. In this scenario, an alert triggers when RUL < 160.
When it triggers an alert, you will see a warning icon on the engine, as shown below:
Dashboard
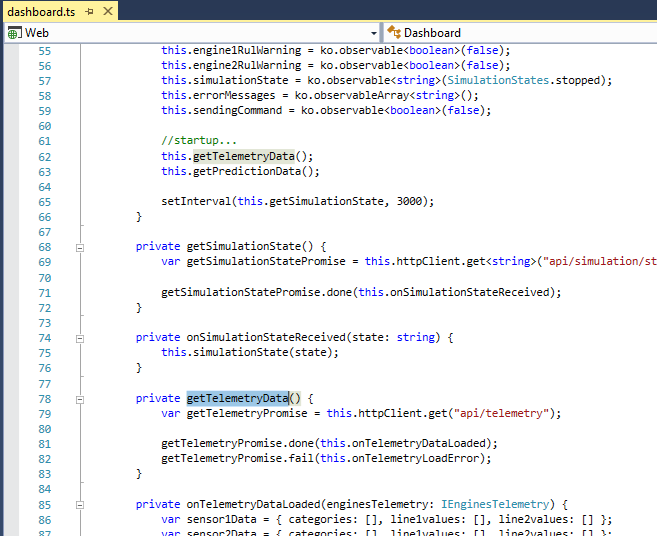
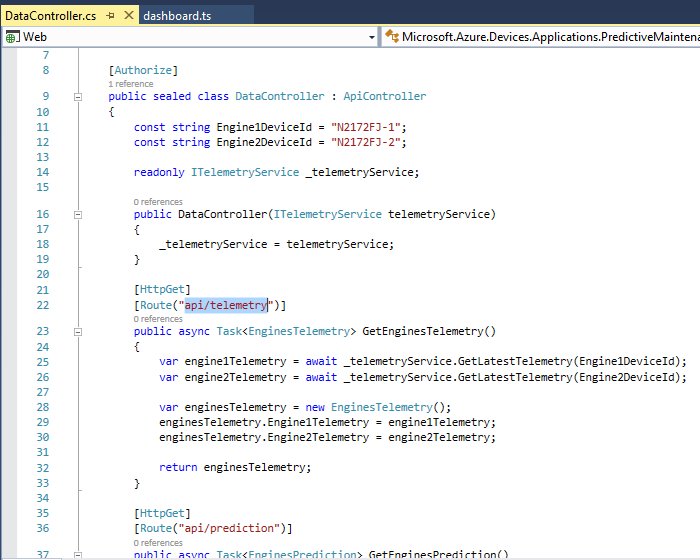
This component is the public Single Page Application, presented in this demo. It uses TypeScript to populate the data bound elements of the index page.
The "httpClient.get" shown above targets the api method below:
Azure ML
This component is explained in great detail in the walk through documentation. Some snapshots below
Training Data
image to come
Trained Model
image to come
