IoT Suite - Under The Hood - Remote Monitoring
Introduction
When you create a "Remote Monitoring" IoT Suite solution, what you actually get is a whole bunch of cool technology wrapped up in one bundle. Everything you need to configure and end-to-end solution for device data ingress, monitoring and control.
IoT Suite is an initial set-up wizard, to help your business take all the pain out of spinning up a proof-of-concept, or the initial architecture for your project. It will configure all the parts and wiring that you will need to create the whole solution.
This is great for spinning up "proof of concept" example, and even to lay the ground work for a final production solution You could just replace the dummy devices with real ones, and define your own rules. It is also great for generating dummy data, if you are working on just a user interface tool.
Because the solutions are available on GitHub, you can trace all the parts and wiring underlying the whole end-to-end solution and scenario.
This is just one example of how you can set up the system. Once you understand everything, you can chop and change as suits your needs with each project.
This article is a detailed checklist and breakdown of each component you get "out of the box" when you use the IoT Suite tool to create your IoT solution.
For a detailed description of adding devices to this solution, read IoT Suite - Remote Monitoring - Adding Live and Simulated Devices.
Overview
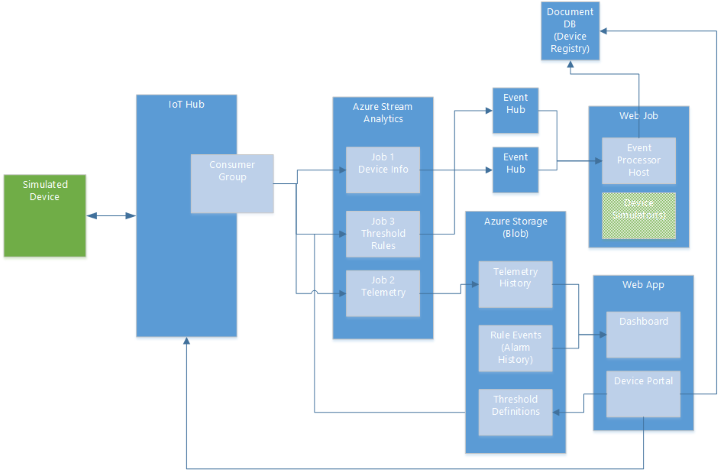
Below is the [to date] published diagram from Microsoft, which shows the basic configuration, as shown here:
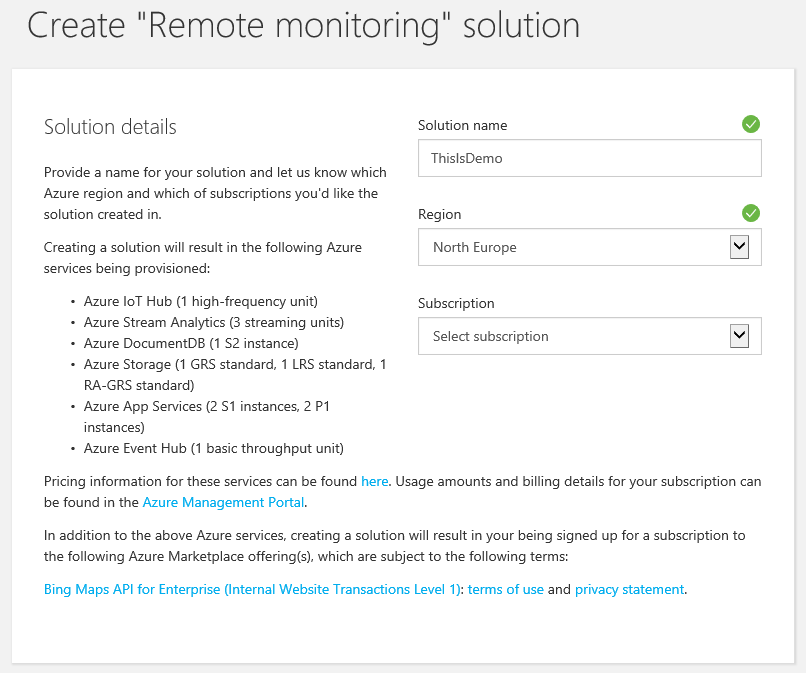
Below is the actual list of what you get by default...
- Azure IoT Hub (1 high-frequency unit)
- Azure Stream Analytics (3 streaming units)
- Azure DocumentDB (1 S2 instance)
- Azure Storage (1 GRS standard, 1 LRS standard, 1 RA-GRS standard)
- Azure App Services (2 S1 instances, 2 P1 instances)
- Azure Event Hub (1 basic throughput unit)
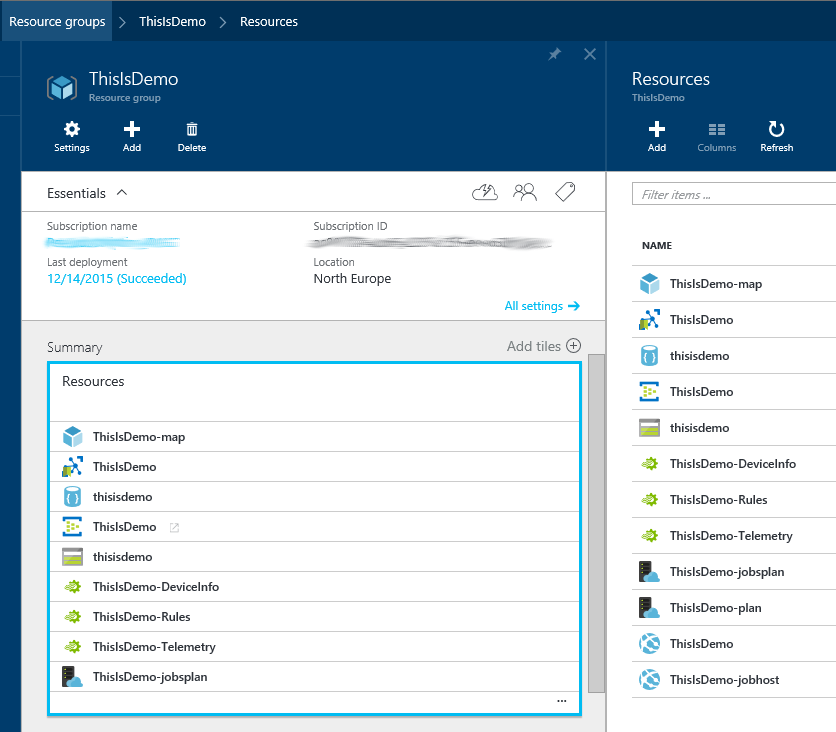
Any resources created in "IoT Suite" will be grouped into a Resource Group named after the solution name you chose at the start of the process. All items of the group can therefore be easily found and maintained using the Azure Portal blades.
Note: The main list does not show everything. You have to click the box header or the "..." to see the full list blade.
IoT Suite Components
I have matched and documented all these resources in this article.
The name of each feature of the solution above is highlighted below in bold and red.
Names of the actual parts or each resource are also highlighted in bold.
Azure IoT Hub
Name: ThisIsDemo
Hostname – ThisIsDemo.azure-devices.net
<Image to come>
This is the "public hub" (as opposed to the "internal" Event Hub detailed below) that devices connect to for data and return commands.
Settings
Shared Access Policies
Five policies are created, below are the main three:
- iothubowner – full permission
- service – service connect permission
- device – Device connect permission
Messaging
- Cloud-to-device (C2D) default TTL – 0
- Device-to-cloud (D2C) default retention – 1 day
- D2C partitions – 4
- Consumer groups – none specific, just default
Pricing & scale
- Default = S2 - standard
- Hub Units = 1
Users
- Subscription admins – The Azure subscription admins and co-admins
DocumentDb
Name: ThisIsDemo-iotsuite
This holds the master-list of registered devices and their differing properties. You can edit these directly in Azure Portal. Each device is a separate record in the database.
Storing "device provisioning" data in DocumentDb means all devices are in one place, but can have their own "schema" of different fields. So each document is device type dependent.
<Image to come>
Below is an example of a device file (document) with a few emboldened points of interest:
|
The "id" on the last line is the actual document name, IoT Suite creates this as a GUID so that every file is unique, even if device names are the same.
Azure Event Hubs
Name: ThisIsDemo-servicebus
Type = Messaging
Two Event Hubs are created beneath the IoT Hub, for splitting the device data into separate streams for active monitoring applications and acting on events. These "sub-hubs" take filtered sub-sets of data, without commands or rules.
This data streams are therefore cleaned up of unrelated data and the multi-traffic complexities of the two-way IoT Hub. This filted data tree structure also means IoT Hub itself is not overloaded with too many clients (listeners).
This solution also means it [critically] remains fast and responsive to the deluge of data. Nothing is lost, ignored, or unresponsive. Queues don't overflow.
Responsiveness is critical on the device/gateway side too, so it isn't locked up on a slow event hub call and missing a change or trigger on it's side.
Events Hub
Name = ThisIsDemo-ehout
This is the hub which monitoring applications connect to, for a live data feed. It is a sub-set of the messages from IoT Hub. Only messages that relate specifically to device data. It is populated from the ThisIsDemo-DeviceInfo Streaming Analytics job.
Rule Alerts Hub
Name = ThisIsDemo-ehruleout
This hub is where device data is copied to, from Streaming Analytics job ThisIsDemo-Rules if it breaks any of the rules, which are defined in the devicerules blob. This provides a tidied and isolated data set, for a scalable number of clients (like web users) to connect to.
Storage
Name: thisisdemo
This is where history data and system configuration files are kept. This shows just one way you can configure your IoT solution. You could for example use SQL for provisioning, or stream your data into Table Storage, which is quick and cheap and has just enough indexing (Partition Key and "compound" RowKey) to analyze for reporting tools.
In this default IoT Suite configuration, Microsoft use Blob Storage, with date-split directories and files defined in the Streaming Analytics "path/pattern" field.
Table Storage
Name = DeviceList
This table holds a list of which devices are to be simulated devices.
It holds the basic information the back end simulator needs to act on behalf of the device.
Columns:
- PartitionKey – Device name
- RowKey - ThisIsDemo.azure-devices.net
- Timestamp – When the device data was created
- Properties
- "Key" - Unique key for the device to authenticate
Name = DeviceRulesNormalizedTable
Columns:
- Partition Key – Device name
- Row Key – A GUID
- Properties
- "DataField" = "Temperature"
- "Enabled" = true
- "RuleOutput" = "AlarmTemp"
- "Threshold" = 38
Blob Storage
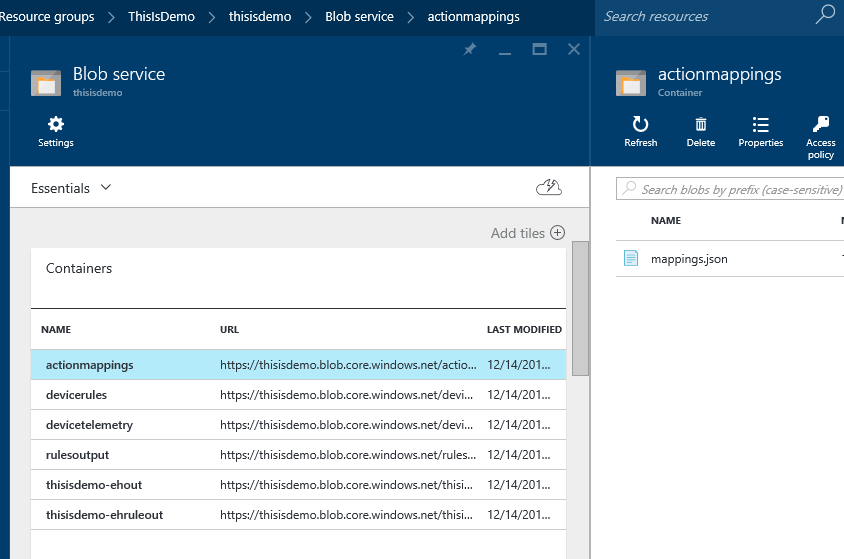
Container: actionmappings
- Defines the rule to action mappings in Mappings.json
Below is the content:
| [{"RuleOutput":"AlarmTemp","ActionId":"Send Message"},{"RuleOutput":"AlarmHumidity","ActionId":"Raise Alarm"}] |
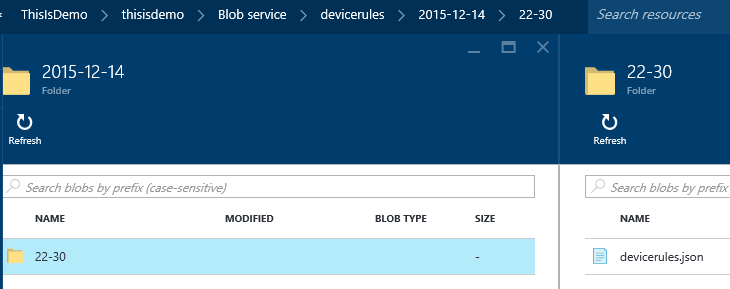
Container: devicerules
- Directory [date] separated files
- Contains json of any device data that breaks the rules
Below is an example of the content:
[{"DeviceId":"SampleDevice001_278","Temperature":38.0,"Humidity":48.0,"TemperatureRuleOutput":"AlarmTemp","HumidityRuleOutput":"AlarmHumidity"},{"DeviceId":"SampleDevice001_510","Temperature":38.0,"Humidity":48.0,"TemperatureRuleOutput":"AlarmTemp","HumidityRuleOutput":"AlarmHumidity"}] |
Note, the value shown above is the limit that breaks the rule.
Container: **devicetelemetry **
- devicetelemetry-summary
Directory [date] separated files
Contains the avg/min/max aggregated data as csv from streaming analytics
Below is an example of the first three rows
| deviceid,averagehumidity,minimumhumidity,maxhumidity,timeframeminutes SampleDevice002_510,30.806544133199651,20.0014513949869,49.867387465139473,5 SampleDevice002_510,30.662442867577607,20.0014513949869,49.867387465139473,5 |
- devicetelemetry
Directory [date] separated files
Contains the raw data in csv format from streaming analytics
Below is an example of the first three rows
| DeviceId,Temperature,Humidity,ExternalTemperature,EventProcessedUtcTime,PartitionId,EventEnqueuedUtcTime SampleDevice002_510,33.544336569190349,25.443365691901725,,2015-10-03T18:00:15.4907064Z,3,2015-10-03T16:58:13.8540000Z SampleDevice001_278,33.955065882557506,29.550658825575642,,2015-10-03T18:00:05.7871002Z,0,2015-10-03T16:58:14.4620000Z |
Container: thisisdemo-ehout
This container contains the config file that Event Hub thisisdemo-ehout uses to configure itself and folders for each consumer (only the default initially), containing status files for each partition (4 by default).
You must not change files in this container. The content is created and changed by Event Hub as each partition is being processed.
<Image to come>
Container: rulesoutput
Directory [date] separated files
Contains the avg/min/max aggregated data as csv from streaming analytics
<Image to come>
Below is an example of the first three rows:
| deviceid,tempreading,tempthreshold,humidityreading,humiditythreshold,temperatureruleoutput,humidityruleoutput,time SampleDevice001_510,35.849473366071265,38,48.494733660712456,48,AlarmTemp,AlarmHumidity,2015-11-01T00:00:07.7290000Z SampleDevice001_278,35.849473366071265,38,48.494733660712456,48,AlarmTemp,AlarmHumidity,2015-11-01T00:00:13.5030000Z |
Stream Analytics
IoT Suite creates three SA jobs that take the data from IoT Hub into three streams of data:
- Device Telemetry – Raw and normalized data stored straight into blob storage
- Device Info – For monitoring clients like the Web App
- Device Rules – Any data that breaks the rules you define in the rules blob file
#1 Name: ThisIsDemo-Telemetry
The input source is your IoT Hub.
This is a two way hub, so first only device ingress data is filtered, using a "WITH" statement to create a subset of traffic in a temporary table.
It then does two things with the remaining data:
- Everything is passed straight into the history storage as raw data (output 1)
- A sliding Window is used to aggregate the average, minimum and maximum values into five minute chunks. This provides a smaller normalized set of values, pre-crunched for quicker analysis. (output 2)
Input = IoT Hub - "IoTHubStream"
Event hub name = ThisIsDemo
Event hub policy name = iothubowner
Event hub consumer group = empty (default)
Event serialization format = JSON
Encoding = UTF-8
WITH
[StreamData]
AS (
SELECT
*
FROM
[IoTHubStream]
WHERE
[ObjectType] IS NULL -- Filter out device info and command responses
)
SELECT
*
INTO
[Telemetry]
FROM
[StreamData]
SELECT
DeviceId,
AVG (Humidity) AS [AverageHumidity],
MIN(Humidity) AS [MinimumHumidity],
MAX(Humidity) AS [MaxHumidity],
5.0 AS TimeframeMinutes
INTO
[TelemetrySummary]
FROM
[StreamData]
WHERE
[Humidity] IS NOT NULL
GROUP BY
DeviceId,
SlidingWindow (mi, 5) |
Output 1 : "Telemetry" :
Storage Account = thisisdemo
Container = DeviceTelemetry
Path/pattern = devicetelemetry/{date}/{time}
Date Format = YYYY/MM/DD
Time Format = HH
Serialization = CSV, Delimiter = comma, Encoding = UTF-8
Output 2 : "TelemetrySummary"
Storage Account = thisisdemo
Container = DeviceTelemetry
Path/pattern = devicetelemetry-summary/{date}/{time}
Date Format = YYYY/MM/DD
Time Format = HH
Serialization = CSV, Delimiter = comma, Encoding = UTF-8
#2 Name: ThisIsDemo-DeviceInfo
The input source is your IoT Hub.
The query simply passes everything that is only device data into a "sub-hub", for other clients like the Web App to consume and monitor.
Input = IoT Hub - "DeviceDataStream"
Event hub name = ThisIsDemo
Event hub policy name = iothubowner
Event hub consumer group = empty (default)
Event serialization format = JSON
Encoding = UTF-8
|
Output – Event Hub : DeviceInfoEvents
Event hub name = ThisIsDemo-ehout
Event hub policy name = RootManageSharedAccessKey
Partition key column = PartitionId
Event serialization format = JSON
Encoding = UTF-8
Format = Array
#3 Name: ThisIsDemo-Rules
The input source is your IoT Hub.
This query takes any device data that breaks any of the rules defined in the devicerules blob.
Two outputs save the data into blob storage for historical analysis, and the rules Event Hub ThisIsDemo-ehruleout for other clients to listen and act upon.
Stream Analytics supports for refreshing reference data using date/time on the blob file name, described here. Each time the rules are changed, we save a new blob with a near-future time stamp so the stream job picks it up dynamically.
Input Reference data – blob storage – "DeviceRulesBlob"
Storage Account = thisisdemo
Container = devicerules
Path/pattern = {date}/{time}/devicerules.json
Date Format = YYYY/MM/DD
Serialization = JSON, Encodeing = UTF-8
Input = IoT Hub - "IotTelemetryStream"
Event hub name = ThisIsDemo
Event hub policy name = iothubowner
Event hub consumer group = empty (default)
Event serialization format = JSON
Encoding = UTF-8
|
Output 1 – Event Hub - "DeviceRulesHub"
Event hub name = ThisIsDemo-ehruleout
Event hub policy name = RootManageSharedAccessKey
Partition key column = PartitionId
Event serialization format = JSON
Encoding = UTF-8
Format = Array
Output 2 – Blob Storage - DeviceRulesMonitoring
Storage Account = thisisdemo
Container = rulesoutput
path/pattern = {date}/{time}
Date Format = YYYY/MM/DD
Time Format = HH
Serialization = CSV, Delimiter = comma, Encoding = UTF-8
App Service Plan
Name: ThisIsDemo-plan
Pricing Tier : Standard - 2 small
Apps & Slots – 1
Lots of useful stats, snapshots, overviews and usage limits
Web App
Name: **ThisIsDemo **
This is the default web app Microsoft provide to monitor your device data.
App Service plan/pricing tier - ThisIsDemo-plan (Standard: 2 Small)
Bing Maps Service
Name: ThisIsDemo-map
Provider = Microsoft.BingMaps
Offer = mapAPIs
Plan = internal1 (FREE)
This service is added to your IoT Solution by IoT Suite to show how well Bing Maps works for such a scenario. You can of course cancel this and replace with whatever you need, like a building floor plan view. However, Bing Maps does provide a lot for free, potentially enough for an internal company system.
"Use up to 10,000 free internal website cumulative transactions of any type, including sessions within any one month period. If you run out, you can upgrade to a paid plan with an increased quota."
"Use up to 500,000 billable internal website cumulative transactions of any type, including sessions within any one month period. Need more than 500,000 transactions per month? Email maplic@microsoft.com for assistance in determining the Bing Maps service and licensing program that’s best for your business."
Deleting Everything IoT Suite Created
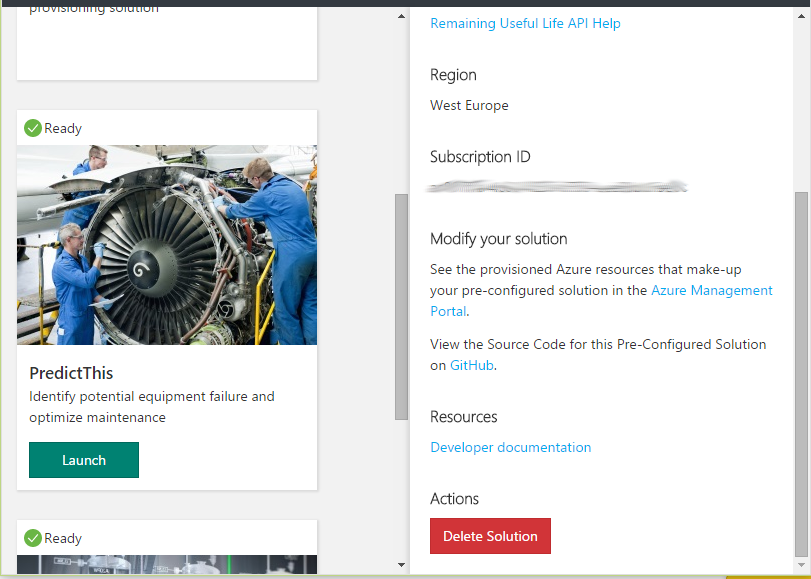
When you want to delete the complete solution, and everything that was created by IoT Suite initially and during the example, you simply have to click the delete solution button, as shown below.
Everything that was created for that specific solution, which is everything in the Resource Group and the AAD service that was created for it is deleted.
You can also delete the Resource Group in Azure Portal, but this will not remove the AAD, as explained here.
See Also
- IoT Suite - Remote Monitoring - Adding Live and Simulated Devices
- What is Azure IoT Hub?
- Azure IoT Suite
- Remote monitoring preconfigured solution walkthrough
Another important place to find an extensive amount of Cortana Intelligence Suite related articles is the TechNet Wiki itself. The best entry point is Cortana Intelligence Suite Resources on the TechNet Wiki.
