Improved Debugging Experience in Visual Studio 2015
Scope
This article demonstrates the improvements in Visual Studio 2015 on the new tools that makes the debugging process easier.
IntelliTrace
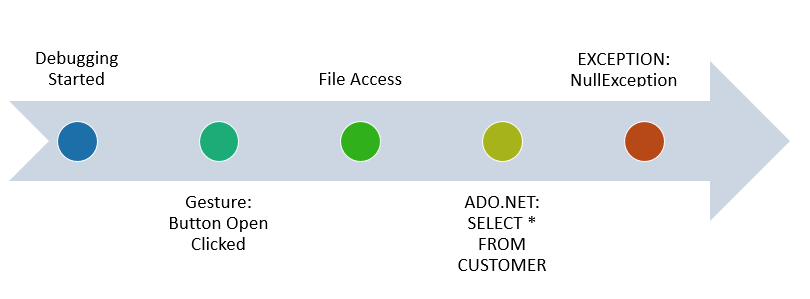
IntelliTrace can be used to record events and method calls to your application that allows you to examine its state (call stack and local variable values) at various points of the execution.
In Visual Studio 2015, the presentation of IntelliTrace has improved considerably. You can view IntelliTrace events just as you start debugging and also now you can view a timeline of all events in your application just as you break all the events.

*IntelliTrace showing a list of all events and at which time they occurred.
*

*The debugger events present all the events that occurred in the application using a timeline.
*
Historical Debugging
Historical Debugging allows you to view the state of your application when the code executes.
To activate historical debugging, double-click on the Diamond icon in the events windows.
New Exception Settings Window
In previous versions of Visual Studio, when you wanted to configure exception settings you would need to go to the modal, slow-opening, hard-to-search Exceptions Dialog.
Press Ctrl + Alt + E to open the Exception Settings Window in the previous versions of Visual Studio.

In Visual Studio 2015, it's just at the bottom-right menu, go to the “Exception Settings” tab that opens instantaneously compared with the previous Visual Studio versions.
You can use the Exception Settings window to specify which exceptions (or sets of exceptions) will cause the debugger to break and at which point you want it to break. You can add or delete exceptions, or specify exceptions to "break" on.
This feature is really handy in applications where all exceptions are caught that makes it difficult to identify which piece of code is causing the error. Thus, by selecting the appropriate exception in the Exceptions Window, this can make the application break and therefore identify which code is causing the error straight away.
Breakpoint Configuration
If you use Visual Studio to develop code, the chances are good that you set breakpoints on a regular basis as part of debugging.
In Visual Studio 2015, it is now easier to find, use and configure breakpoints associated with a specific line of source code.
The first noticeable change is that when hovering on a breakpoint, there is now a small menu that allows you to open the new breakpoint window and a toggle button that allows you to turn a breakpoint on/off.
Breakpoint Settings
The Breakpoint settings shows the following two categories:
- Conditions: Control when the breakpoint is hit. When to break in the code.
- **Actions: **Control what happens when all of the breakpoint conditions are satisfied.
Conditions
There are the following 3 conditions that can be used to allow the code to break:
Conditional Expression: Break only when conditions you specify are met.
Hit Count: Break only after the breakpoint has been hit a certain number of times.
Filter: Break when the breakpoint is hit on a specific thread, process, or machine and are useful for debugging code running in parallel.
Example: Debugging in a loop.
for (int i = 0; i < 5; i++)
{
   Console.WriteLine("Do Stuff");
}
Assume that you need to debug only when I = 2. In this scenario, Hit Count can be used as in the following image:
The preceding condition will make the code break only after it has been executed 3 times, thus, at I = 2.
Actions
Actions print a message to the output window and are capable of automatically resuming execution. These are useful for doing temporary logging when you need to trace something and don't want to have to break and manually track values.
Let's say the name of the person and its occupation needs to be logged only when MaritalStatus is 2.
clubMemberModel.Id = 0;
clubMemberModel.Name = txtName.Text.Trim();
clubMemberModel.DateOfBirth = dtDateOfBirth.Value;
clubMemberModel.Occupation = (int)cmbOccupation.SelectedValue;
clubMemberModel.HealthStatus = (int)cmbHealthStatus.SelectedValue;
clubMemberModel.MaritalStatus = (int)cmbMaritalStatus.SelectedValue;
clubMemberModel.Salary = txtSalary.Text.Trim();
Breakpoints can be configured as in the image below.
Notice that the checkbox Continue execution is checked to allow the application to resume automatically after the logging I completed.
Also, to access variables when logging the messages, they should be written between { }.
Performance Tools
The new set of diagnostics tools are great in helping solve performance issues. The new tools include PerfTips, Memory and CPU usage monitoring.
PerfTips
When debugging, you can view the amount of time each line of code takes to execute. This helps considerably when troubleshooting performance issues and doing optimizations.
The diagnostics not only allows you to monitor events on your application, it also allows you to monitor the CPU and memory usage.
A cool thing is that you can also go into your code line-by-line and view the memory/CPU usage as each line of code executes.
Monitor Change in Memory Usage
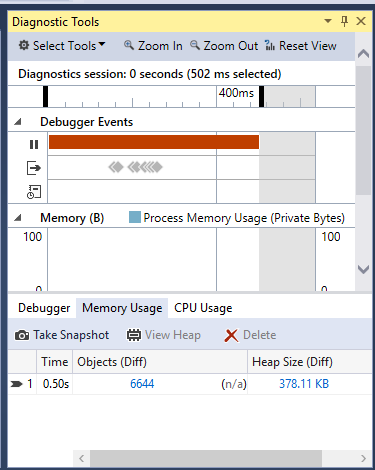
One of the new features is the ability to view the memory usage on a timeline in the diagnostics window when debugging.
But you can also compare the memory usage at 2 points in time using snapshots.
To take a snapshot, go to the Memory Usage tap and click on “take snapshot”.
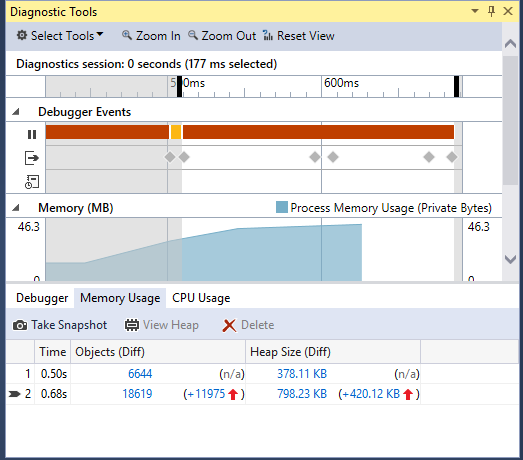
This will show the time the snapshot was taken, the number of objects in memory and also the Heap Size, then you can take another snapshot at a different point of time. For example, after a method that you suspect is using a lot of memory.
The second snapshot was taken after 0.68 seconds and an increase in memory usage is noted.
To view the objects that are in memory, click on the number of increased objects to the left of the Red arrow.
This will show you the count difference of each object in memory and also their difference in size. From here you may also go to the definition of each object to try to identify what is exactly causing the memory leak.
Advanced Diagnostics
To use more diagnostics tools, click on Debug > Start Diagnostics Tools without Debugging.
From here, there is a wider range of tools that can be used, such as CPU and GPU monitoring. Select the one that you need and click on Start.
Once you click on Start, use the application and Visual Studio will record all the necessary information that it needs.
Once you are done, click on Stop and Visual Studio will generate a report of all the events that occurred and the amount of CPU that each of them used.
See Also
Blog Post: Presentation for the Visual Studio 2015 launch in Mauritius


