VB.Net: High resolution printouts of the Chart control by using a Metafile.
If you have ever tried printing a picture of a Windows form, you know that if you try to resize it you will loose quality. That is the nature of the picture, image, or “bitmap”. The image is made from a bitmap of the dots or pixels that make up the image. Thus when we try to resize the image we just end up with larger dots. Like enlarging a newspaper photo in a copy machine.
An alternate to printing a bitmap is to create a Metafile of the image and print that. Metafile is a vector format that can be resized with no loss of resolution.
CAPTURING THE CHART IMAGE AS A METAFILE MEMORY STREAM
As it turns out the Chart control has a special SaveImage method that is exactly what we need to create the memory stream. Furthermore, SaveImage allows us to specify the format type EMF (Enhanced Metafile). Therefore it is a simple matter to create the memory stream that contains the infinite resolution vector data we desire.
   'create the metafile from the chart image
   Dim _stream2 As MemoryStream = Nothing

   Using stream2 As  New MemoryStream()
    Chart1.SaveImage(stream2, ChartImageFormat.Emf)
    _stream2 = New  MemoryStream(stream2.GetBuffer())
SENDING THE METAFILE TO THE PRINTER
After the Metafile is in memory it can be referenced just like a bitmap in the vb DrawImage statement. Vb's DrawImage will draw the Metafile to a bitmap and then copy the bitmap to the graphics device. This is where the vector data of the Metafile allows us to resize the drawing image with no loss of resolution because the image is redrawn to the size bitmap we specify. Thus the bitmap itself is never resized.
    'draw the metafile on the printer page
    Using _metaFile As  Metafile = New  Metafile(_stream2)
        e.Graphics.SmoothingMode = Drawing2D.SmoothingMode.AntiAlias
        e.Graphics.DrawImage(_metaFile, l, t, w, h)
    End Using
FINDING THE EXACT SIZE FOR THE PRINTOUT
When it comes to printing the Chart, half of the challenge is sorting out the exact size of the image on the paper printout. There is the size of the Chart image on the computer screen, the size of paper with margins, and everything in between to deal with. If you get any of the dimensions wrong then you get a blurred image or nothing at all. We need to draw the Metafile on the printer graphic device at the exact size it will print on paper. Then and only then will we get the high resolution we desire.
Notice in the previous code we need to provide the size to draw the Metafile in the DrawImage statement. The variables l, t, w, h represent the left, top, width and height of the printout on the paper. The dimensions have been created so the Chart image maintains its original height to width aspect ration. Finally the image is centered within the printout paper margins.
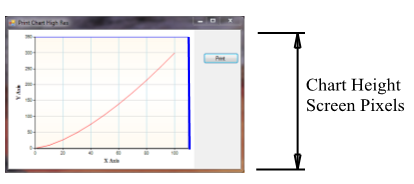
The Chart image on the form.
Our first step in sizing the image is to determine the size of the final printout in printer pixels. In our example we use the default 1 inch margins. So on 8.5” x 11” paper our chart image will be 8.5 – ( 1 + 1) = 6.5” wide. Now the printer prints dots or pixels so we need to convert from inches to pixels. But, these are not screen pixels, they are printer pixels. And on the printer the pixels are much smaller. We can get the pixel or dot size ratio for the printer from the printer graphics object that is passed to the print page sub routine using the .Dpi property. One other detail, the margins are in hundredths of an inch by default so we will need to divide the dpi by 100. Now we can multiply the dpi/100 by the marginwidth and get the size in printer pixels. This is the size the chart image will be on the paper.
'convert from 100ths of inch to pixels
e.Graphics.PageUnit = GraphicsUnit.Pixel
Dim xf As Single  = e.Graphics.DpiX / 100
Dim yf As Single  = e.Graphics.DpiY / 100

'printed page margin sizes
Dim marginwidth As Integer  = CInt(e.MarginBounds.Width * xf)
Dim marginheight As Integer  = CInt(e.MarginBounds.Height * yf)
To determine the original chart image aspect ratio, we simply divide the Chart clientsize width by its height. Now we can use that same height to width ratio for our printout.

The printed page layout with the Chart.
Finally, we fit the Chart to the inside margins by comparing the original image ratio to the ratio of the printout. We choose the maximum size by fitting either the height or the width to the margins depending the size of the original.
'size the printed chart to the page margins mantaining chart aspect and centered on the page
Dim chartAspectRatio As Single  = CSng(Chart1.ClientSize.Width / Chart1.ClientSize.Height)
If chartAspectRatio > marginwidth / marginheight  Then
    w = marginwidth
    h = CInt(w / chartAspectRatio)
    t = CInt((e.MarginBounds.Top * yf) + CInt((marginheight / 2 - (h / 2))))
    l = CInt(e.MarginBounds.Left * xf)
Else
    h = marginheight
    w = CInt(h * chartAspectRatio)
    t = CInt(e.MarginBounds.Top * yf)
    l = CInt((e.MarginBounds.Left * xf) + CInt((marginwidth / 2) - (w / 2)))
End If
Here is the final high resolution printout as shown in a PDF (reduced). If you wish to change the size or position of the Chart on the page you can easily adjust the l, t, w, and h variables.
Example Printout.
THE EXAMPLE VB.NET PROJECT CODE
Here is the complete project that will capture the Chart image and print it high resolution using a metafile. To recreate the project you need to have a reference to System.Windows.Forms.DataVisualization. The controls are created by the code so you just insert the code into an empty form, run, and click the print button for the print preview. To print click the print button on the print preview.
The example first calls a routine to draw the Chart. Then the Button Click event calls the PrintPage routine where the Chart is captured and printed as shown.
'print chart control image in high resolution using metafile
Option Strict On
Imports System.Drawing.Imaging
Imports System.Windows.Forms.DataVisualization.Charting
Imports System.IO
Imports System.Runtime.InteropServices
Imports System.Drawing.Printing
Public Class PrintChartMetafileHiRes
Private WithEvents PrintDocument1 As PrintDocument = New PrintDocument
Private PrintPreviewDialog1 As New PrintPreviewDialog
Private Chart1 As Chart
Private WithEvents Button1 As Button
Private Sub Form1_Load(sender As System.Object, e As System.EventArgs) Handles MyBase.Load
'create the chart and button controls
Dim ChartArea1 As System.Windows.Forms.DataVisualization.Charting.ChartArea = New System.Windows.Forms.DataVisualization.Charting.ChartArea()
Dim Series1 As System.Windows.Forms.DataVisualization.Charting.Series = New System.Windows.Forms.DataVisualization.Charting.Series()
Chart1 = New System.Windows.Forms.DataVisualization.Charting.Chart()
ChartArea1.Name = "ChartArea1"
Chart1.ChartAreas.Add(ChartArea1)
Chart1.Series.Add(Series1)
Chart1.Size = New System.Drawing.Size(400, 300)
Chart1.Text = "Chart1"
Button1 = New System.Windows.Forms.Button()
Button1.Location = New System.Drawing.Point(420, 50)
Button1.Text = "Print"
Me.ClientSize = New System.Drawing.Size(500, 300)
Me.Controls.Add(Me.Button1)
Me.Controls.Add(Me.Chart1)
Me.Text = "Print Chart High Res"
DrawChart(Chart1)
End Sub
Private Sub Button1_Click(sender As System.Object, e As System.EventArgs) Handles Button1.Click
'call the print preview dialog
'select the print button on the print preview dialog to print the chart
Try
PrintPreviewDialog1.Document = PrintDocument1
PrintPreviewDialog1.ShowDialog()
Catch ex As Exception
MsgBox(ex.ToString)
End Try
End Sub
Private Sub PrintDocument1_PrintPage(sender As System.Object, e As System.Drawing.Printing.PrintPageEventArgs) Handles PrintDocument1.PrintPage
'draw the preview or printer page
'convert from 100ths of inch to pixels
e.Graphics.PageUnit = GraphicsUnit.Pixel
Dim xf As Single = e.Graphics.DpiX / 100
Dim yf As Single = e.Graphics.DpiY / 100
'printed page margin sizes
Dim marginwidth As Integer = CInt(e.MarginBounds.Width * xf)
Dim marginheight As Integer = CInt(e.MarginBounds.Height * yf)
Dim l, t, w, h As Integer
'size the printed chart to the page margins mantaining chart aspect and centered on the page
Dim chartAspectRatio As Single = CSng(Chart1.ClientSize.Width / Chart1.ClientSize.Height)
If chartAspectRatio > marginwidth / marginheight Then
w = marginwidth
h = CInt(w / chartAspectRatio)
t = CInt((e.MarginBounds.Top * yf) + CInt((marginheight / 2 - (h / 2))))
l = CInt(e.MarginBounds.Left * xf)
Else
h = marginheight
w = CInt(h * chartAspectRatio)
t = CInt(e.MarginBounds.Top * yf)
l = CInt((e.MarginBounds.Left * xf) + CInt((marginwidth / 2) - (w / 2)))
End If
'create the metafile from the chart image
Dim _stream2 As MemoryStream = Nothing
Using stream2 As New MemoryStream()
Chart1.SaveImage(stream2, ChartImageFormat.Emf)
_stream2 = New MemoryStream(stream2.GetBuffer())
'draw the metafile on the printer page
Using _metaFile As Metafile = New Metafile(_stream2)
e.Graphics.SmoothingMode = Drawing2D.SmoothingMode.AntiAlias
e.Graphics.DrawImage(_metaFile, l, t, w, h)
End Using
End Using
End Sub
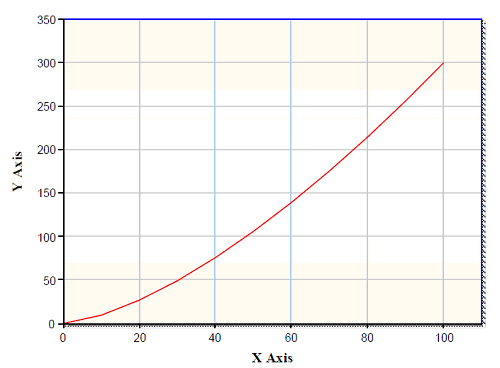
Private Sub DrawChart(theChart As Chart)
Dim theFontsizex As Integer = CInt(theChart.ClientSize.Width / 60)
'setup the chart
With theChart.ChartAreas(0)
.AxisX.Title = "X Axis"
.AxisX.TitleFont = New Font("Times New Roman", CInt(theFontsizex * 1.2), FontStyle.Bold)
.AxisX.MajorGrid.LineColor = Color.LightBlue
.AxisX.Minimum = 0
.AxisX.Interval = 20
.AxisX.LabelStyle.Font = New Font("Arial", theFontsizex)
.AxisX.IsLabelAutoFit = False
.AxisY.Title = "Y Axis"
.AxisY.TitleFont = New Font("Times New Roman", CInt(theFontsizex * 1.2), FontStyle.Bold)
.AxisY.MajorGrid.LineColor = Color.LightGray
.AxisY.Minimum = 0
.AxisY.LabelStyle.Font = New Font("Arial", theFontsizex)
.AxisY.IsLabelAutoFit = False
.BackColor = Color.FloralWhite 'AntiqueWhite 'LightSkyBlue
.BackSecondaryColor = Color.White
.BackGradientStyle = GradientStyle.HorizontalCenter
.BorderColor = Color.Blue
.BorderDashStyle = ChartDashStyle.Solid
.BorderWidth = 1
.ShadowOffset = 2
End With
'draw the chart
theChart.Series.Clear()
theChart.Series.Add("Y = f(x)")
With theChart.Series(0)
.ChartType = DataVisualization.Charting.SeriesChartType.Line
.BorderWidth = CInt(theChart.ClientSize.Width / 400)
.Color = Color.Red
.IsVisibleInLegend = False
Dim y As Single
For x = 0 To 100 Step 10
y = CSng(0.3 * x ^ 1.5)
.Points.AddXY(x, y)
Next
End With
End Sub
End Class
ADDITIONAL CONTRIBUTORS
In this thread on the vb.net forum, Jeffery and Thorsten helped develop this method to capture the Chart image as a Metafile.