System Center Management Pack for Windows Azure Fabric (October 2014 release)
The System Center Management Pack for Windows Azure Fabric lets you instrument your Azure investments for availability and performance monitoring and reporting using SCOM. The Azure Fabric management pack discovers PaaS and IaaS (Platform and Infrastructure as a Service) components of your Azure subscription(s) and communicates directly with an Azure web service to deliver cloud-based management data to your SCOM.
In other words, you are getting data from an outside-in perspective via the Azure management pack, that you can combine with the inside view you are getting from the management pack workloads of your existing SCOM agents. Essentially, after you have deployed SCOM agents inside your Azure VMs, then discovered those Azure VM instances for monitoring by the Azure Fabric management pack, you will have in SCOM objects that represent inside and outside perspectives of your cloud-hosted VMs.
Figure 1 shows a monitor you can author following the guidance in this article. The top level object represents a business service that requires two VMs to be running. If something goes wrong with this service, the diagram will quickly isolate the fault to one or the other VM, and whether it’s the VM OS, the Azure VM Service, or the shared Azure Storage that is having the issue.
[
Figure 1 - This distributed application models a business service that depends on two Azure VMs that share Azure Storage.
](resources/2867.Figure_2D00_1_2D00_DAD_2D00_Two_2D00_VM_2D00_One_2D00_Storage.jpg)This article will cover installing the System Center Management Pack for Windows Azure Fabric and configuring it to discover and deliver data from Azure about your selected Azure services and components. Also we’ll look at creating dashboards and distributed applications in SCOM that include objects from hybrid cloud environments and combining them to create meaningful management tools.
Management Pack Installation
- Import the management pack into your SCOM 2012 or SCOM 2012 R2 instance. The management pack won’t import to a SCOM 2007 R2 or previous version instance. You can’t import the October 2014 System Center Management Pack for Windows Azure Fabric from the online management pack catalog, you need to download the management pack from this URL, then import the downloaded files:
http://www.microsoft.com/en-us/download/details.aspx?id=38414
2. After you download and run the System Center Management Pack for Windows Azure.msi file, you will see the familiar management pack installer. The default location to install the management pack files is C:\Program Files (x86)\System Center Management Packs\System Center Management Pack for Windows Azure\ Two management pack bundle (MPB) files will be located there, also seen in Figure 2:
- Microsoft.SystemCenter.WindowsAzure.mpb
- Microsoft.SystemCenter.WindowsAzure.SLA.mpb
Figure 2 - Importing the Azure management packs in the SCOM console Administration space.
Management Pack Configuration: Azure Subscription
- You will immediately notice in the lower portion of the Administration space in SCOM a new item: Windows Azure. The management pack actually extends the UI of the SCOM console to include the new cloud monitoring feature. From here you will configure your SCOM instance with your Azure subscription(s). Click on Add subscription as shown in Figure 3.
Figure 3 - The Windows Azure feature is added to the SCOM Administration space.
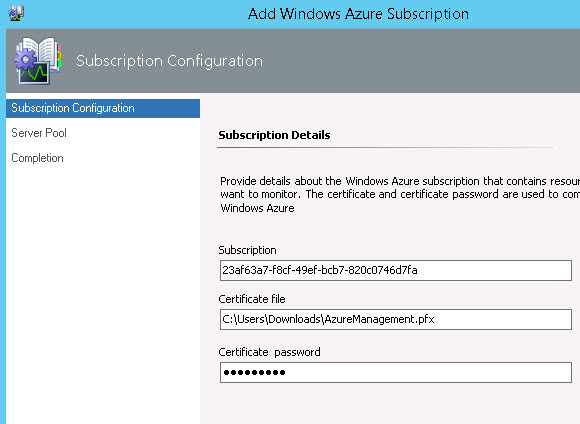
- To complete the connection to your subscription, you will need to provide this information:
The Subscription name, which is a GUID. You’ll find this 25-character identifier in your Azure portal in the Settings -> Subscriptions -> Subscription ID column.
A certificate file with private key in PFX format you can upload.
The thumbprint of the certificate you upload must be present in the Thumbprint column of the Settings -> Management Certificates in your Azure portal.
If you don’t have possession of a certificate already listed in the portal, you can create a new one and upload the CER file to Azure. Use the Upload button on the Management Certificates page.
If you need to create a new certificate, follow the steps at this link to Create and Upload a Management Certificate for Azure:
The password to the PFX certificate file.
Figure 4 shows what this page looks like when you are ready to proceed:
Figure 4 - Completing the configuration for an Azure subscription to be monitored by SCOM.
5. You will next select a management server pool to communicate with Azure and tell SCOM of any web proxy servers involved. (See Figure 5)
- If you have only one SCOM management server, select the default to use the All Management Servers Resource Pool.
- If you have multiple SCOM management servers or gateways in your management group, you may select an existing resource pool.
- Alternately, you can create a new resource pool if indicated by your unique environment. If you need to make a new pool, you must exit the Add Subscription wizard at this point. Create the new pool, and then restart the Add Subscription wizard.
- Also specify on this page if the server(s) communicating with Azure are behind a web proxy and if so specify the URL of the network proxy server.
Figure 5 - Specify the management server resource pool and proxy configurations.
6. Push the Add Subscription button, and you have completed the first half of the basic setup of the management pack. In a moment, you will see the message The Windows Azure Subscription Wizard completed successfully, and confirmation of the GUID of the subscription you just added to SCOM.
Management Pack Configuration: Resources in an Azure Subscription
You can now configure monitoring for resources contained in the subscription, the second part of the basic management pack setup. Navigate to the Authoring space of the SCOM console and locate the Management Pack template: Windows Azure Monitoring.
Launch the Add Monitoring Wizard and select the Windows Azure Monitoring type. Name the collection of monitored resources and save the monitoring configuration to a new management pack as shown in Figure 6:
Figure 6 - Naming the selection list of monitored Azure resources.
You are next presented with a drop-down box where you can select which subscription to select objects from (if you have two or more Azure subscriptions added to your SCOM management group).
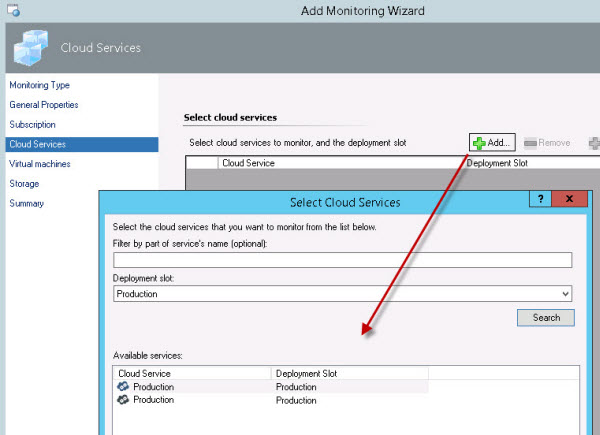
After confirming the correct subscription, you are presented with a blank Select Cloud Services page with a green Add button at the top. Push the Add button to browse the Cloud Services (PaaS) resources in the Azure subscription as shown in Figure 7:
Figure 7 - Select some or all of the cloud services in your Azure subscription to monitor in SCOM.
The next page in the Add Monitoring Wizard lets you select the Virtual machines in the Azure subscription to monitor. Push the Add button and browse to select the name(s) of the Azure VMs to monitor. Press next to continue.
Finally, the Add Monitoring Wizard lets you select the Storage accounts in the Azure subscription to monitor. Push the Add button and browse to select the name(s) of the Azure Storage Account(s) to monitor. Press next to continue.
At the Summary page, confirm the settings and push the Create button.
Management Pack Configuration: RunAs Profiles and Configuration
The addition of the Azure subscription to SCOM with the Add Monitoring Wizard takes care of storing the security credentials used by the management pack. As seen in Figure 8, there are three (3) RunAs account types created by importing the management pack:
Figure 8 - RunAs security profiles created by the Azure Fabric management pack.
The default source (user perspective) for Azure subscription monitoring is the All Management Servers Resource Pool. That is where the Azure web service is contacted by the management pack (the ‘probe source’) to get data about your subscription and to transmit task commands to Azure.
In a default SCOM setup and in an environment with two or more management servers in the All Management Servers Resource Pool, this makes Azure subscription monitoring highly available. Azure Run As profile credentials are automatically distributed to the All Management Servers Resource Pool.
- There is normally no need to modify or access these RunAs profiles directly, they are automatically created by the Add Azure Subscription wizard. If you are using non-default monitoring pools, you may need to manually distribute credentials to servers not in the All Management Servers Resource Pool.
- An exception is if you specified to use a proxy server (Step 5 and Figure 5 in this article) to monitor your Azure subscription. In that case and only if required, add the credential to use the proxy server to the Windows Azure Run As Profile Proxy profile.
There is no additional configuration of the management pack for core functionality. All Azure discoveries are enabled by default.
Return to the Administration node for Windows Azure to the SCOM console (shown in Figure 3) to add another subscription, edit the certificate or proxy settings of an existing subscription, or remove SCOM monitoring of Azure.
Using the Management Pack: Alerts
Steps 1-13 in this article configured SCOM to connect to Azure, and then picked which Azure resources to monitor with SCOM. This default configuration will deliver a lot of ‘out of the box’ functionality. You may quickly receive an Alert raised by the management pack, for example:
- If there are any irregularities with the Azure subscription, such as invalid management certificates (shown in Figure 9)
- An Azure storage account is found to have exceeded a capacity threshold.
Figure 9- An alert from the Azure management pack about the health of the subscription.
TIP
You may receive an alert if a monitored Azure storage account exceeds 1-GB in size; this is the default threshold of the management pack for storage accounts. You should set this to some number (in the form of an Override) that might alert you to unexpected growth in storage consumption. At the time of this blog post, the actual Azure storage limit per subscription is 500-TB. Accordingly, consider overriding the Windows Azure Cloud Storage Size Monitor to 400-TB or more if you don’t otherwise care about an alert.
Using the Management Pack: State Views
The management pack has a couple of alert and dashboard views at the top of the view folder and then branches to Inventoried resources and Monitored resources. Figure 10 shows a collapsed view of the Monitoring navigation pane focused on the Azure management pack.
Figure 10 - Monitoring view folders of the management pack: Inventory vs. Monitored Resources
The only difference between the “Inventory” and the “Monitored” views is that the inventory views contain both monitored and unmonitored Azure resources. Periodically browse the inventory views to see new resources you want to monitor, and then add them to monitoring by returning to the Authoring space and selecting Properties at the Management Pack Templates -> Windows Azure Monitoring node as shown in Figure 11.
Figure 11 - Add or Remove monitored VMs, services, and web sites in the Authoring space.
TIP
The Discovered Sql Azure Instances view in the Other Azure Inventory folder will list as Unmonitored any SQL Azure instances discovered in your subscription(s). Other than discover the SQL Azure server name, no monitoring is performed and SQL Azure database names are not discovered by the management pack. The unmonitored SQL Azure server objects are used to populate the Service Topology diagram view.
Using the Management Pack: Tasks
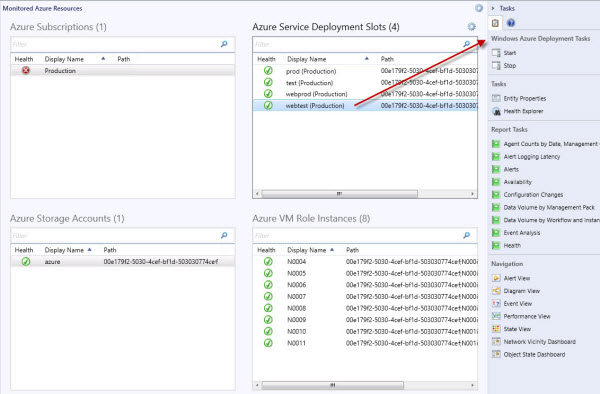
An advanced integration feature of the management pack is that certain key Azure tasks related to Azure resources can be performed from the SCOM console using in-line/context-sensitive SCOM tasks. Depending on the state view and object selected, tasks (as shown in Figure 12) will appear in the right side Task pane of the console appropriate for that Azure object.
Figure 12 - Composite image of the tasks available across the various state views.
For example, when you select an Azure VM instance, the tasks to Reboot or Reimage the Windows Azure Role Instance are available. Using tasks, you can dynamically scale up or down the number of role instances in an Azure service, start or stop service deployments, and swap production and staging deployment slots for a service.
Service Topology View
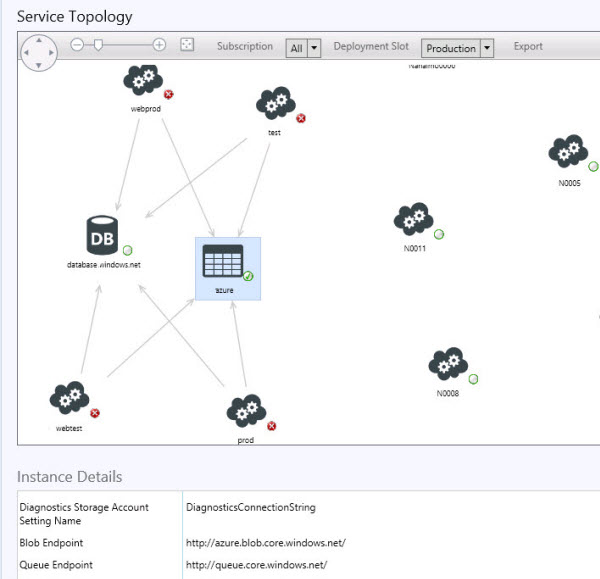
An interesting feature of the management pack is the Service Topology View shown in Figure 13. You can specify the subscription (if you have more than one added to your SCOM instance) and toggle between Production and Staging slots using the controls at the top of the dashboard.
Figure 13 - Service Topology dashboard view diagrams Azure services.
As Figure 13 shows on the left, an Azure service consisting of web sites using SQL Azure and Azure storage will have accurate ‘topology connector arrows’ created by the management pack to indicate dependencies. On the right of Figure 13, notice individual Azure VM instances in infrastructure roles will appear as unconnected objects.
Selecting the object of interest in the diagram will populate the Instance Details at the bottom with lots of useful information about the object. For example (as shown) an Azure storage instance is selected, and in the details area the URLs to the blob, queue, and table endpoints for that service are listed.
Custom Dashboard Views
A great feature of SCOM 2012 is the ability to quickly put together a dashboard view that shows just the information you need, in a single glance. Figure 14 is an example of a simple dashboard of the grid type (this one with 4 equal squares) with each grid occupied with a State widget that is meaningful to the organization.
Figure 14 - A custom dashboard (grid type shown) displays just the views of interest to your organization.
Notice in Figure 14 that the context-sensitive tasks for the various Azure objects (in state views) appear also in the Tasks area of a custom dashboard. Imagine you can author simple but all-inclusive dashboards that allow operators to monitor, scale, swap, start and stop Azure services without ever logging into the Azure portal.
Azure in the Distributed Application Designer
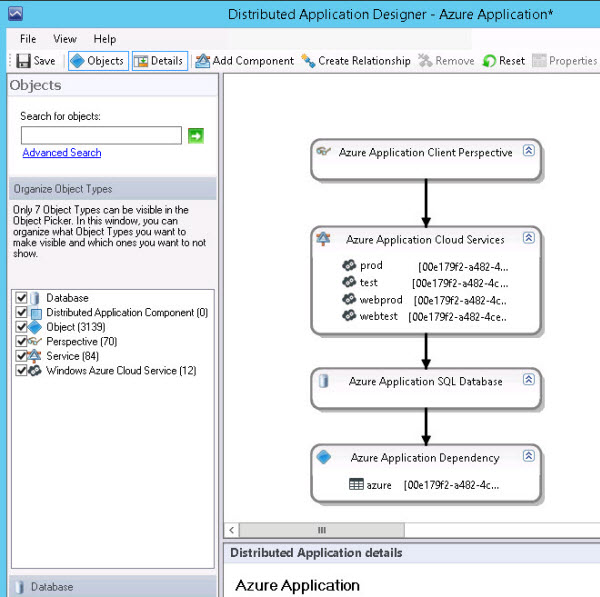
Importing the Azure management pack further extends the SCOM console with a template for an Azure Distributed Application. To create a distributed application that represents a custom view of your organization’s application(s), navigate to Authoring -> Management Pack templates -> Distributed Applications and run the Create a New Distributed Application task.
Figure 15 shows the four default components created by the template: A client perspective (Proxy) -> watching Azure Cloud Services -> that depends on Azure databases -> that depends on other applications. Consider the template a starting point to create your own custom monitoring solutions.
Figure 15 - The Azure Application Distributed Application template.
Monitoring Guest VM Performance
The Azure management pack provides status from an Azure fabric (datacenter) point of view. It does not monitor end-to-end transactions, or the health of Azure databases and other Azure components that are not subscriptions, services, role instances, or storage accounts.
The solution: Deploy SCOM agents inside Azure-hosted Windows and Linux VMs from the same SCOM management group running the Azure management pack. This will let you combine in-guest and Azure fabric monitors in the same monitoring views—actually achieve the ‘single pane of glass’ everyone seeks as a monitoring ideal.
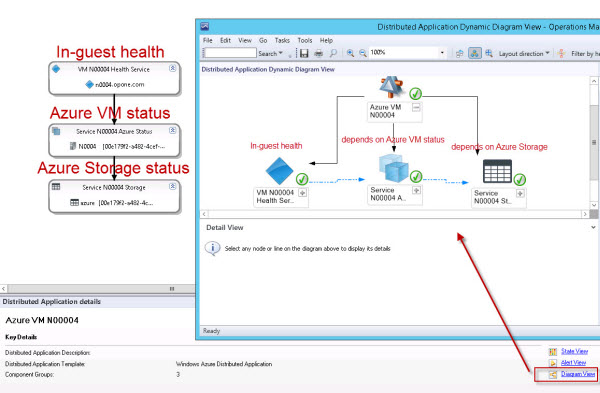
Figure 16 shows this idea in action. This is a distributed application designed to leverage the visualization of the diagram to convey fault-isolation information. The key helpers here are the dashed blue lines that represent dependencies between components in the application.
Figure 16 - A custom Distributed Application helps in fault isolation by showing dependencies.
The diagram in Figure 16, the SCOM Distributed Application Designer with a dynamic diagram view displayed, maps this status about a VM in Azure:
- At the top, a component that rolls up the health of all contained components. When this is ‘green’, all objects of interest are ‘green’.
- On the left, a component containing the SCOM agent health service of the VM, essentially a ‘heartbeat’ for the in-guest operating system (OS).
- The VM’s OS is dependent on the Azure VM role the VM is running under (center of diagram).
- The Azure VM role is dependent on the Azure storage (diagram right side) where the VHD files are located.
The concept is that if a problem is detected, the fault can be isolated to the VM’s OS, the Azure VM role, or Azure storage. This problem identification is visual and instantaneous. By thoughtfully authoring distributed application models for the most common failure scenarios, front-line triage of outage situations can be dramatically accelerated.
TIP
The default folders installed by the management pack (lower right side of Figure 10) include a performance view folder with views such as Disk Capacity and Memory Performance. Data about infrastructure VMs will not appear here.
- These folders are for data from role instances deployed as part of PaaS services such as worker roles or VM roles deployed by uploading a service definition file to Azure—which are then further enabled for Azure Diagnostics through a rather complex procedure.
- Consult these references about instrumenting Azure services for diagnostics:
- Implementing Windows Azure Diagnostics (http://go.microsoft.com/fwlink/?LinkId=186765)
- Store and View Diagnostic Data in Azure Storage (http://msdn.microsoft.com/en-us/library/azure/hh411534.aspx)
Expanding the scope of the distributed application in Figure 16 to include two VMs that share the same Azure Storage account brings us to the diagram at the beginning of this article (Figure 1). In that diagram the top level object could represent a business service that requires that two independent Azure VM services are running.
Summary
Most public cloud environments (like most hybrid cloud, private cloud and on-premises datacenters) include many interdependent components. For example, the two-VM solution in Figure 1 might include dependencies on an Azure Site to Site VPN and an Active Directory (AD) Domain Controller (DC) on-premises. Discovering the on-premises VPN router and the AD DC from the same SCOM management group would let you extend the distributed application monitor with those components as well.
Your goal is high fidelity in the design of the distributed application (DA) by considering all actionable failure components are mapped out. Put a sensor where you need to watch and build that into the DA. It's all about speeding the detection and understanding of service-impacting events.
In sum, out of the box the Azure management pack provides very useful, live state and alert information from the Azure public cloud perspective. The highest value from using SCOM -- as your monitoring solution in the hybrid cloud environment -- can be achieved by discovering relevant cloud and on-premises components, then using custom dashboards and distributed applications that model your specific business dependencies.


