Power Pivot DAX: SUMX - Application on Price and Quantity Effect Analysis
Calculation logic of SUMX
SUMX is a very interesting DAX that can solve some very interesting questions. In this post, I would like to discuss one of its typical use:
=SUMX(Values(Column),Expression)
Let’s first use an example in normal Excel to see how its logic works and how it influences the calculation of the “Expression”.
See the difference? For each product, results of “price” and “SUMX price” are exactly the same. But on the total level, they apply two different logics.
Price: (sum of all Sales) / (sum of all Qty)
SUMX price: (Sales of A)/(Qty of A)+ (Sales of B)/(Qty of B)+ (Sales of C)/(Qty of C)
If in PowerPivot, the DAX will be
Price:= sum[sales]/sum[Qty]
SUMX Price:=SUMX(VALUES(Data[Product]),[Price])
So the logic of “SUMX(Values(column),Expression) “ is to calculate the expression of each value of the column and then sum them up.
Useful Application of SUMX: Price and Quantity effect analysis
I think most of people would give up SUMX after they see such a useless “average price” example, as certainly SUMX gives a totally wrong result. I also gave it up before, but recently I find some very interesting application of SUMX and I would like to say it is now my most favorable DAX!
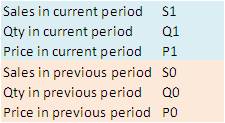
This is a typical variance analysis of management accounting. Let’s first define some values for easier reading.
Values:
Formulas of price and quantity effects
Q effect:= P0*(Q1-Q0)
P effect:= (P1-P0)*Q1
Q effect + P effect:= P1*Q1 – P0*Q0 = S1 – S0 (Sales growth)
After understanding SUMX calculating logic, I think now you have realized how SUMX can be applied here, right?
The key question is that we can’t use the total average price and total quantity to calculate the total Q and P effect. For example:
Both Q effect (not SUMX) and Q effect (SUMX) return the same result on product level. While for the total, Q effect (not SUMX) clearly returns a wrong and misleading result, because it uses the total average price and total quantity to make the calculation.
Understanding the logics, now we can construct PowerPivot workbook for this calculation.
We need 3 sheets, Data, Date, and Product.
S1:= sum(data[sales])
Q1:= sum(data[Qty])
P1:= [S1]/[Q1]
S0:=calculate([S1],DATEADD(Date[Datekey],-1,year))
Q0:=calculate([Q1],DATEADD(Date[Datekey],-1,year))
P0:=[S0]/[Q0]
Sales Growth:= [S1] – [S0]
Q effect:= SUMX(VALUES(Product[Product]),[P0]*([Q1]-[Q0]))
P effect:= [Sales Growth] – [Q effect]
**
**
Please be aware of some points.
1) 1. DATEADD can’t apply for a discrete date column. So just always prepare a date sheet and create relationship with your data sheet.
2) 2. VALUES(Product[Product]), please always refer to the product sheet, ensuring that all products are considered. If you don’t, there may be some problems


