SCOM: How Self-Tuning Threshold Baseline is Computed
Self-tuning thresholds use simple mathematics to let the user determine how often they would like to be alerted to changes in a particular counter.
- How to Build a Baseline
- Initial Baseline Values
Assuming the counter follows a normal distribution, depending upon the sensitivity parameter chosen will cut off the bell curve shown above symmetrically around the mean at an offset of sensitivity parameter. As long as the counter values belong to this region i.e. the non cut off region, we say it falls within the expected region and if it falls outside this region, we alert saying it digresses from mean outside the expected variance.
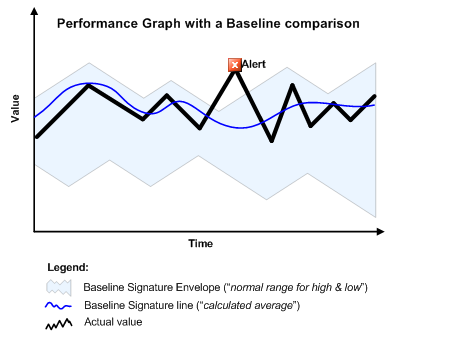
In the graph above the “actual value” is the current value for a particular counter. The baseline signature is a moving average and standard deviation computed over time. The baseline signature envelope is a value which if the performance counter exceeds raises an alert.
The sensitivity setting lets you choose the baseline range for your counter. If the sensitivity is low then users get alerts for a counter that’s has had a drastic change from the previous set baseline. Low sensitivity also generates fewer alerts as a result of this. Sensitivity settings determine when the monitor considers a value to be outside normal behavior. In the UI for the monitor, five sensitivity settings are shown that correspond to the following numeric values: 4.01 (low), 3.77, 3.29 (middle), 2.81, 2.57 (high). These numbers are used as scaling factors of sigma. Sigma is the standard deviation of the sample values. The smaller the scaling factor for the sigma, the possibility of having sample values outside of the valid value range gets bigger. For that reason, higher sensitivity setting number is smaller than lower sensitivity number. For normally distributed data, for various values of z (scaling factor), the percentage of values expected to lie in the (−zσ,zσ) interval are as follows:
| 1σ | 68.27% |
| 1.645σ | 90% |
| 1.960σ | 95% |
| 2σ | 95.450% |
| 2.576σ | 99% |
| 3σ | 99.7300% |
| 3.2906σ | 99.9% |
| 4σ | 99.993666% |
| 5σ | 99.99994267% |
| 6σ | 99.9999998027% |
| 7σ | 99.9999999997440% |
According to the above table, if you select 2.57 (High sensitivity), 1% of the sample values will result in an alert. In our case, the scaling factor values that we expose in the UI range from 2.57 to 4.01.
