How to Configure FIM Portal Tracing
In the FIM 2010 architecture, the FIM Portal represents the user interface you use to configure your FIM environment. The FIM Portal is implemented as Windows SharePoint Services application and is accessible by using a web browser such as Internet Explorer.
To understand how your application behaves or why it faults, you can use tracing instead of a debugger. For example, when you need to troubleshoot your RCDC configuration, enabling FIM portal tracing provides a method to gather more details about the nature of your issue.
The objective of this article is to give you an overview of how you can configure FIM Portal tracing in your FIM environment.
Configuring FIM Portal Tracing
To configure FIM portal tracing, you need update the configuration file called Web.config that is typically located in the following folder:
| C:\inetpub\wwwroot\wss\VirtualDirectories\80 |
Note
Before you update the Web.config file, you should take a backup of the original file.
The tracing configuration is stored under the <system.diagnostics> element you need to add to your configuration file.
The following screenshot shows an example for this:

When you configure FIM Portal tracing, you can defie trace listeners to consume the related information and the trace level. Examples for listeners are an XmlWriterTraceListener to write the related information into a XML file or the EventLogTraceListener to write the related information into one of the Event Viewer’s log files.
Depending on how much information you need, you can fine-tune the level of information that is stored. For example, you can configure tracing to only log errors.
Note
For more details about the options you have to configure tracing, see Configuring Tracing in the MSDN.
The following XML code shows an example for the required settings to write FIM Portal tracing information into a files that are located in the C:\Logs folder on your hard drive:
<system.diagnostics>
  <sources>
    <source name="System.ServiceModel.MessageLogging" switchValue="Verbose,ActivityTracing">
      <listeners>
        <add type="System.Diagnostics.DefaultTraceListener" name="Default">
          <filter type="" />
        </add>
        <add name="ServiceModelMessageLoggingListener">
          <filter type="" />
        </add>
      </listeners>
    </source>
    <source name="System.ServiceModel" switchValue="Verbose,ActivityTracing"
      propagateActivity="true">
      <listeners>
        <add type="System.Diagnostics.DefaultTraceListener" name="Default">
          <filter type="" />
        </add>
        <add name="ServiceModelTraceListener">
          <filter type="" />
        </add>
      </listeners>
    </source>
    <source name="Microsoft.ResourceManagement" switchValue="Verbose,ActivityTracing">
      <listeners>
        <add type="System.Diagnostics.DefaultTraceListener" name="Default">
          <filter type="" />
        </add>
        <add name="ServiceModelTraceListener">
          <filter type="" />
        </add>
      </listeners>
    </source>
  </sources>
  <sharedListeners>
    <add initializeData="C:\Logs\FIMPortal.Client_messages.svclog"
      type="System.Diagnostics.XmlWriterTraceListener, System, Version=2.0.0.0, Culture=neutral, PublicKeyToken=b77a5c561934e089"
      name="ServiceModelMessageLoggingListener" traceOutputOptions="LogicalOperationStack, DateTime, Timestamp, ProcessId, ThreadId, Callstack">
      <filter type="" />
    </add>
    <add initializeData="C:\Logs\ILMPortal.Client_tracelog.svclog"
      type="System.Diagnostics.XmlWriterTraceListener, System, Version=2.0.0.0, Culture=neutral, PublicKeyToken=b77a5c561934e089"
      name="ServiceModelTraceListener" traceOutputOptions="LogicalOperationStack, DateTime, Timestamp, ProcessId, ThreadId, Callstack">
      <filter type="" />
    </add>
  </sharedListeners>
  <trace autoflush="true" />
</system.diagnostics>
The following XML code shows an example for the required settings to write FIM Portal error information into the Forefront Identity Manager section log file of the Event Viewer:
<system.diagnostics>
  <sources>
    <source name="Microsoft.ResourceManagement" switchValue="Error">
      <listeners>
        <add type="System.Diagnostics.DefaultTraceListener" name="Default">
          <filter type="" />
        </add>
        <add name="ExceptionEventLogListener" initializeData="Microsoft.ResourceManagement" type="System.Diagnostics.EventLogTraceListener, System, Version=2.0.0.0, Culture=neutral, PublicKeyToken=b77a5c561934e089" traceOutputOptions="LogicalOperationStack, DateTime, Timestamp, Callstack">
          <filter type="" />
        </add>
      </listeners>
    </source>
  </sources>
  <trace autoflush="true" />
</system.diagnostics>
FIM Portal Tracing Process
To enable FIM portal tracing, you need to:
- Create a backup of your existing Web.config file
- Add the required section to your Web.config file
- Perform an IISRest
 Caution Caution |
|---|
| Depending on your configured tracing level, FIM Portal tracing can have an impact on the performance of your system. If you have a tracing level configured that writes a lot of information to the related files, you should only enable FIM Portal tracing for the time it takes to analyze your issue. This does not include cases, where the trace level is configured to only log errors. |
To disable FIM portal tracing, you need to:
- Revert your original Web.config file
- Perform an IISRest
Trace File Evaluation
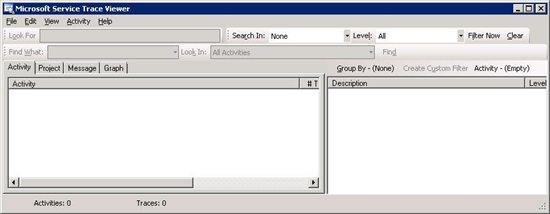
The first configuration example in this article uses the XmlWriterTraceListener to write information to a XML file on your hard drive. While you can use any tool that is suited to display XML data to open and read the trace files, it can be difficult to evaluate the log files using a generic XML file viewer. As a best practice for reading XmlWriterTraceListener based trace files, you should consider using the Windows Communication Foundation (WCF) Service Trace Viewer Tool to open the trace files. The Service Trace Viewer Tool is included in the .Net Framework SDK. ** **

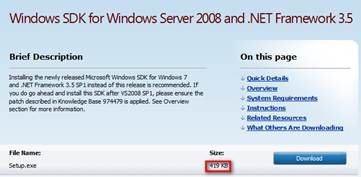
If want to install the Service Trace Viewer Tool but you don't want to install the entire SDK, you can, for example, use the web-installer of the Windows SDK for Windows Server 2008 and .Net Framework 3.5:

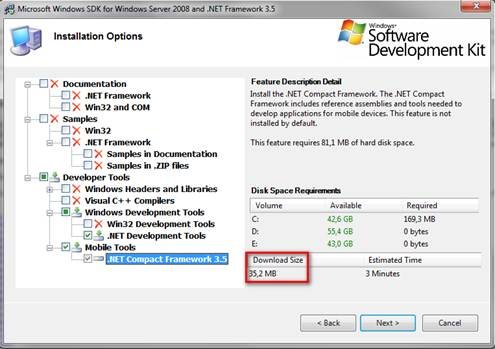
Using this method enables you to uncheck the components you don't want to install:

Note
For more details about the Service Trace Viewer, see Using Service Trace Viewer for Viewing Correlated Traces and Troubleshooting in the MSDN.
When you use the ExceptionEventLogListener to write tracing information into an event log file, you can certainly use the event viewer to evaluate the related messages. However, depending on how many entries you have in your log file, it might be more convenient to access the trace file data by using PowerShell.
The following script code shows a simple method to display the logged information:
| 001 002 003 |
Clear-Host $entries = get-EventLog -logname "Forefront Identity Manager" $entries | Format-List |
See Also
- Troubleshooting FIM 2010 Roadmap
- How to Troubleshoot RCDC Configuration Issues Using FIM Portal Tracing
- How to Configure Detailed Error Pages for the FIM Portal
Note
To provide feedback about this article, create a post on the FIM TechNet Forum.