SQL Server Analysis Services: Many-to-many Dimension Example
This post describes the data discussed in this topic in Books Online:http://msdn.microsoft.com/en-us/library/ms365407.aspx
If you are just learning about many-to-many dimensions, you can use the scripts to create the data structures and experiment on your own.
About the Data
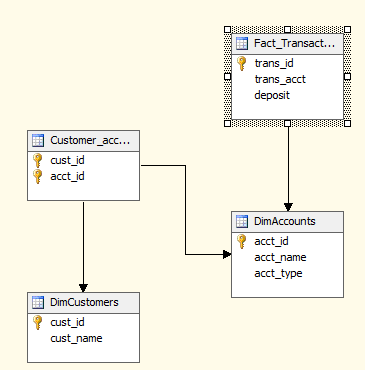
The example consists of 4 tables, including 2 dimensions (accounts, customers), 1 fact table (transactions), and 1 junction table. After you run the T-SQL script provided in this document, you will have a relational database containing a many-to-many relation. Your database diagram should look like this:
The many-to-many relationship is between Accounts and Customers. Accounts can have multiple customers, as is the case with joint accounts. Likewise, customers can have multiple accounts, as illustrated by Dorothy, who has an individual account as well as a joint account with Sam.
The fact table includes deposits for each account. From this data, you can sum deposits by account or by the customer. Customer deposits are available because of the many-to-many relationship that connects customers to accounts.
When using many-to-many dimensions in a report, be aware that depending on how you sum, the grand total might include double-counted values. For example, suppose you want to know the grand total of all deposits. If you sum by Account, you will get an accurate total because deposits are made into accounts, which the fact table recognizes. The double-counting comes into play if you sum by Customer. Because customers like Sam and Irene share an account, both Sam and Irene will show a balance of $1220 each if you list deposits by customers, effectively counting their shared balance twice. If you computed a grand total by the customer, your calculation could overstate the actual total.
Create data structures and insert data
This section explains how to create the underlying database that provides the many-to-many data structures. It includes scripts for creating tables and inserting data.
Step 1: Use SQL Server Management Studio to create a new relational database using the SQL Server RDBMS. Right-click Databases and specify M2MDB as the new database.
Step 2: Open a new query window on the database and execute the following script. Some of these strings are long. In your script, make sure there are no line breaks in the VALUES. You might want to copy into Notepad first to verify there are no line breaks.
/** start  with  a connection  to database  M2MDB

USE M2MDB;

GO


CREATE TABLE  DimCustomers

(

  cust_id int  PRIMARY KEY,

  cust_name varchar(50),

);

 GO


 CREATE TABLE  DimAccounts

(

  acct_id int  PRIMARY KEY,

  acct_name varchar(50),

  acct_type varchar(20),

);

GO


CREATE TABLE  Customer_accounts_junction

(

  cust_id int,

  acct_id int,

  CONSTRAINT cust_acct_pk PRIMARY KEY  (cust_id, acct_id),

  CONSTRAINT FK_Cust

      FOREIGN KEY  (cust_id) REFERENCES  DimCustomers (cust_id),

  CONSTRAINT FK_Acct

      FOREIGN KEY  (acct_id) REFERENCES  DimAccounts (acct_id),

);

GO


CREATE TABLE  Fact_Transactions

(

  trans_id int  PRIMARY KEY,

  trans_acct int,

  deposit int,

  CONSTRAINT FK_acct_id

      FOREIGN KEY  (trans_acct) REFERENCES DimAccounts (acct_id),

);

GO

INSERT INTO  dbo.DimAccounts

VALUES ('10', 'Account1',  'Joint'), ('11', 'Account2',  'Joint'), ('12', 'Account3',  'Joint'), ('13', 'Account4',  'Individual'), ('14', 'Account5',  'Individual');

GO

INSERT INTO  dbo.DimCustomers

VALUES ('20', 'Sam'), ('21', 'Bill'), ('22', 'Sue'), ('23', 'Irene'), ('24', 'Dorothy'), ('25', 'Joe');

GO

INSERT INTO  dbo.Customer_accounts_junction

VALUES ('20', '10'), ('21', '11'), ('22', '12'), ('23', '10'), ('24', '11'), ('24', '13'), ('25', '12'), ('25', '14');

GO

INSERT INTO  dbo.Fact_Transactions

VALUES ('30', '10','100'), ('31', '11','75'), ('32', '12','50'), ('33', '10','600'), ('34', '11','80'), ('35', '12','160'), ('36', '10','300'), ('37', '11','290'), ('38', '12','40'), ('39', '10','220'), ('40', '13','170'), ('41', '13','140'), ('42', '14','80'), ('43', '14','90');

GO
Create the cube in Analysis Services
This section explains how to create a cube that contains a many-to-many dimension relationship. It includes steps for setting up the cube.
Step 1: Start a new project in SQL Server Data Tools using the Analysis Services Multidimensional and Data Mining project template.
Step 2: Create a new data source, pointing to the relational database M2MDB. If you are using the service account for the connection, make sure that the OLAP service account has a database login and data-reader permissions.
Step 3: Create a data source view based on all tables. Because the underlying data source provides the many-to-many relationship, you don’t need to do anything special in the data source view. Your data source view should look like this.
As someone who is just learning about this subject, it’s important to know that other starting points are possible, including establishing the many-to-many dimension relationship directly in Analysis Services, in the data source view. If the underlying data mart does not include the many-to-many relationship you need, you can create one in the multidimensional model. Lesson 5 in the Analysis Services tutorial walks you through this exercise.
In our case, the task of creating a many-to-many dimension relationship in SSAS is vastly simplified by the fact that the underlying data source already gives us structures to work with. All we have to do in our cube is use existing tables and map relationships.
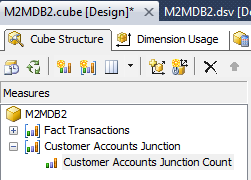
Step 4: Create a cube, choosing all 4 tables. For Measure groups, specify Fact_Transactions and the Customer_Accounts_Junction table. Recall that the junction table is what supports the many-to-many relationship. In Analysis Services, a junction table is realized as a measure group.
Step 5: The cube should now be created. In cube designer, in the Measure group pane, right-click the count measure in Customers_Accounts_Junction measure group, select Properties, and set Visible to False.
Because this measure group exists solely to support the many-to-many relationship, you will want to hide its measures from reporting applications that eventually use the cube. Be sure to do this for any measure group that serves as a junction table in your model.
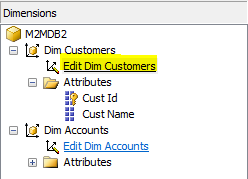
Step 6: In cube designer, add dimension attributes. One disadvantage of using the cube wizard is that you cannot specify all of the attributes you need. You will now add them manually by clicking Edit Dimension in the Dimension pane.
The Dimension editor tab opens. Drag Cust Name from the data source view pane on the right to the dimension attribute list on the left.
Repeat for Account Name and Account Type in DimAccounts.
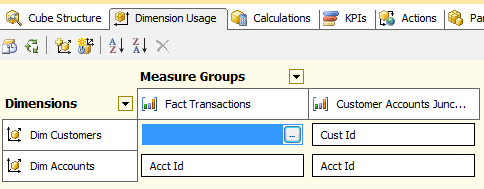
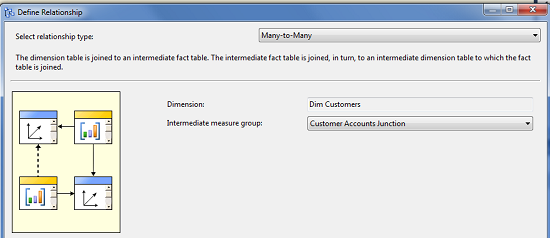
Step 7: In cube designer, click Dimension Usage tab to specify the Many-to-Many relationship. Although the underlying data structures implement a many-to-many relationship, the cube is not aware of it until you specify it.
Initially, the relationship between Customers and Fact_Transaction table is empty, as shown in the following screenshot.
Click the browse button in the empty field to open the Define Relationships dialog. Select Many-to-Many, and then choose the junction table as the intermediate measure group.
Step 8: Deploy the project to an Analysis Services instance.
Connect to the cube using Excel to explore the data
Use Excel to browse the data. The following screenshot shows multiple PivotTables.
Table 1 slices deposit by Accounts.
Table 2 shows deposits by Customer. Notice that the grand total for Customers is that same as the grand total for Accounts, even though we have many more subtotals in the Customers table. The grand total is the same because the Deposit measure is actually aggregated by Accounts and not Customers.
Table 3 repeats Customer deposits but includes an additional calculation off to the side that shows a larger balance. Had you manually summed all of the deposits by individual customers, customers who have joint accounts might be double-counted, which would have resulted in a grand total of $4310.
Fortunately, Excel handles the many-to-many case correctly in the Customer case, including one deposit subtotal per account, instead of adding up all of the deposits by individual customers.
Other models and tools might have different behaviors. Always test and verify your reports to ensure that the values are what you would expect.
Next Steps
Now that you’ve created a many-to-many dimension relationship in Analysis Services, use the following resources to deepen your knowledge:
Many to Many Revolution is a comprehensive white paper that covers a wide range of scenarios involving many-to-many dimensions. It includes sample models and database. Be sure to check it out.
Analysis Services tutorial, Lesson 5, explains how to create a many-to-many relationship using AdventureWorks data.
Many to Many dimensions in SQL Server 2005 Analysis Services (white paper) was written when the feature was introduced, but all the concepts still apply.
Many-To-Many Currency Conversions in Microsoft's SQL Server Analysis Services is another tutorial on the subject. This one focuses on currency conversion using AdventureWorks data.
The sample AdventureWorks Multidimensional Models SQL Server 2012 includes the AdventureWorks cube, which contains two many-to-many dimension relationships. Both the Sales Reasons and Exchange Rates dimensions are intermediate measure groups that support many-to-many relationships between sales reasons and orders, and currency and orders.


