BizTalk Server: Checking Tracked Data Using Admin Console
This article intends to show how to see tracked data using the Admin Console, resulting from this forum question.
Introduction
The BizTalk Server Administration Console provides a User Interface to the end user to view, analyze, and troubleshoot the tracked data. The Group Hub page that is categorized in six sections (if EDI is selected during installation and configuration) or else four sections depending upon the purpose and container of predefined queries.
Note: BizTalkDTADb Tracking database stores tracked data that has already been processed through the MessageBox database. SQL Agent job called DTA Purge and Archive (BizTalkDTADb) help in controlling the size of the database and to do so it performs the task of purging the BizTalkDTADb database. By default, this job runs every minute and purges all completed instances older than some user configured time.
How to Access Group Hub Page
- Click Start button
- All Programs
- Select Microsoft BizTalk Server 2010
- Select BizTalk Server Administration
- Click on BizTalk Group
Note: By default, group-level tracking is enabled.
If Group-level tracking is not enabled then no data will be tracked thus can't be checked.We are able to check the tracked data because of job called TrackedMessages_Copy_BizTalkMsgBoxDb which periodically copies message bodies from MessageBox to tracking database (BizTalkDTADb) and it is this job which makes message bodies available to WMI and tracking queries.
Checking Tracked Service Events
To check tracked service events, click on "Tracked service instances" on the group hub page. The result of this is the combination of all the service instances which were successful and terminated.
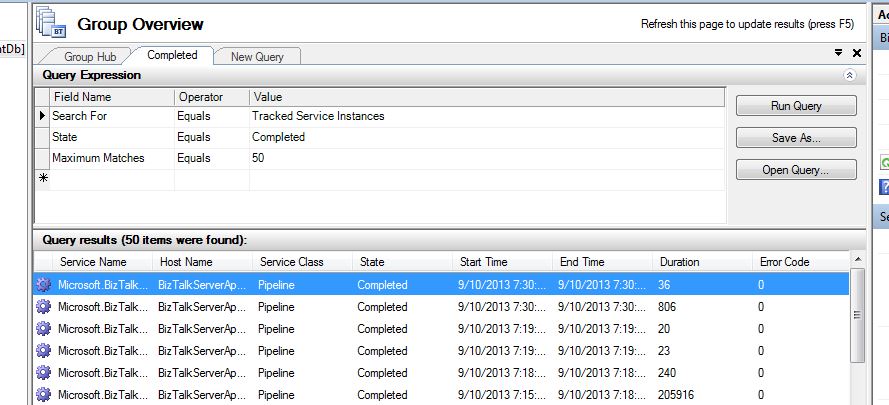
To be able to see the successful events, click on "Completed instances".
Figure 1. Completed service instances result.
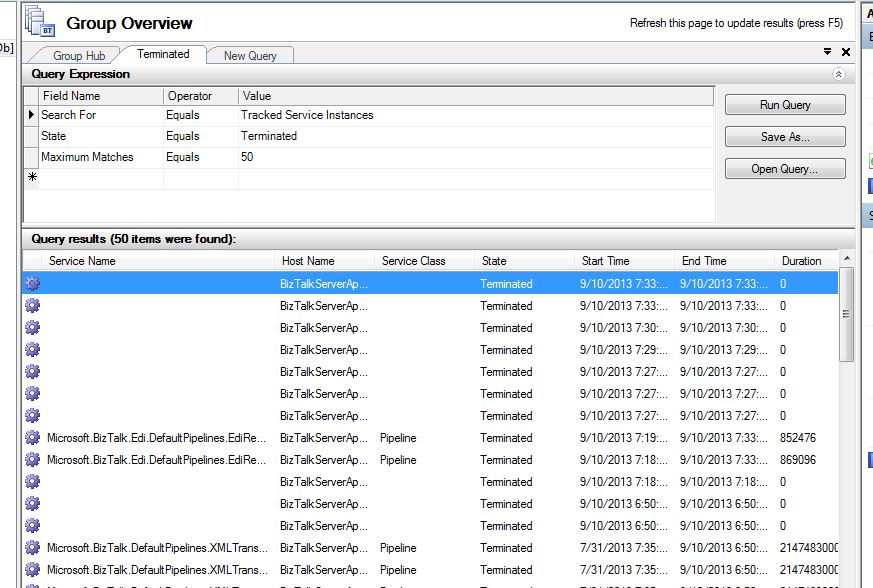
To be able to see the terminated events, click on "Terminated instances".
Figure 2. Terminated service instances result.
What Information is displayed in the result
The result has following information:
- Service Name
- Host Name
- Service Class
- State
- Start Time
- End Time
- Duration
- Error Code
- Error Description
- Assembly Name
- Assembly Version
- Deployment Time
What more can be checked
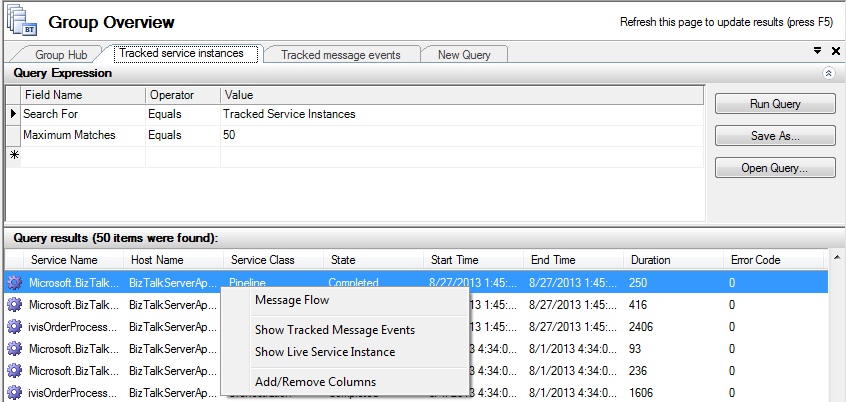
More details can be seen by right-clicking on any of the results which you want and then selecting from following options:
- Message flow
- Show Tracked Message Events
- Show Live Service Instance
- Add/Remove Columns
Figure 3. Other available options.
Checking Tracked Message Events
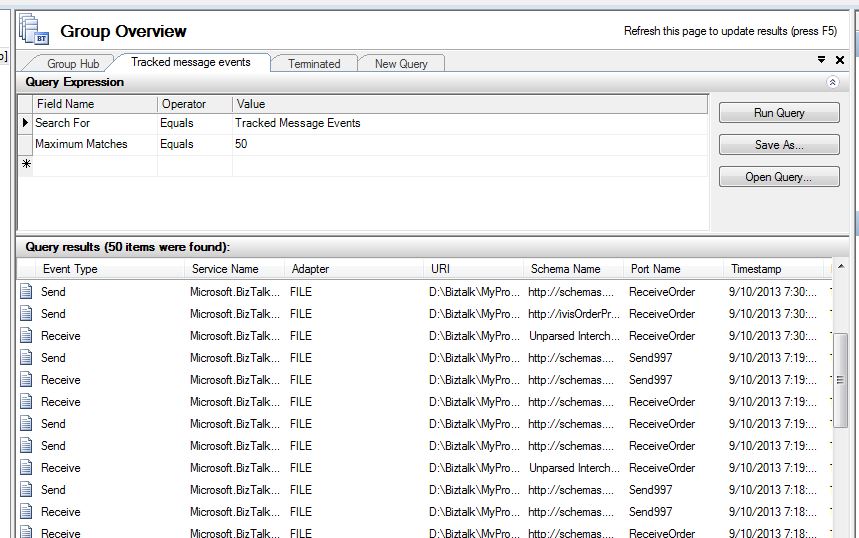
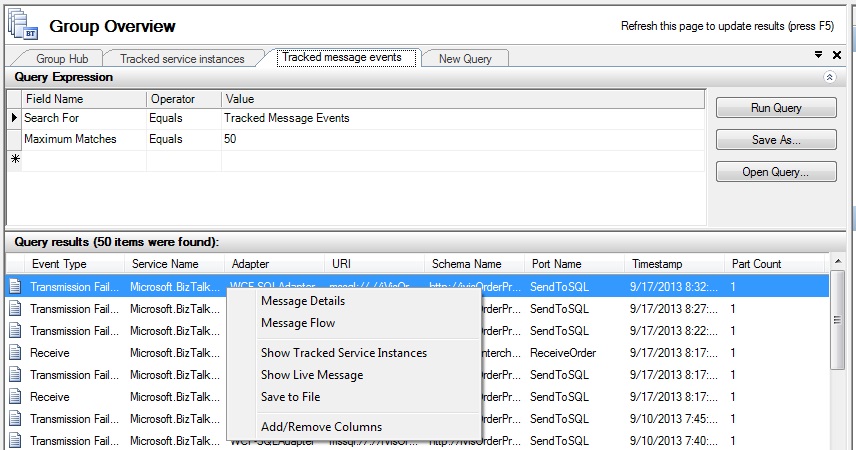
To check the tracked message events, click on "Tracked Message Events" in the group hub page. The combination of all the message events, which were successful and failed will be shown.
**Figure 4.**Tracked message events result.
To be able to see the failed message events, click on "Transmission failure events".
What Information is displayed in the result
The result has following information:
- Event Type
- Service Name
- Adapter
- URI
- Schema Name
- Port Name
- Timestamp
- Part Count
- Size
- Decryption Certificate
- Signature
- Party Name
- Service Class
What more can be checked
More details can be seen by right-clicking on any of the results which you want and then selecting from following options:
- Message details
- Message flow
- Show Tracked Service Instances
- Show Live Message
- Save to File
- Add/Remove Columns
Figure 5. More available options.
Customizing check
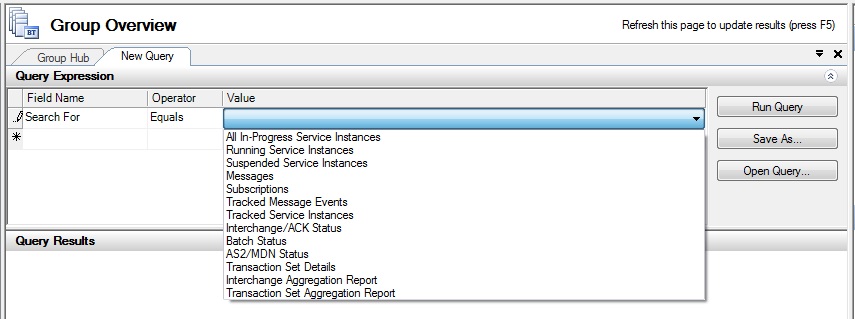
It is possible to customize check with the help of the New Query tab, which has a GUI based Query Editor that supports building custom queries.
Figure 6. Drop-down list showing available options for Value column
As can be seen in the figure, there is a list to choose from for Value column, the same provision is there to choose Operator. After selecting the operator and the required field, click Run Query button and you should be able to see results in Query Results tab.
If you have written query and want to use then click the Open Query button and browse to the location where you have saved your query.
Note: Although tracking is very useful, it should be used wisely as it contributes to increasing the size of the tracking database (BizTalkDTADb) which may have/has a performance impact.
Author
Maheshkumar S Tiwari|User Page
http://tech-findings.blogspot.com/
See Also
Read suggested related topic:
****Another important place to find a huge amount of BizTalk related articles is the TechNet Wiki itself. The best entry point is BizTalk Server Resources on the TechNet Wiki.
Another important place to find a huge amount of TechNet Wiki related articles is Wiki: List of Articles for TechNet Wiki
This article participates in the TechNet Guru for September competition.
