Telemetry Reporting
Written by Ewan Fairweather and Silvano Coriani from the AzureCAT team.
Introduction
Welcome to the fourth wiki entry on designing and implementing the Telemetry component in Cloud Service Fundamentals (CSF) on Windows Azure!
So far, we have described basic principles around application health in
Telemetry Basics and Troubleshooting
including an overview to the fundamental tools, information sources, and scripts that you can use to gain information about your deployed Windows Azure solutions. In our second entry, we addressed
Telemetry - Application Instrumentation
describing how our applications are the greatest sources of information when it comes to monitoring, and how you must first properly instrument your application to achieve your manageability goals after the application goes into production. In our third article we described how to automate and scale a data acquisition pipeline to collect monitoring and diagnostics information across a number of different components and services within your solution; and consolidate this information in a queryable operational store.
The topic for this fourth article is reporting, which basically entails showing you how to get the information you need about your system to suit the different type of analytical and reporting requirements in your organization. We will show you how to quickly extract things like your database tier resource utilization, end-to-end execution time analysis, and how to turn these into reports and dashboards. Specifically, we will walk through the underlying implementation of the operational store along with examples of how to use analytical queries on it. We will also cover the reporting package that we provide and how to utilize Excel to do a deeper level of analysis. We will then show you how you can extend the provided helper functions to get further information.
Telemetry Database in CSF
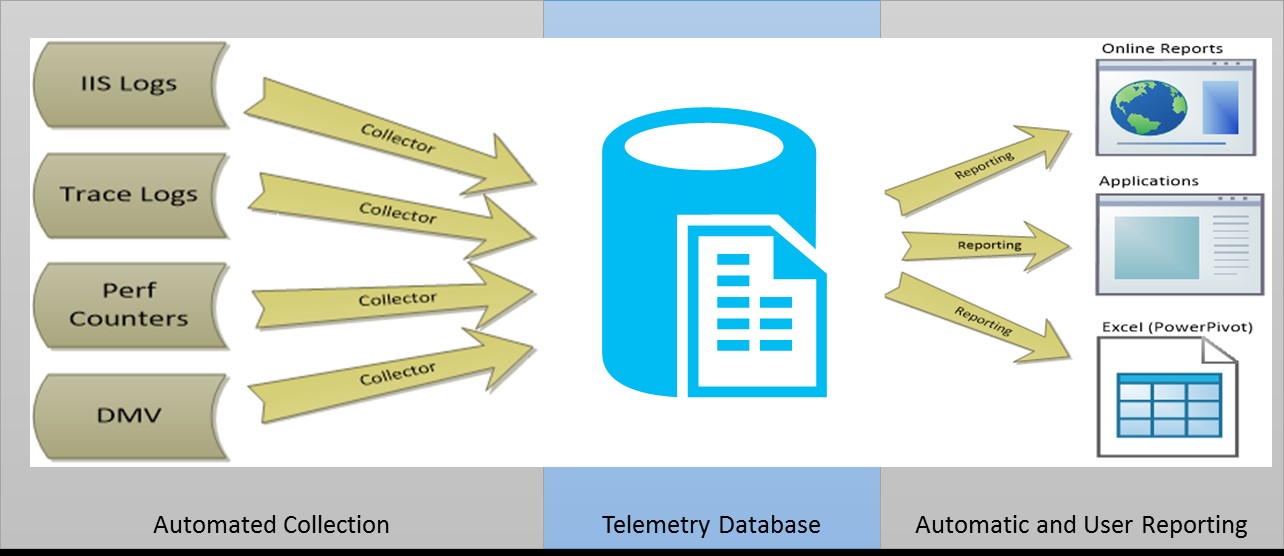
The previous article in this series discussed the data pipeline, which is the CSF implementation of the collector tasks shown in the following data flow diagram. These collector tasks are used by the CSF telemetry worker role and scheduler to populate the Telemetry database on a configurable periodic basic. In this article we will describe how you can extract information (shown on the right-hand side of the diagram) to provide information through reporting services, SSMS and Excel.
Figure 1: Telemetry DB in CSF
Defining Our Reporting Scenario and Requirements
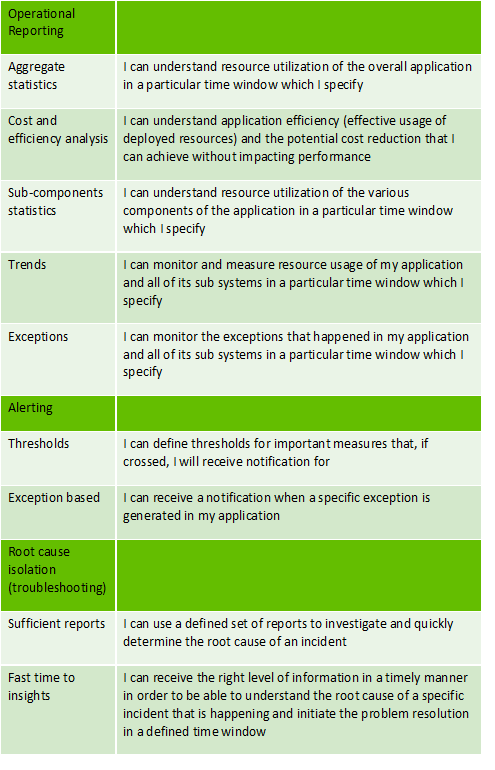
A key first step to gaining effective insight into your telemetry data is to define the reporting scenarios and their key requirements. When defining the CSF telemetry solution, a useful technique was to first define the three scenarios: operational reporting, alerting, and root-cause isolation. The “I can” approach to defining requirements was then used to define the key requirements. These were then prioritized, with the majority of the operational reporting and root-cause isolation scenarios implemented in the out-of-the-box CSF experience. The underlying data structure is there to service your alerting needs.
This technique allowed us to consider how the underlying schema would support the current and potential future requirements, both when defining and then later extending the telemetry database. This technique was an important first step, and you should especially use it if you plan to extend your telemetry database.
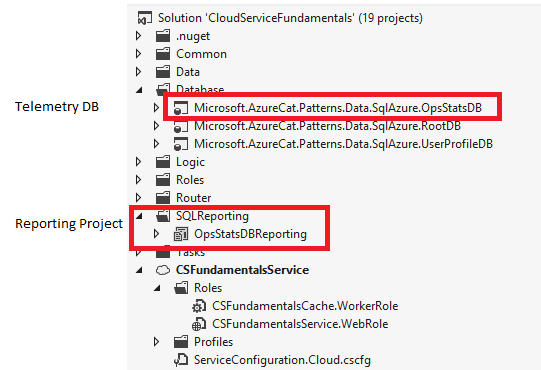
The following picture highlights the specific parts of the CSF package which are related to the telemetry database and reporting solution.
Figure 2: CSF Package
Telemetry OpsStatsDB Database Walkthrough
The OpsStatsDB project in the CSF solution contains our implementation of the telemetry database, which acts as the centralized repository for all of our telemetry data. This solution has been used as the repository for a customer with over 500 databases and up to a hundred worker roles. The tables closely map to the underlying data structures extracted by the various sources, as we decided to preserve the original data shape as much as possible. As described below, the import task data pipeline process enriches the underlying data that is collected with some additional fields. This additional information enables us to simplify the query logic required to meet our reporting requirements, which we defined earlier.
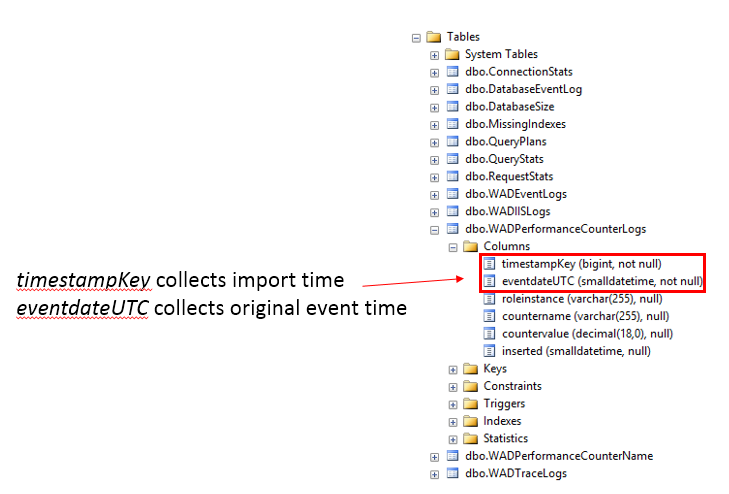
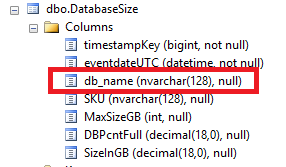
Figure 3: Table Columns
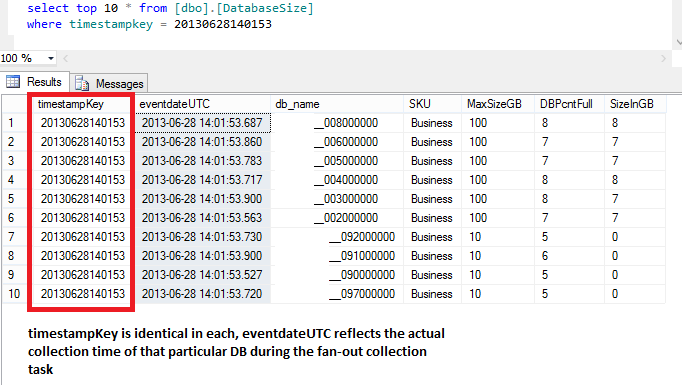
Throughout the tables in the OpsStatsDB you will see a timestampKey and eventdateUTC field. The former is used to collect the import time and the latter collects the actual event time; the decision to implement it this way was because the collection tasks use a fan out process to collect the requisite Dynamic Management View (DMV) data. If this is performed across multiple Windows Azure SQL DBs, there will be a slight discrepancy in the actual time, often in the order of milliseconds, that the data is actually collected across the shards, this is due to the nature of the collection process, and occurs even though the collection is done in parallel. By using the same timestampKey per collection interval it simplifies reporting queries (shown in the second picture below) where we want to ascertain the size of the database at a point in time. To fulfill this cross-instance and database correlation purpose but maintain an accurate record, this separation is implemented consistently across the database. In the Windows Azure Diagnostics (WAD) related tables we also add the roleinstance field, and in the database related tables we add the db_name field. These are populated during the collection data pipeline process and fulfill a similar purpose--to enrich the reporting scenarios.
Figure 4: db names
The picture below shows a practical example. A simple query can return the size of our databases at a particular time period. In particular please note the natural slight discrepancy between the eventdateUTC field in each row.
Figure 5: UTC
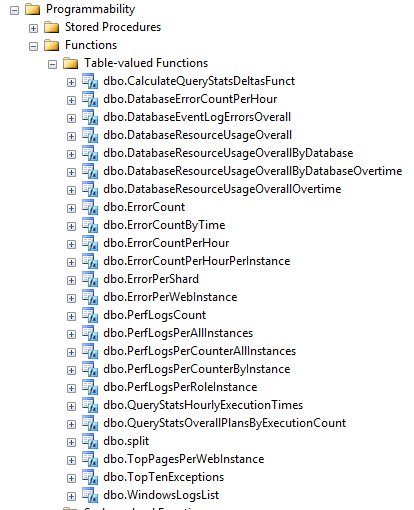
To assist with querying requirements, we have implemented a processing layer using a set of Table Valued Functions, to extract curated information from the raw data. These are depicted below:
Figure 6: Table valued functions
We also provide the scalar function dbo.fnConvertToTimeKey which is used to simplify the conversion of a datatime value into a timestampKey. There are additional benefits on top of the simplified correlation across instances, collection periods, and databases. The BIGINT field timestampKey is also the Clustered index key in all tables within the OpsStatsDB; this field represents the numerical transposition of the collection task timestamp; this numerical field has the format yyymmddhhmmss. Since this is the clustered index key, it helps optimize time-range queries, which are pretty common in our historical reporting and trend analysis scenarios.
Figure 7: Scalar valued functions
Most of the reporting queries have the following general format utilizing the scalar value function and to convert a start and end time into a timestampKey.
Figure 8: Timestamp key
The typical pattern for the Table Valued Functions (TVFs) that the OpsStatsDB provides is shown below. You will find at least two parameters defined startdate and *enddate. * Depending on the context of the TVF, you might find other parameters which should be self explanatory. In the following example, DBName requires the database name to be passed. This example shows the implementation of the QueryStatsOverallPlansByExecutionCount, which is used to provide information on the resource utilization per execution count at the statement level. Note the use of the scalar function, fnConvertToTimeKey, described earlier.
CREATE FUNCTION [dbo].[QueryStatsOverallPlansByExecutionCount]
(
-- Add the parameters for the function here
@startdate datetime,
@enddate DATETIME,
@DBName VARCHAR(255)
)
RETURNS TABLE
AS
RETURN
(
SELECT
dbname,
CONVERT(varchar(max),query_hash,1) AS query_hash,
statement_text,
AVG(average_cpu_time) as cpu_time,
AVG(average_elapsed_time) as elapsed_time,
AVG(average_logical_reads) as logical_reads,
AVG(average_logical_writes) as logical_writes,
MAX(execution_count) AS execution_count,
MAX(last_execution_time) AS last_execution_time
FROM QueryStats
WHERE timestampkey > [dbo].[fnConvertToTimeKey] (@startdate) AND timestampkey < [dbo].[fnConvertToTimeKey] (@enddate) AND dbname=@DBName
GROUP BY dbname,query_hash, statement_text
)
To query the TVFs, the following approach can be used. This also includes an example of the results with identifying customer information removed.
DECLARE @startdate datetime=dateadd(hh,-2,getdate())
DECLARE @enddate datetime=getdate()
DECLARE @dbname VARCHAR(255) ='<ENTER DB NAME HERE'
SELECT * FROM [dbo].[QueryStatsOverallPlansByExecutionCount] (@startdate,@enddate,@dbname)
GO
Figure 9: fnConvertToTimeKey
CSF Reporting Solution
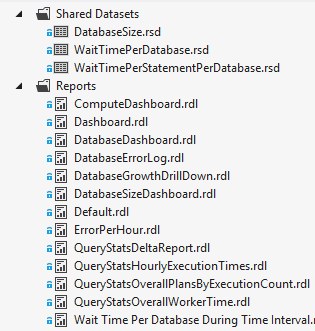
The image below shows the SQLReporting project which is included with the CSF solution. All reports use a shared data source to access the OpsStatsDB.
Figure 10: SQLReporting project
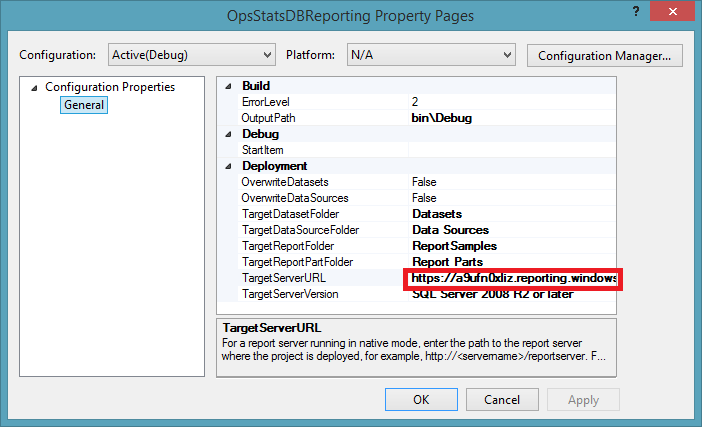
To deploy this you will need to configure the TargetServerURL property. When prompted, specify an appropriate user name and password. Then deploy this to either a Windows Azure SQL Reporting services instance or an on-premises deployment. We utilized Windows Azure SQL Reporting services during CSF testing and subsequent implementation with large-scale customer deployments.
Figure 11: TargetServerURL
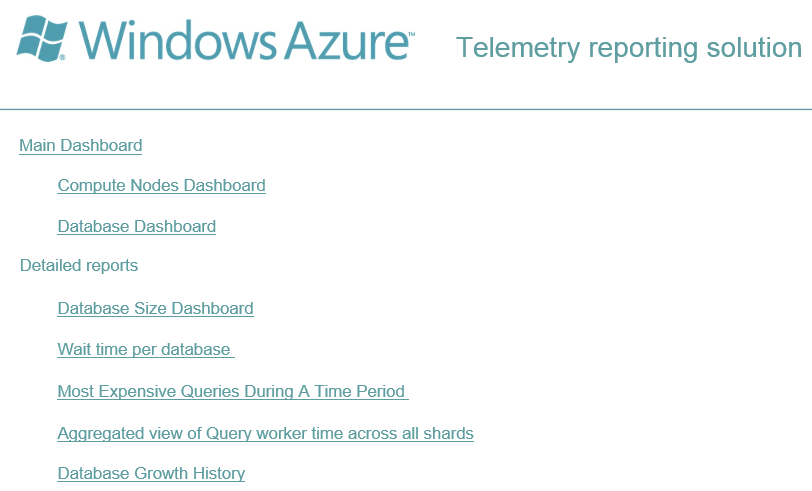
The main menu is found in Default.rdl and is shown below. This can be used to navigate between the different reports.
Figure 12: Main menu
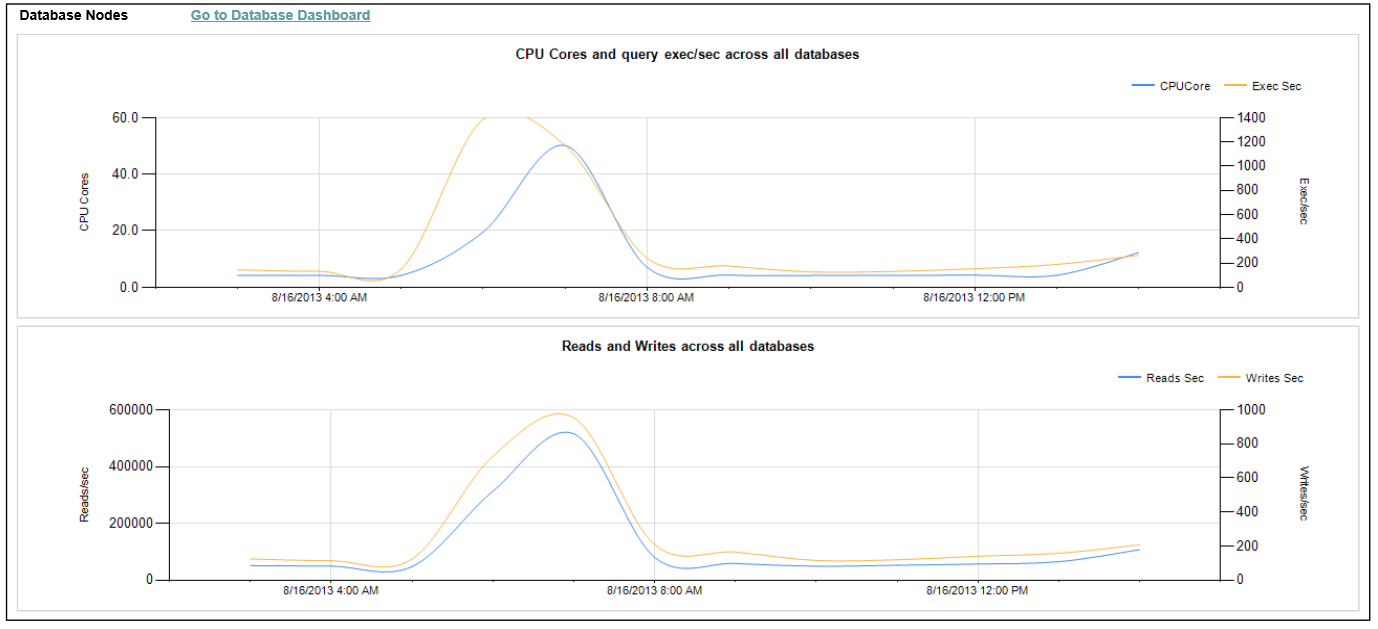
The main dashboard, which can be found in Dashboard.rdl, is primarily focused on providing you with an understanding of your application performance characteristics represented by the following information: the performance counters you configured WAD to collect, graphs to depict this, and an accurate representation of your overall database resource usage. We will now look at how you can customize this report.
Figure 13: Dashboard 1
Figure 14: Dashboard 2
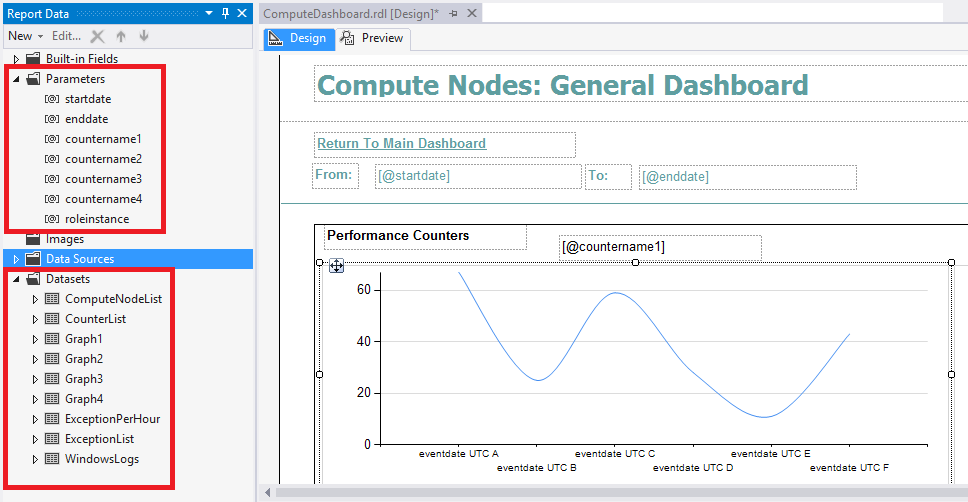
The image below depicts the design view of the Main Dashboard. Two input parameters are defined to represent the start and end period during which you would like to query. The Date/Time data type is used, and a default expression similar to “=DateAdd(DateInterval.Hour,-12,Now())” is used to populate sensible defaults when the dashboard is first opened. This can be adjusted using the Date/Time selection box which is present at the top of each report. Each of the data sets is configured to query OpsStatsDB, and they utilize the TVFs which we showed earlier to simplify the querying logic. For example the CPU dataset (providing the underlying data for the Processor utilization chart) contains the following T-SQL query, which as shown utilizes the PerfLogsPerCounterAllInstances TVF. As discussed previously, the TVF uses the scalar function to simplify the conversion to the required underlying timestampKey:
SELECT * FROM [dbo].[PerfLogsPerCounterAllInstances](@startdate,@enddate, '\Processor(_Total)\ Processor Time')
ORDER BY eventdateUTC
Figure 15: Dashboard 3
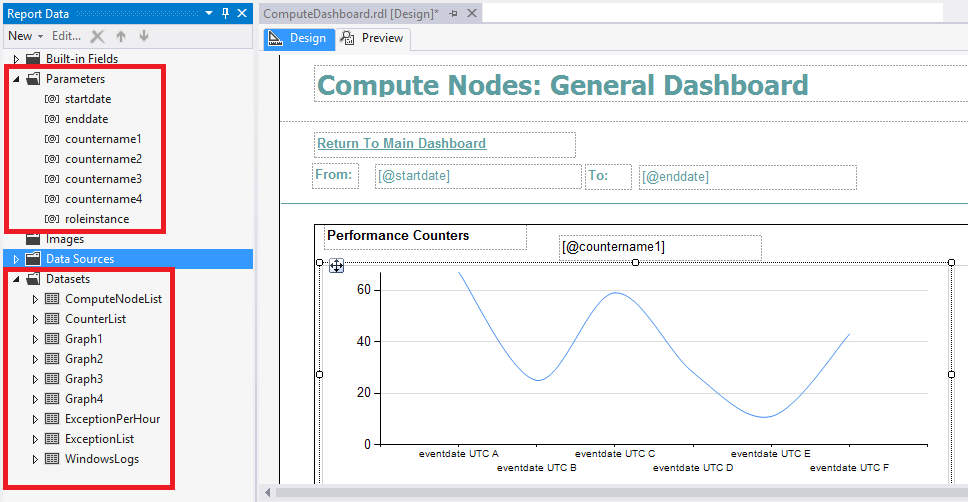
A consistent structure is implemented throughout the reports. The image below depicts the ComputeDashboard.rdl report.
Figure 16: Dashboard 4
In addition to the dashboards we have demonstrated, the reporting solution also provides a database dashboard and various specific reports designed to assist you with your reporting requirements for monitoring, troubleshooting, and capacity planning purposes.
Understanding Resource Usage and Capacity Planning
In order to help you with understand your resource usage, a TVF has been provided to provide overall resource usage information over time. With the introduction in public preview of Azure SQL DB premium offering, this allows you to determine using a data driven approach your current resource usage; and hence whether you need to move your database to a larger instance, or potentially scale out your workload.
The TVF DatabaseResourceUsageOverallOvertime can be used as follows to provide resource usage information, across all databases that the CSF telemetry solution is configured to collect:
DECLARE @startdate datetime=dateadd(hh,-2,getdate())
DECLARE @enddate datetime=getdate()
SELECT * FROM [dbo].[DatabaseResourceUsageOverallOvertime] (@startdate,@enddate) ORDER BY EventDateUTC
GO
This will produce an output like the following, showing your overall resource consumption. With this particular customer we can see there is a spike of CPU cores used and read and write utilization. This corresponds with the time that they run their daily maintenance procedure.
Figure 17: EventDateUTC
Now if we want to see on a per database level, we can create a new TVF to simplify this. Below is the script to create the TVF DatabaseResourceUsageOverallByDatabaseOvertime, this uses the same technique as the previous TVF, excepts that it groups by both EventDateUTC and dbname
CREATE FUNCTION [dbo].[DatabaseResourceUsageOverallByDatabaseOvertime]
(
-- Add the parameters for the function here
@startdate datetime,
@enddate datetime
)
RETURNS TABLE
AS
RETURN
(
SELECT EventDateUTC,dbname,
SUM(Execs) as Execs,
SUM(Execs)/3600 as ExecSec,
SUM(Writes) as Writes,
SUM(Writes)/3600.0 as WritesSec,
SUM(Reads) as Reads,
SUM(Reads)/3600 as ReadsSec,
SUM(CPUSec)/1000 as CPUSec,
SUM(CPUSec)/1000.0/3600.0 as CPUCore
FROM
(
SELECT
q.query_hash,
q.EventDateUTC,
q.dbname,
-- qp.Execs, q.Execs,
abs(q.Execs- COALESCE(qp.Execs,0)) as Execs,
-- qp.Writes, q.Writes,
abs(q.Writes- COALESCE(qp.Writes,0)) as Writes,
-- qp.Reads, q.Reads,
abs(q.Reads- COALESCE(qp.Reads,0)) as Reads,
-- qp.CPUSec, q.CPUSec,
(abs(q.CPUSec- COALESCE(qp.CPUSec,0))) as CPUSec
FROM
(SELECT
query_hash,
dbname,
CONVERT(datetime,SUBSTRING(CONVERT(varchar(14),FLOOR(timestampKey/10000)*10000),1,8)+' '+SUBSTRING(CONVERT(varchar(14),FLOOR(timestampKey/10000)*10000),9,2)+':'+SUBSTRING(CONVERT(varchar(14),FLOOR(timestampKey/10000)*10000),11,2)+':'+SUBSTRING(CONVERT(varchar(14),FLOOR(timestampKey/10000)*10000),13,2),112) as EventDateUTC,
MAX(execution_count) AS Execs,
MAX(total_logical_writes) AS Writes,
MAX(total_logical_reads) AS Reads,
MAX(total_worker_time) /1000 AS CPUSec
FROM [dbo].[QueryStats]
WHERE timestampkey > [dbo].[fnConvertToTimeKey] (@startdate) AND
timestampkey < [dbo].[fnConvertToTimeKey] (@enddate)
GROUP BY query_hash, dbname, FLOOR(timestampKey/10000)
) AS q LEFT JOIN
(SELECT
query_hash,
dbname,
CONVERT(datetime,SUBSTRING(CONVERT(varchar(14),FLOOR(timestampKey/10000)*10000),1,8)+' '+SUBSTRING(CONVERT(varchar(14),FLOOR(timestampKey/10000)*10000),9,2)+':'+SUBSTRING(CONVERT(varchar(14),FLOOR(timestampKey/10000)*10000),11,2)+':'+SUBSTRING(CONVERT(varchar(14),FLOOR(timestampKey/10000)*10000),13,2),112) as EventDateUTC,
MAX(execution_count) AS Execs,
MAX(total_logical_writes) AS Writes,
MAX(total_logical_reads) AS Reads,
MAX(total_worker_time) /1000 AS CPUSec
FROM [dbo].[QueryStats]
WHERE timestampkey > [dbo].[fnConvertToTimeKey] (DATEADD(hh,-1,@startdate)) AND
timestampkey < [dbo].[fnConvertToTimeKey] (DATEADD(hh,-1,@enddate))
GROUP BY query_hash, dbname, FLOOR(timestampKey/10000)) AS qp ON q.query_hash = qp.query_hash AND q.dbname = qp.dbname AND q.EventDateUTC = DATEADD(hh,1,qp.EventDateUTC)
) AS Aggregated
GROUP BY EventDateUTC,dbname
)
GO
We can then use this to drill down and understand per database which specific databases are consuming the most resources, using the following query.
DECLARE @startdate datetime=dateadd(hh,-2,getdate())
DECLARE @enddate datetime=getdate()
SELECT * FROM [dbo].[DatabaseResourceUsageOverallByDatabaseOvertime] (@startdate,@enddate)
ORDER BY EventDateUTC, cpucore desc
Which will produce an output like this. The database names have been obscured deliberately.
Figure 18: TVF
Representing This Data Graphically
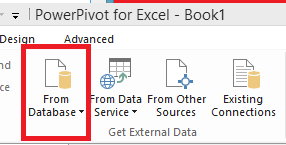
To understand temporal trends, this data can be represented using excel and PowerPivot. If you select the PowerPivot tab in Excel and then go to Manage, the option as shown below will be available to import a data source from a database.
Figure 19: Excel menu
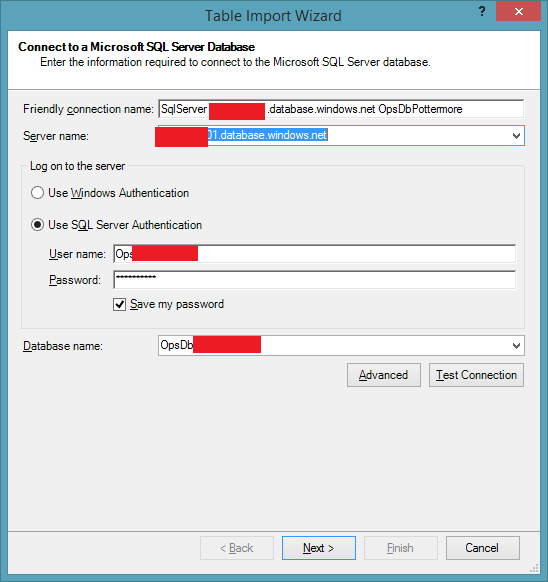
If you configure it with the location to your OpsStatsDB, as per below and then select the Write Query option, you can use a query such as below to import data which can be used to understand resource utilization.
Figure 20: OpsStatDB
DECLARE @startdate datetime=dateadd(hh,-24,getdate())
DECLARE @enddate datetime=getdate()
SELECT * FROM [dbo].[DatabaseResourceUsageOverallByDatabaseOvertime] (@startdate,@enddate)
ORDER BY EventDateUTC
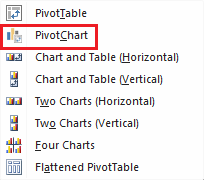
Once the data is imported the PivotChart option can then be used
Figure 21: PivotChart
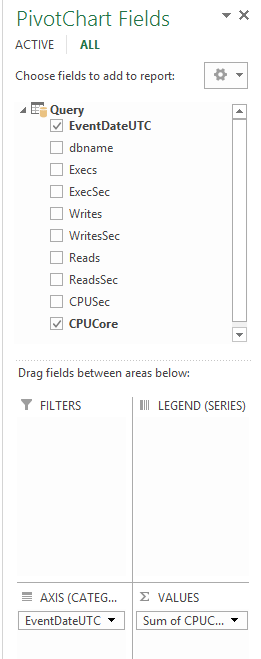
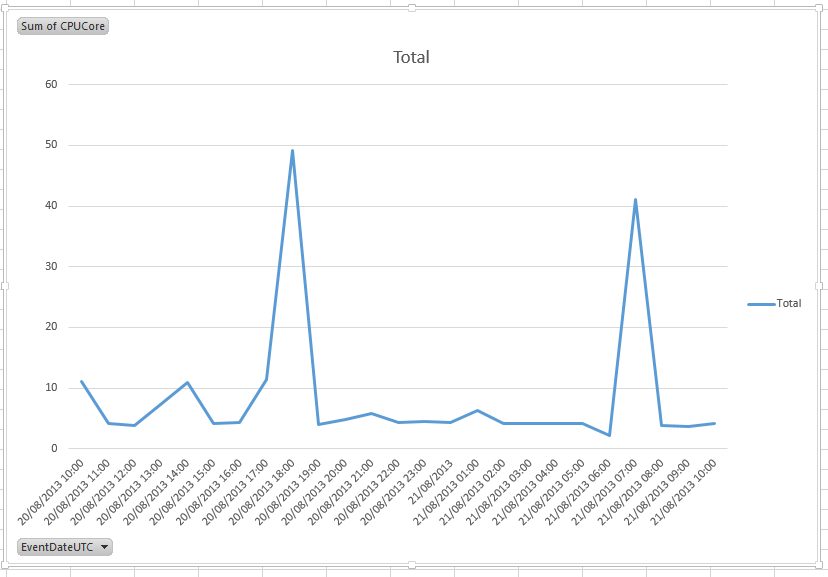
A chart can then be configured to visualize the appropriate data, the configuration below will produce the chart shown in the next screenshot that shows the CPU core/sec utilization over time for this customers databases.
Figure 22: PivotChart Fields
As can clearly be seen in the diagram below they have a peak between 16:00-19:00 UTC time which corresponds with their peak user volumes and another at 06:00-08:00 which corresponds with their maintenance processes. This data can be refreshed over time, so that you can monitor resource utilization as the end user volume increases. A traditional capacity planning approach and performance optimization can then be combined to size your databases for the peaks and tune your workload to be more efficient.
Figure 23: Peak chart
Conclusion
Thank you for taking the time to read through this wiki entry which has walked you through how you to use traditional querying techniques, a reporting services approach and graphical tools such as Excel PowerPivot to gain insight into your system. As we discussed the OpsStatsDB and reporting solution have been designed in a way that allows you to modify and extend the helper TVF functions we have provided to suit your reporting needs.
