Telemetry – Data Acquisition Pipeline
1. Introduction
Welcome to the third wiki entry on designing and implementing the Telemetry component in Cloud Service Fundamentals (CSF) on Windows Azure! So far, we have described basic principles around application health in Telemetry Basics and Troubleshooting including an overview to the fundamental tools, information sources, and scripts that you can use to gain information about your deployed Windows Azure solutions. In our second entry, we have addressed Telemetry - Application Instrumentation describing how our applications are the greatest sources of information when it comes to monitoring, and how you must first properly instrument your application to achieve your manageability goals after the application goes into production.
This third article focuses on how to automate and scale a data acquisition pipeline to collect monitoring and diagnostic information generated by a number of different components and services within your solution. As shown in our previous entries, this information will have different formats and granularity. Our first goal is to aggregate, in a single relational store, data coming from different sources to facilitate correlations and analysis activities. This centralized repository will also feed the reporting and analytic solution that we will describe in our next article.
2. Pipeline Characteristics
While implementing the Telemetry component for Cloud Service Fundamentals, we started from the various diagnostic sources already mentioned in the previous articles. These fell into one of following three buckets:
- Application generated traces (Trace logs)
- Infrastructure diagnostic logs (Performance counters, IIS Logs, Windows Event Logs)
- Database usage metrics (DB size, Query Stats, Request Stats, Missing indexes, Error Logs)
These sources have different characteristics in terms of underlying schema, access patterns and client technologies. So in our pipeline design we decided to implement a centralized scheduling mechanism to execute a number of import tasks. Each task is dedicated to a specific source, to extract and shape the information before sending it to the OpsStoreDB database.
The following picture highlights code projects, part of CSF package, that are related to data acquisition pipeline implementation:
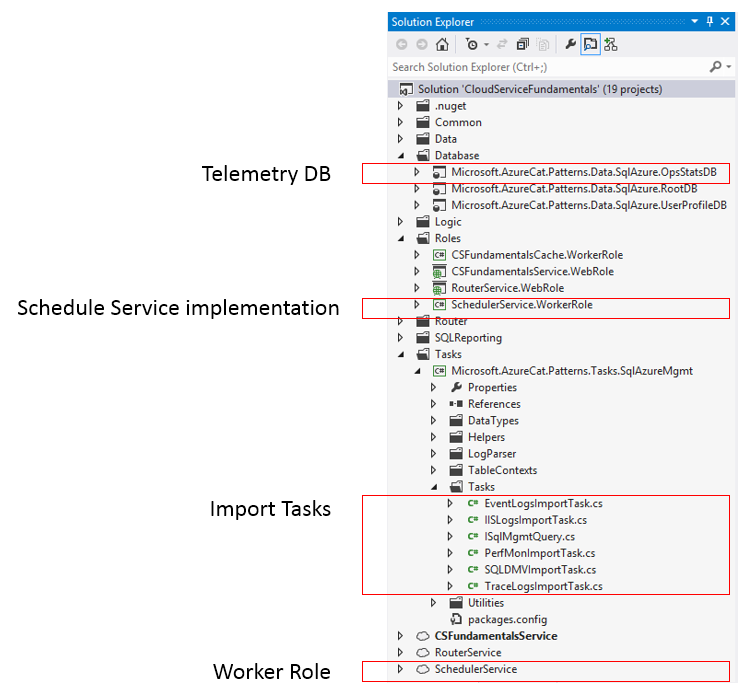
Figure 1 - Main telemetry projects in Cloud Service Fundamentals
2.1 Multiple Data Sources Across Nodes and Services
The decision of relying on Windows Azure Diagnostics (WAD) to collect diagnostic and monitoring information at the application tier level facilitated our work here, as it acted as a first aggregation point across all compute nodes deployed in our solution. With this approach, we only need to connect to the Storage Account configured in the service deployment configuration to collect diagnostic information generated by the entire application tier. In event that data must be collected from multiple service deployments (pointing to multiple Storage Accounts), simply schedule multiple Import Tasks and let the scheduler deal with parallel tasks execution.
This was more complicated for the database tier, where we had the goal of targeting partitioned databases with potentially hundreds of shards. That is why, for this component we opted for a different strategy: a fan-out query library, used by a single Import Task, executing the same set of database calls in parallel (relying on .NET Task Parallel Library) to acquire DMVs output from a number of target databases at a time.
2.2 Data Granularity and Latency
During the initial design phase of this component we considered various options, from traditional polling mechanisms to more modern data streaming alternatives. Given that both WAD and Windows Azure SQL Database DMVs are both acting as "buffers", capturing and storing diagnostic information locally for a given amount of time, this greatly simplified our work reducing the need for more complex solutions in order to capture high frequency and volatile events. A simple scheduling mechanism with the ability to define different data acquisition frequencies for different sources is the preferred solution. As we know, in WAD we have the option to control scheduled transfer frequencies between monitored compute nodes and the centralized Storage Account. In our solution we paired this behavior with the ability to define multiple data acquisition intervals for the various Import Tasks in order to adjust granularity and latency based on our monitoring needs.
3. Scheduler Implementation
Today there are a growing number of options to schedule task executions on Windows Azure are growing (for one example, the Windows Azure Mobile Services Task Scheduler implementation, as an example). However, at the time when we designed the Telemetry component in Cloud Service Fundamentals we thought that running an instance of the Quart.NET scheduler inside a worker role was a simple and great option to get the job done. This is a full-featured, open source job scheduling system with a variety of features that can be used from smallest apps to large-scale enterprise system, from flexible configuration options to high availability.
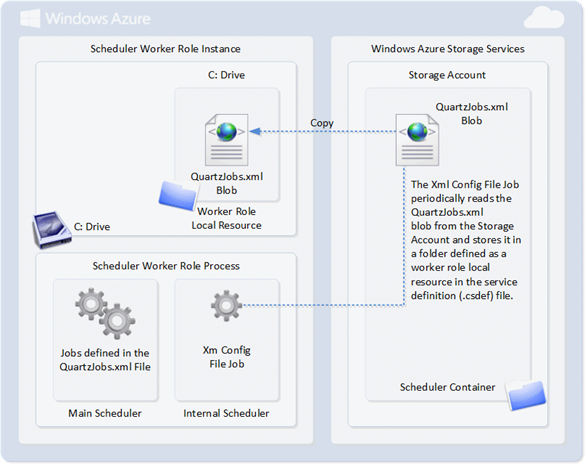
The following picture shows the architecture of the SchedulerService worker role in CSF that is responsible for running Telemetry tasks at configurable time intervals:
***Figure 2
Internally, the worker role is relying on two scheduler instances:
- Internal Scheduler runs an internal job defined by the XmlConfigurationFileJob class that periodically checks the presence of a Quartz xml configuration file (QuartzJob.xml) on a storage account defined in the Service Configuration (.cscfg) file (see below). The job caches the LastModifiedUtc property of the blob and retrieves the file only when it was updated. The file is then saved in a folder of the worker role defined as a local resource in the Service Definition (.csdef) file. The job frequency and refresh period can be defined in the Service Configuration file.
- Main Scheduler: uses the Quartz xml configuration file retrieved from the storage account to define jobs and triggers. The Quartz.Plugin.Xml.XMLSchedulingDataProcessorPlugin, class is used to read and refresh jobs and triggers data when the internal scheduler retrieves a new version of the xml configuration file from the storage account.
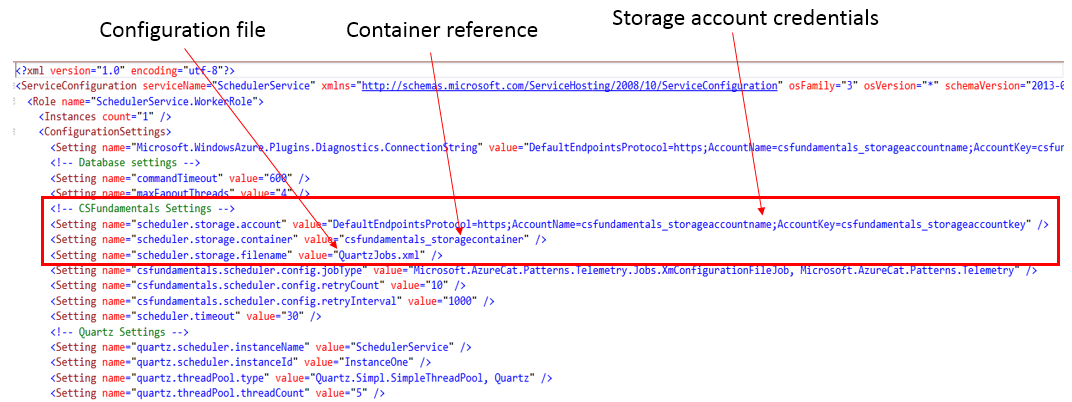
The ServiceConfiguration file contains the following section to control the settings of the worker role and Quartz scheduler:
Figure 3 - ServiceConfiguration.cscfg file in SchedulerService Worker Role
QuartzJob.xml plays a critical role in the Telemetry component configuration, as it defines the set of Import Tasks and their scheduled executions using the <job> and <trigger> element combination showed in the following picture:
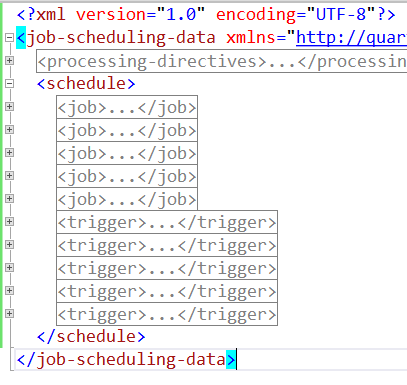
Figure 4 - QuartzJob.xml file structure
The <job> element defines a new activity to be scheduled by the Quartz engine. <name> is the unique identifier of this new task, while <job-type> point to the Assembly and the Class name to load when the task will be executed, as described in the following picture:
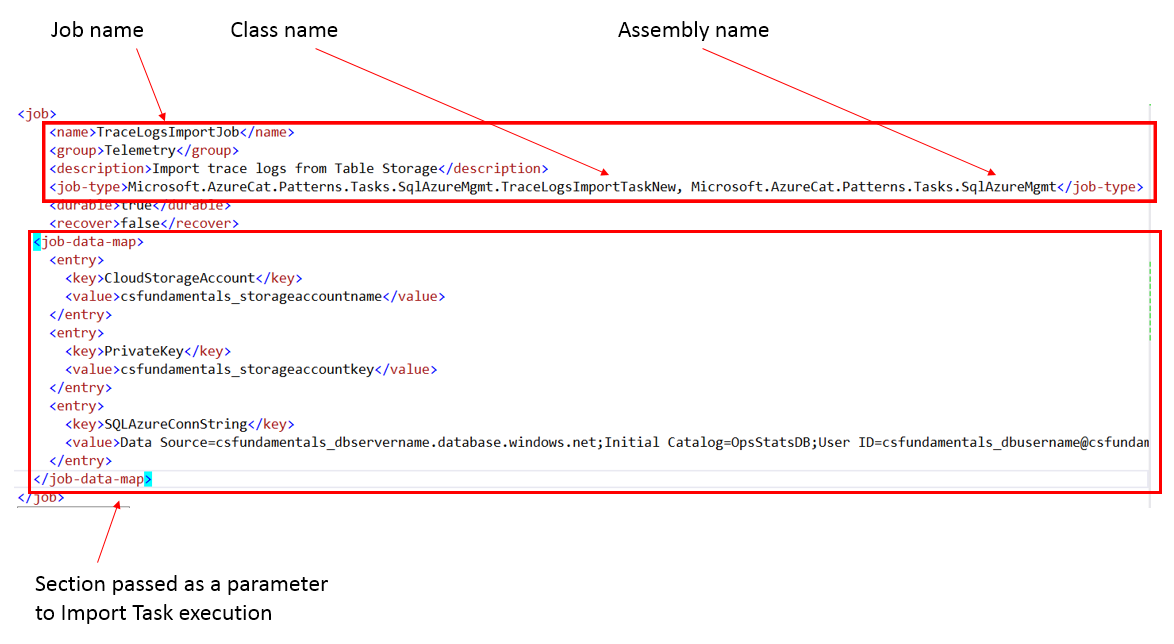
Figure 5 - Job element in QuartzJob.xml
Each Import Task will then implement the IPeriodicTask interface containing the Execute() method that the Quartz engine will invoke when scheduled, passing the <job-data-map> section as the configuration file as a parameter to govern task execution, as explained in the code excerpt in the next picture:
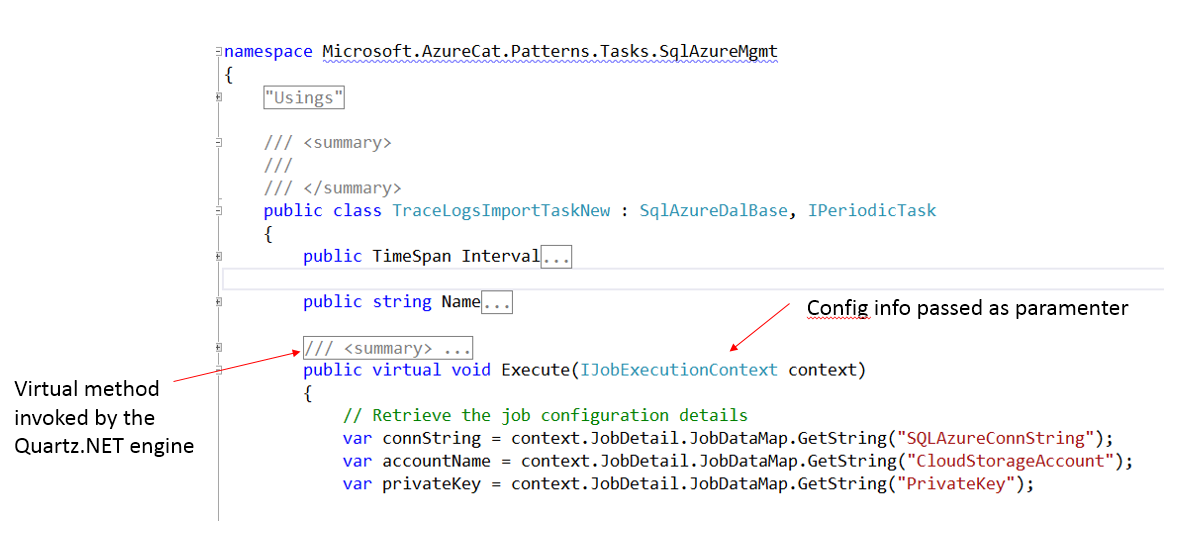
Figure 6 - Example of an Import Tasks implementation
The other critical element in QuartzJob.xml configuration file is <trigger>. This is basically defining the execution interval for each Import Task. This following picture shows the most important information contained in one of these elements:

Figure 7
After this walkthrough of the SchedulerService configuration options, it should be clear how it is possible to schedule multiple Import Tasks with different execution frequencies, pointing to one or more information sources and target repositories.
4. Import Tasks Implementation
As we have introduced in the previous section, each Import Task implementation has a very similar structure:
- It implements the IPeriodicTask interface.
- It implements the Execute() virtual method.
- It receives all configuration information needed as a parameter structure.
- Internally it calls the MethodRunner.Execute() method, a wrapper that provides common features like tracing execution times and exceptions.
What differentiate the various Import Task classes provided with CSF is the internal logic that deals with the different data sources and transformations that are specific for each diagnostic channel. All of them are basically querying the underlying data sources using a specific time interval that begins with the date and time of the latest successful task execution and ends with the current execution time.
This means that if a particular task is scheduled to be executed every 5 minutes, that will also be the time interval we will use to query the specific data source and import the delta of new information that have been generated from that diagnostic source in that time interval. Because some data sources can produce a huge amount of diagnostic information overtime, for the very first execution after a role restart we are limiting this data acquisition interval to 15 minutes.
In current implementation of CSF we are providing the following Import Tasks:
- EventLogsImportTask, that polls the WADWindowsEventLogsTable table in the WAD target storage account to extract System, Application, and Windows Azure Event Logs from all compute node instances in a service deployment. Like any other WAD-related Import Task, it relies on the Windows Azure Storage Client Library v2.0 for accessing tables and blob containers.
- IISLogsImportTask, that captures IIS logs files from all Web Roles, stored in the wad-iis-logfiles Blob container in the WAD target storage account. This task is more complex compared to the other WAD-related tasks, because in its logic it first has to query the WADDirectoriesTable table, in order to retrieve the list of blob files related to the specific time interval of interest. With that list, it then downloads these blob files in the local file system of the SchedulerService worker role where they will be parsed to extract interesting information like the list of top accessed URLs with related response times from a web user perspective.
- PerfMonImportTask, is collecting performance counter information from the WADPerformanceCountersTable in the WAD target storage account. This is basically the accumulate collection of all performance counters configured in the diagnostics.wadcfg configuration file, across all compute nodes in our service deployment.
- SQLDMVImportTask, as the name implies, is responsible for querying all application databases (leveraging the FanOutQueryBase class in Microsoft.AzureCat.Patterns.Data.SqlAzureDalSharded assembly that we’ve mentioned before) and extracting a number of pieces of diagnostic information, like Database Size, Request Stats, Query Stats, Event Log, Connection Stats, and Missing Indexes. These datasets represent the current health and performance status of each database used in our solution, and will be subsequently post-processes to extract deltas and resource usage across the entire database tier. This Import Tasks utilizes normal ADO.NET connections to target databases and to their equivalent master databases (to collect Error Log and Connection Stats information), and the login used to connect must have the VIEW DATABASE STATE permission in order to be able to query these DMVs.
- TraceLogsImportTask, is extracting information from WADLogsTable table in the WAD target storage account, and captures all application generated through the various logging channels, like exceptions, execution times, etc.
With this architecture in mind, it is easy to extend the set of provided Import Tasks that we provided initially to cover new monitoring needs, like Windows Azure Storage Analytics or SQL Server instances running in Windows Azure Virtual Machines. All you have to do is create the appropriate Import Task that points to the data source, extracts related diagnostic information, and schedules its execution as we have described for all existing import tasks.
5. OpsStatsDB Walkthrough
OpsStatsDB project in CSF solution contains the implementation of the centralized repository of all our telemetry data. In the following picture you’ll get an idea of its schema:
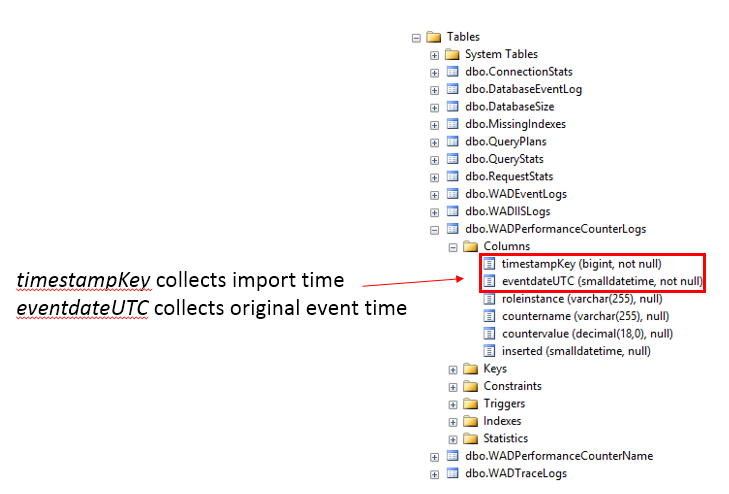
Figure 8
Tables closely map to the underlying data structures extracted by the various sources, as we decided to preserve the original data shape as much as possible (enriched with some useful new fields during the import task executions). We also built a processing layer on top of these base tables using a set of Table Valued Functions to extract curated information from these raw data. In the next article around Reporting, we will describe in great details the main TVFs we created as helper functions that facilitates the creation of reports and dashboards on top of telemetry data.
A future improvement we are considering is to further aggregate these raw data and create a real star schema implementation that will only store relevant facts at a specific granularity level, and discard raw data after some time. This would improve query performance and optimize storage space. However, even with the current implementation we have been able to store up to 1 year of diagnostic data into a single 150GB Azure SQL Database instance for a very large customer deployment (120 Compute nodes, 500 databases, etc.).
Windows Azure SQL Database requires that all tables contain a clustered index. As a design principle, we used a BIGINT filed called timestampKey as Clustered Index key in all our tables, and this represents the numerical transposition of the timestamp when a row has been processes by the related Import Task. This numeric field has the following format yyyymmddhhmmss. Creating the clustered index (mandatory on Azure SQL Database tables) on the timestampKey column also helps time-range queries that are pretty common analyzing historical trends in specific time intervals. We also provide a scalar function called dbo.fnConvertToTimeKey(‘datetime’) to simplify the conversion with a datetime value, as most of the query will have this format:

Figure 9 - OpsStatsDB typical query pattern
6. Conclusions
In this article we have guided you through the implementation of a data acquisition pipeline for the Telemetry component in the Cloud Service Fundamentals package. We encourage you to deploy this component and start monitoring your solutions in Windows Azure, collecting and aggregating data in a centralized repository where you can then run your own queries to correlate information coming from different sources and find patterns and events. In the next article, we will show you more examples of analytical queries to extract things like your database tier resource utilization, end-to-end execution time analysis, and how to turn these into reports and dashboards. Stay tuned!!
