Telemetry – Application Instrumentation
Written by Ewan Fairweather - Azure CAT
Introduction
This week we are publishing the second entry about the design and implementation of Telemetry in Cloud Service Fundamentals (CSF) on Windows Azure. In the previous entry of the CSF blog series, Telemetry Basics and Troubleshooting we described the basic principles around monitoring and application health. This included an introduction to the fundamental tools, information sources, and scripts that you can use to gain information about your deployed Windows Azure solutions. For many systems these standard tools and techniques are sufficient. However, for large-scale systems, collecting, correlating, and analyzing performance and health data requires a considerable effort. Telemetry planning starts during the early stages of application design and continues for the entire application lifecycle (test, deployment, and operations).
This article focuses on application instrumentation, because our applications are the greatest sources of information when it comes to monitoring. No matter what tool or approach you take to consume this information, you must first properly instrument your application. Without making instrumentation a high priority design task, you cannot achieve your manageability goals after the application goes into production. Effective application instrumentation is the first step toward providing yourself with the ability to identify and resolve issues in your distributed system. All aspects of your telemetry should be designed to scale with your application. This allows you to provide a high quality user experience, and identify upcoming problems before your users do; a task that becomes increasingly harder as your system grows without proper planning.
As you read this, you might feel that you are just too busy growing your user base and deploying new code features. You might think that you just don’t have the time to spare for telemetry planning. Be careful--there are many companies of yester-year who had a hot product or service, that at a certain point couldn’t scale and experienced one or more extended outages. Users often have little fidelity to any system that is unreliable. They might choose to just move elsewhere, perhaps to the upstart that is chasing on your heels and ready to capture your market.
CSF provides a number of components that will enable you to quickly instrument your application and build an effective telemetry system:
- A data access layer that implements retry logic and provides retry policies designed for scale.
- A logging framework built on top of NLOG.
- A set of logging wrappers and sample configuration for WAD that allows you to scale.
- A data pipeline that collects this information into a queryable operational store.
- A sample set of operational reports you can use to monitor your application.
By adopting these practices and utilizing theses re-usable components and configurations, your system can better scale. You can also gain insight into your application, which allows you to be targeted with your development effort and improve your operational efficiency. This ultimately makes your customers happier. Specifically in this post we will cover:
- Application instrumentation best practices.
- Implementation of the CSF instrumentation components.
- Practical examples of instrumentation scenarios.
Application Instrumentation Best Practices
In a future post we will cover the application development practices that have been used. However, it is important to recap a number of underlying general principles of large-scale distributed systems and the corresponding best practices for development.
Everything fails eventually
Given enough time and pressure everything fails. There are various failure scopes in a large distributed system. Failures can be at the individual node, service, or entire region. It is really important to consider how you want your application to behave in this scenario during the failure and how you will identify the root cause and apply remedial action—either automatically through application logic or manually via operational process. Effective application instrumentation allows you to react quicker and more effectively. You will be able to determine if the failure is transient or enduring, which requires intervention.
Application Practices That Can Help
This is a non-trivial task in a multi-component distributed system. A developer writing an application using the Windows Azure platform can automate the resolution of transient error conditions in a number of ways. These include:
- Add retry logic for connects for some transient errors.
- Deal with the unavailability (for example, if the database is down for a long time, by using an appropriate back-off policy).
- Add retry logic for command execution for some set of errors.
- Make intelligent decisions on whether to retry failures based on the command and error.
- Ensure that all external component and service calls are bounded to avoid thread exhaustion.
- Leverage asynchronous I/O and APIs where appropriate.
- Be mindful of convoy effects on failure recovery. Handle this appropriately in the data access layer (for example, by slowly increasing requests to a newly recovered service to avoid overwhelming it).
- Build a logging mechanism for all of this stuff to be able to track down failures to escalate resolution.
CSF provides re-usable components and a sample implementation for all of the above. In this entry we will focus on the instrumentation mechanism that CSF utilizes.
Note: For more information on application practices for the design of large-scale services see: Best Practices for the Design of Large-Scale Services on Windows Azure Cloud Services
Define what types of actions you want to take
The logical place to start is to define what you want to get out of your instrumentation; think action orientated. It might help to write four or five “I can” statements to determine the type of insight you require. This is exactly what we did when we built the CSF telemetry solution. Some examples might be:
- I can see the full exception details including any inner exceptions.
- I can see all retry attempts.
- I can quickly see all failures to connect to an external data source or service.
- I can monitor the current and average response times for all cross-component calls.
- I can determine the root component causing any failure condition without remote connecting to an instance.
Note: we do not recommend using exception.ToString(), because this does not typically provide all inner exceptions.
Then define what actions you need to take in order to satisfy these requirements:
- Every component must be instrumented.
- All cross-component and service-boundary communications must be logged for monitoring and alerting.
- All retry attempts and failures must be logged.
- All instrumentation must be configurable for production and test environments.
There are two typical categories of information you need. First, there is the information you need to know, such as month-on-month trending for capacity planning. Typically this comes from batch sources that you might need to process, such as IIS logs. The second category is action orientated information that you need to know about immediately, such as response times for service interaction; if this increases from 50 to 500 ms, you need to be notified so you can validate that the automated response in your data access layer is appropriate.
There are different types of questions you can ask of the data, some are well-defined, such as how many users were on my system during peak periods in the last month. Some might be exploratory in nature, such as what trends can be observed in graphs of key performance indicators (KPIs).
For some information you will need to have a historical average view of a window of data. For example, to determine weekly or monthly user growth, you need months of data; to detect service response time spikes, you only need a few seconds or minutes.
Ideally your instrumentation should allow you to catch deviations from normal behavior before they escalate to poor user experience or service degradation. A typical pattern with overloaded external resources, such as a database that is overwhelmed with too many concurrent threads, is that response times will increase before the problem escalates to complete unavailability. Consider how to avoid overwhelming systems which are in a recovery state. For example, if a system response time increases, has an outage, and then begins responding, your application should gradually ramp-up requests in line with response rates; this avoids a continual cascading failure condition. Break apart action-orientated information which needs to be queryable from things you need for reporting purposes. Filtering your action-orientated information is the key to keeping the size of it manageable. For this purpose you should have different categories of instrumentation. We use the term channels throughout the rest of the document to describe this.
The framework below from this presentation can be used to characterize the types of insight you require for your application.
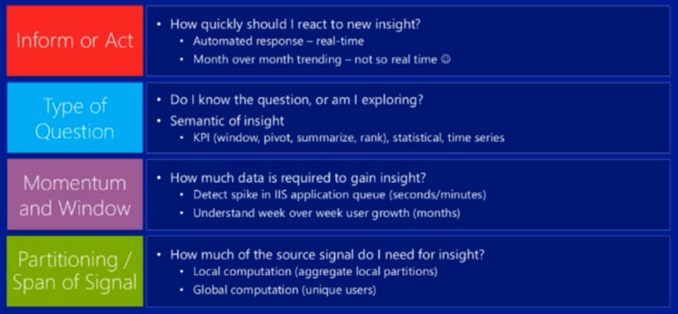
Figure 1: insights framework
Managing the amount of information
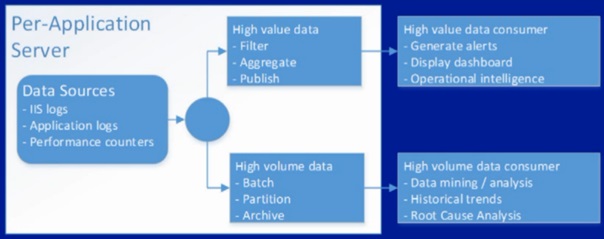
Large distributed systems collect huge volumes of instrumentation information. As described in the previous section, it is important to determine what information you need to know quickly in order to validate whether automated resolution functionality is working or whether you should take remedial action. Conceptually there are two types of channel of data, high-value and high-volume. High-value channel data must be quickly communicated, which involves filtering, aggregating, and publishing into a queryable repository. Other information is high-volume, such as IIS logs. This information is logged locally and then batched to Windows Azure Blob Storage on a periodic basis. The diagram below illustrates this.
Figure 2: High Value and High Volume
CSF Application Instrumentation – “What you need to build or use”
The baseline technology component for gathering and understanding telemetry on Windows Azure is Windows Azure Diagnostics (WAD). WAD consists of an agent that gathers data from individual instances and forwards them to a central collection point (storage account) as well as a set of standard structures and conventions for storing and accessing data.
For more information on enabling diagnostics in Windows Azure see Enabling Diagnostics in Windows Azure.
While the default Windows Azure diagnostics experience for .NET applications (System.Diagnostics + Windows Azure Diagnostics) is an excellent starting point, the default configuration needs to be modified in order to work well in a large-scale application. The CSFundamentals application includes a reference instrumentation implementation using NLog together with a scale-appropriate configuration of Windows Azure Diagnostics which we will walk through in this section. As we discussed earlier, in order for our instrumentation system to scale, we separate the bulky batch high-volume data from the high-value data which we want to query fairly quickly. The approach that we have implemented in CSF consists of three core components:
- An NLog implementation of the generic ILogger interface (allowing other logging implementations such as log4net to be plugged in without rippling through the code base).
- The NLog configuration, shared amongst all of the deployed services, and updatable at runtime.
- The Windows Azure Diagnostics (WAD) configuration, stored in diagnostics.wadcfg (one per deployed role).
Wiring Up WAD Custom Configuration in CSF
WAD configuration is driven by the Diagnostics.wadcfg file which is in each role project. This provides the ability to configure the items which you want WAD to copy on a periodic basis to a custom container in BLOB storage. The excerpt below shows the CSF Service Web role configuration, we have configured it to copy data from the “archive” folder in the “LogStorage” local resource, this will go to the “telemetry-logs” container in the storage account which WAD is configured to use in the cloud service configuration:
Figure 3: WAD Custom Configuration
In order to have reserved local storage, the cloud service definition file (ServiceDefinition.csdef) for each role in the CSF services is configured with a “LogStorage” local resource. As the excerpt below shows we have also increased the size of the default “DiagnosticsStore” to 8192 MB to allow for the capture of all WAD items we have configured.
Figure 4: DiagnosticsStore
You can also examine this on the Local Storage tab of the properties for any role in Visual Studio
To view the local storage log into one of the CSF Service roles by remote desktop, and browse to C:\Resources\Directory you will see two additional folders that have been created in the instance during deployment and creation. The image below shows this.
Figure 5: Storage log
Note: for more information on Local Storage Resources see:
Configure Local Storage Resources
CSF Logging Configuration
At this point we have shown you how to create a local resource and configure WAD to collect this on a periodic basis and move it to BLOB storage. The default CSF configuration specifies “PT5M” which means that we will copy the configured item and the custom local resource every 5 minutes. Each role project (e.g. CSFundamentalsService.WebRole) also contains an Nlog.config. The configuration that CSF provides serves to do a number of things. Firstly we register the custom extensions which are contained in the Microsoft.AzureCat.Patterns.Common assembly which is part of CSF. This contains a number of re-usable components including NLog implementation of the generic ILogger, which we’ll examine later. We define three asynchronous targets; App, Error, and API trace. As the excerpt shows below each of these asynchronous targets are configured to log to the logs location in the “LogStorage” local resource that we created earlier; it is then configured to move these to the archive location which we configured WAD to monitor every hour. For brevity the full file has not been included only these excerpts.
Figure 6: LogStorage
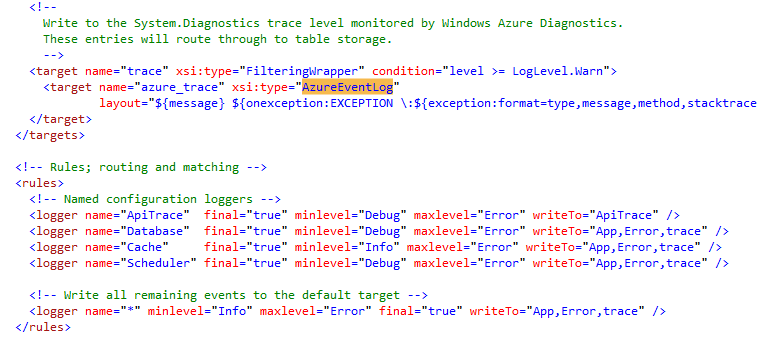
The fourth target which we specify is “trace” as can be seen this targets “azure_trace”, which has a type of “AzureEventLog”. This is a pass through to WAD table storage using System.Diagnostics.Trace. The configuration file then defines a number of logical associations for log channels (ApiTrace, Database, Cache, and Scheduler) all of which have configurable targets. This can be easily extended to add additional named loggers.
Figure 7: Azure Trace
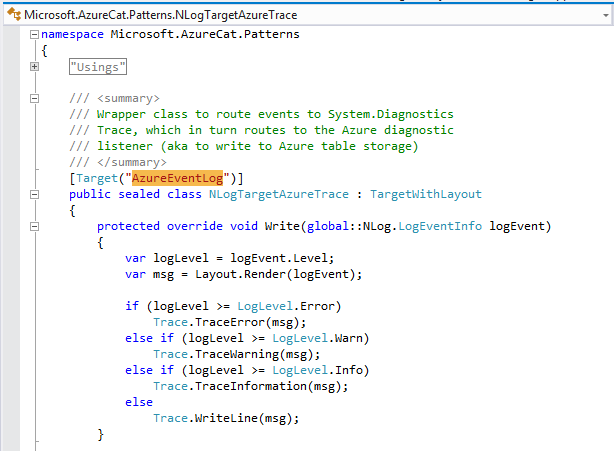
The NlogTargetAzureTrace is the wrapper class which the CSF Nlog implementation uses to route “trace” events to System.Diagnostics.Trace, which is in turn routed to the WAD listener and written to Windows Azure table storage. This class has the attribute target set to “AzureEventLog”. This is and the custom WAD directory monitoring configuration are a key part of the logging implementation; it allows us to leverage WAD for the underlying agent based configuration, network transfer, integrates with and provides a separation of channels across Windows Azure table and blob storage as appropriate.
Figure 8: NlogTargetAzureTrace
Underlying CSF Nlog Instrumentation Implementation
As we have shown you, CSF heavily relies on a custom WAD configuration for the underlying plumbing; to collect diagnostics information from all compute roles included in the solution and to consolidate them into a single Storage Account. This has the advantage that it is configurable and can be changed for different deployments based on your individual environment needs. The next recommended stage is to have a common logging framework, which abstracts that layer of difficulty from each developer. Most serious systems already do this with a data access layer for SQL or cache calls, to provide consistency and appropriate retry policies, because, over time, this means that our code base has a consistent approach for interacting with data sources. By building or leveraging a common logging framework, you can achieve a consistent instrumentation experience; this allows you to build on it over time and leverage this information in a full telemetry system. In this section we’ll walk through the CSF Nlog implementation, then we’ll show you some examples of how it is used throughout the application.
The generic ILogger interface (defined in ILogger.cs) provides a generic interface for employing tracing in your application. It also has overloads for directly accepting Exception objects (removing the responsibility of correctly unrolling an exception from the developer) and a specific channel for tracing API calls.
Note: this additional TraceApi() overload is designed to streamline the experience of logging all external service or component calls with timing information and context.
Each level (Debug, Info, Warning, Error) has three or four overloads:
void Warning(object message);
void Warning(Exception exception, object message);
void Warning(string fmt, params object[] vars);
void Warning(Exception exception, string fmt, params object[] vars);
The NLogWrapper class (defined in NlogWrapper.cs) provides an NLog implementation of the ILogger interface. This approach is taken to allow other logging implementations to be easily added. A Nlog Logger object is defined:
private Logger _log;
This is used throughout to route the interface calls to underlying NLog calls:
public void Warning(Exception exception, object message)
{
_log.WarnException(message.ToString(), exception);
}
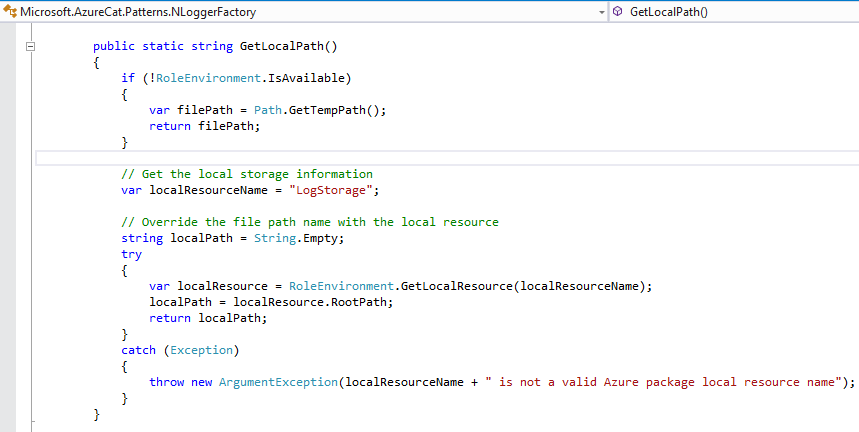
To allow streamlined logging messages, the ILogger interface is used by requesting an ILogger from a logger factory, the CSF project provides an NLog implementation of this NLoggerFactory which is in NLogFactory.cs. This includes the InitializeForCloud() method which is used to extract Windows Azure specific configuration; and locates the Nlog.config file which must be included in the project for each role. The named log channels we examined earlier (Database, Caching, etc) are configured at this point, and the factory is used to access them and execute logging methods. As shown below the “LogStorage” local resource which we defined earlier is used by this factory as the default path for logging data; this is done by utilizing the appropriate method from the Windows Azure Service RunTime API:
Figure 9: NLoggerFactory
CSF Application Instrumentation
We will now examine a number of use cases where CSF utilizes the instrumentation framework we have described. The abstract class, MethodRunner, in MethodRunner.cs is the base class used by the data access layer and the scheduler service. As shown below a logger object is lazy initialized using the LoggerFactory we discussed earlier:
/// <summary>
/// Instantiate the underlying policies and logging logging
/// </summary>
/// <param name="logName"></param>
protected MethodRunner(string componentName, string logName = "Log", bool timeMethods = true)
{
LoggerLazy = new Lazy<ILogger>(() => { return LoggerFactory.GetLogger(logName); });
_timeMethods = timeMethods;
_componentName = componentName;
_logName = logName;
}
The MethodRunner abstract class contains generic methods, such as Execute, which provides the underlying calls to the NLogWrapper.cs ILogger implementation via the factory object:
/// <summary>
/// Given a method which does not return any data, time and trace the execution of the method
/// </summary>
/// <param name="func"></param>
/// <param name="methodName"></param>
/// <param name="vars"></param>
protected virtual void Execute(Action func, string methodName, params object[] vars)
{
try
{
Stopwatch stopWatch = null;
if (_timeMethods && !String.IsNullOrEmpty(methodName))
{
stopWatch = Stopwatch.StartNew();
}
func();
if (stopWatch != null)
{
stopWatch.Stop();
Logger.TraceApi(String.Format("{0}.{1}", _componentName, methodName), stopWatch.Elapsed);
}
}
catch (Exception ex)
{
Logger.Warning(ex, "Error in {0}:{1}", _componentName, methodName);
throw;
}
}
}
}
A number of the CSF classes implement the MethodRunner abstract class, for example SQLAzureDalBase in SqlAzureDalBase.cs. As can be seen in the constructor it specifies the “Database” log channel which we saw defined earlier in the Nlog.config. This can easily be adjusted to your own custom log channel:
public abstract class SqlAzureDalBase : MethodRunner
//Omitted code for brevity
public SqlAzureDalBase(string componentName, RetryPolicy policy, bool logRetries = false, bool timeMethods = false)
: base(componentName, "Database", timeMethods)
{
_logRetries = logRetries;
_policy = policy;
}
These CSF classes encapsulate the best practices of logging all exception details, capturing all retry attempts and component execution information. We will now walk through a couple of examples. The first technique we will cover is the stopwatch example, this is useful for logging the execution times when querying external services or databases. The ExecuteSql method in the SQLAzureDalBase class demonstrates how you can instantiate a new Stopwatch object and use this to time and log to the Logger object the elapsed time. If an exception occurs the helper class method AzureSqlDatabaseError.LogSqlError is called to log this to the appropriate logger. This helper class is used because it provides additional logic to determine if the Azure SQL database exception is a transient or enduring error.
protected void ExecuteSql(Action action,
string connectionString = null, string methodName = null)
{
Stopwatch stopWatch = null;
try
{
if (TimeMethods && !String.IsNullOrEmpty(methodName))
{
stopWatch = Stopwatch.StartNew();
}
_policy.Execute(() =>
{
action();
});
if (stopWatch != null)
{
stopWatch.Stop();
Logger.TraceApi(String.Format("{0}.{1}", ComponentName, methodName), stopWatch.Elapsed);
}
}
catch (SqlException ex0)
{
System.Nullable<TimeSpan> elasped = (stopWatch == null) ?
null : new System.Nullable<TimeSpan>(stopWatch.Elapsed);
AzureSqlDatabaseError.LogSqlError(Logger, ex0, connectionString, elasped, methodName);
}
catch (Exception ex1)
{
Logger.Warning(ex1, "Error in {0}:{1}", ComponentName, methodName);
throw;
}
}
By building the base data access classes on MethodRunner, which in turn uses the ILogger interface and underlying factor we covered earlier, it means that we have a consistent instrumentation experience across CSF. As the excerpt above shows the full exception is always logged, not exception.ToString () which can sometimes miss inner exception details.
Summary
This article has provided you with an understanding of the CSF instrumentation framework, and provided examples which you can use in order to adopt these practices in your application. By providing a consistent instrumentation for all error handling including component information and contextual tracing it will enable you to quickly get an understanding of error events, root causes, and resolutions. Using the CSF instrumentation framework will provide you and your developers with a cheap, consistent way to implement extensible logging across your application. This will provide the ability to quickly correlate events, and give you a greater understanding of your users’ experience.
Some of the key things to remember as you implement instrumentation in your application:
- Log all API calls to external services with context, destination, method, timing information (latency), and result (success/failure/retries). Use the chunky logging channel to avoid overwhelming the diagnostics system with telemetry information.
- Log the full exception details, do not use exception.ToString().
- Data written into table storage (performance counters, event logs, trace events) are written in a temporal partition that is 60 seconds wide. Attempting to write too much data (too many point sources, too low a collection interval) can overwhelm this partition. Ensure that error spikes do not trigger a high volume insert attempt into table storage, as this might trigger a throttling event.
- Capture and log retry logic information.
- Collect database and other service response times using the stopwatch approach.
- Use common logging libraries, such as the Enterprise Application Framework Library, log4net or NLog, to implement bulk logging to local files. Use a custom data source in the diagnostic monitor configuration to copy this information periodically to blob storage.
- Create separate channels for chunky (high-volume, high-latency, granular data) and chatty (low-volume, low-latency, high-value data) telemetry.
- Use standard Windows Azure Diagnostics sources, such as performance counters and traces, for chatty information.
- Do not publish live site data and telemetry into the same storage account. Use a dedicated storage account for diagnostics.
- Choose an appropriate collection interval (5 min – 15 min) to reduce the amount of data that must be transferred and analyzed e.g. “PT5M”.
- Ensure that logging configuration can be modified at run-time without forcing instance resets. Also verify that the configuration is sufficiently granular to enable logging for specific aspects of the system, such as database, cache, or other services.
Windows Azure Diagnostics does not out of the box provide data collection for dependent services, such as SQL Database or a distributed cache. In the next article in this series we will explore the data pipeline that we have implemented to provide a comprehensive view of the overall CSF application and its performance characteristics; this includes how we capture this information in a relational operational store and provide you with an overall view across the Windows Azure platform.
