SharePoint 2010: Search using the KeywordQuery class
Introduction
You can use the KeywordQuery class to search SharePoint content using a search query string formatted in the same way you would if you used the Search Center user interface. This makes it really easy to structure (and test) search queries for use in your applications.
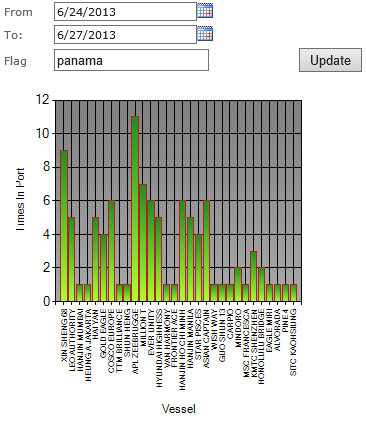
In this example, I have a SharePoint list that has a little over 300,000 items in it. The items are of ships moving in and out of a shipping port. My example webpart is going to allow a user to enter the flag of country and date range. Using these inputs, it will search the data in SharePoint and return a DataTable of results, from all lists with a specific content type (the shipping data), within the time period and with the specified flag. Finally, the data will be presented in a chart.
Example
1. To get started, open Visual Studio and create a new Farm based Empty SharePoint solution
2. Add a project reference to Microsoft.Office.Server.Search, and System.Web.DataVisualization, then add the required using statements
using System.Web.UI.WebControls.WebParts;
using Microsoft.Office.Server.Search.Administration;
using Microsoft.Office.Server.Search.Query;
using Microsoft.SharePoint;
using Microsoft.SharePoint.WebControls;
using SortDirection = Microsoft.Office.Server.Search.Query.SortDirection;
using System.Web.UI.DataVisualization.Charting;
- Add a new Standard Webpart to the page, giving it the name VesselMovement
- Add controls to the class for selecting a date range, entering a flag, updating results and displaying the details in a chart.
private Button _update;
private Chart _chart;
private TextBox _flag;
private DateTimeControl _fromDate;
private DateTimeControl _toDate;
- Initialise the controls in the OnInit method, then add them to the page in the CreateChildControls method
protected override  void OnInit(EventArgs e)
{
    base.OnInit(e);
    _update = new  Button() { Text = "Update"  };
    _update.Click += UpdateOnClick;
    _chart = new  Chart();
    _flag = new  TextBox();
    _fromDate = new  DateTimeControl();
    _fromDate.SelectedDate = DateTime.Now.AddMonths(-1);
    _fromDate.DateOnly = true;
    _toDate = new  DateTimeControl();
    _toDate.SelectedDate = DateTime.Now;
    _toDate.DateOnly = true;
}

protected override  void CreateChildControls()
{
    Controls.Add(new LiteralControl("<table style=\"width:400px;border:0;\">"));
    Controls.Add(new LiteralControl("<tr><td><span>From</span>"));
    Controls.Add(new LiteralControl("</td><td colspan=\"2\">"));
    Controls.Add(_fromDate);
    Controls.Add(new LiteralControl("</td></tr><tr><td><span>To:</span></td><td colspan=\"2\">"));
    Controls.Add(_toDate);
    Controls.Add(new LiteralControl("</td></tr><tr><td><span>Flag</span></td><td>"));
    Controls.Add(_flag);
    Controls.Add(new LiteralControl("</td><td>"));
    Controls.Add(_update);
    Controls.Add(new LiteralControl("</td></tr></table>"));
    Controls.Add(new LiteralControl("<div style=\"margin-top:5px;\">"));
    Controls.Add(_chart);
    Controls.Add(new LiteralControl("</div>"));
}
- Create a new method, called GetVesselData, that will use the KeywordQuery class to perform a search using SharePoint's search engine. This method will return a DataTable containing the search results.
private DataTable GetVesselData(String flag, String dateRangeFrom, String dateRangeTo)
{
    try
    {
        var ssaProxy = (SearchServiceApplicationProxy)SearchServiceApplicationProxy.GetProxy(SPServiceContext.GetContext(SPContext.Current.Site));
        var keywordQuery = new  KeywordQuery(ssaProxy);
        keywordQuery.RowLimit = 100;
        keywordQuery.SelectProperties.Clear();
        //Add properties to return
        keywordQuery.SelectProperties.Add("Title");
        keywordQuery.SelectProperties.Add("PrimaryDate");
        //trim duplicates
        keywordQuery.TrimDuplicates = true;
        //Sort the results on a custom field, PrimaryDate (Mangaged Property)
        keywordQuery.SortList.Add("PrimaryDate", SortDirection.Descending);
        keywordQuery.ResultsProvider = SearchProvider.Default;
        keywordQuery.ResultTypes |= ResultType.RelevantResults;
        //Create the search query
        keywordQuery.QueryText = String.Format("FLAG:\"{0}\" AND contenttype:SMARShipMovement AND (PRIMARYDATE>{1} AND PRIMARYDATE<{2})", flag, dateRangeFrom, dateRangeTo);
        ResultTableCollection searchResults;
        try
        {
            searchResults = keywordQuery.Execute();
        }
        catch (Exception)
        {
            //"Your query is malformed. Please rephrase your query."
            return new  DataTable();
        }
        if (searchResults.Exists(ResultType.RelevantResults))
        {
            var searchResult = searchResults[ResultType.RelevantResults];
            var results = new  DataTable { TableName = "SearchResults"};
            results.Load(searchResult, LoadOption.OverwriteChanges);
            return results;
        }
    }
    catch (Exception e)
    {
        //Unhandled Exception running query
    }
    return new  DataTable();
}
- Using the datatable, we can now display the results in a number of ways. One way would be to display the data in an SPGridView. In this example though, we are going to display the data in a chart. To do this, we'll pass the datatable to another method, that will group and count the data, then display it in a chart.
private void  PopulateChart(DataTable dataTable)
{
    try
    {
        _chart.Width = 315;
        _chart.Height = 350;
        _chart.AntiAliasing = AntiAliasingStyles.All;
        _chart.TextAntiAliasingQuality = TextAntiAliasingQuality.High;
        Series s = PlotVesselActivity(dataTable);
        ChartArea ca = ChartArea();
        _chart.ChartAreas.Add(ca);
        _chart.Series.Add(s);
        _chart.Visible = true;
    }
    catch
    {
        _chart.Visible = false;
    }
}

private static  ChartArea ChartArea()
{
    ChartArea chartArea = new  ChartArea();
    chartArea.BackColor = Color.Gray;
    chartArea.BackSecondaryColor = Color.DarkGray;
    chartArea.BackGradientStyle = GradientStyle.TopBottom;
    chartArea.AxisY.Title = "Times In Port";
    chartArea.AxisY.IsStartedFromZero = false;
    chartArea.AxisX.Title = "Vessel";
    chartArea.AxisX.Interval = 1;
    return chartArea;
}

private Series PlotVesselActivity(DataTable dataTable)
{
    var series = new  Series();
    series.Color = Color.ForestGreen;
    series.BackSecondaryColor = Color.GreenYellow;
    series.BorderColor = Color.Firebrick;
    series.BackGradientStyle = GradientStyle.TopBottom;

    var dv = new  DataView(dataTable);
    var groupedData = dv.ToTable(true, new[] { "Title" });
    groupedData.Columns.Add("Count", typeof(int));
    foreach (DataRow row in groupedData.Rows)
    {
        row["Count"] = dataTable.Compute("Count(Title)", "Title = '" + row["Title"] + "'");
    }
    var xpoint = 0;
    foreach (DataRow r in groupedData.Rows)
    {
        var p = new  DataPoint
        {
            XValue = xpoint,
            YValues = new  double[] { Convert.ToDouble(r["Count"].ToString()) },
            Name = r["Title"].ToString(),
            AxisLabel = r["Title"].ToString()
        };
        xpoint++;
        series.Points.Add(p);
    }
    return series;
}
- Finally, add code for the Update button OnClick event. The OnClick event will pass the selected flag and date range through to the GetVesselData method
private void  UpdateOnClick(object  sender, EventArgs eventArgs)
{
    if (Page.IsPostBack)
    {
        var results = GetVesselData(_flag.Text, _fromDate.SelectedDate.ToShortDateString(), _toDate.SelectedDate.ToShortDateString());
        PopulateChart(results);
    }
}
The finished results looks like this:

See Also
An important place to find a huge amount of SharePoint related articles is the TechNet Wiki itself. The best entry point is SharePoint Resources on the TechNet Wiki